
Index Providers Disagree on Growth and Value
How have growth and value compared in 2023? It depends on how you define them.
/s3.amazonaws.com/arc-authors/morningstar/30e2fda6-bf21-4e54-9e50-831a2bcccd80.jpg)

Growth index funds have charted a smoother start to 2023 than their value counterparts. Just how much smoother depends on the indexes in question.
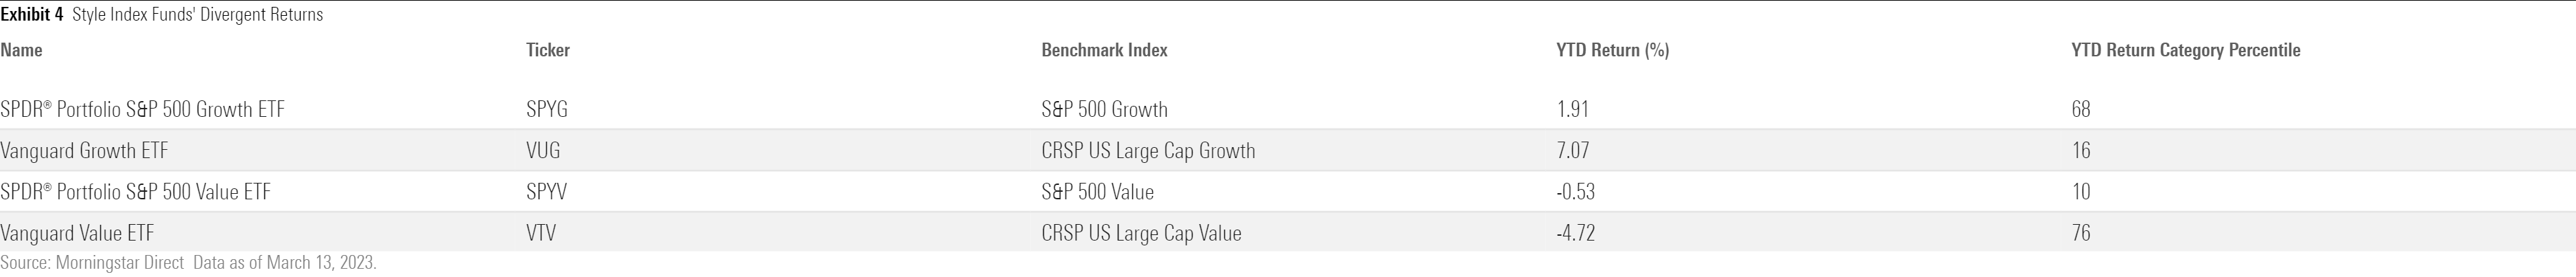
SPDR Portfolio S&P 500 Growth ETF SPYG climbed 1.91% from January 2023 through March 13, 2023. That constituted success compared with its value twin, SPDR Portfolio S&P 500 Value ETF SPYV, which pulled back 0.53%. But next to Vanguard Growth ETF VUG—a fellow large-growth index fund and reasonable alternative—it raises questions. VUG’s 7.07% gain over the same year-to-date span trounced SPYG and beat its own value counterpart, Vanguard Value ETF VTV, by 11.79 percentage points.*
Discreet differences in index construction explain how the S&P value and growth index trackers ran neck-and-neck as the CRSP indexes that underpin VUG and VTV diverged. These index idiosyncrasies can drive different outcomes for investors, and they are most pronounced in the small-cap arena.
Nuances in Growth and Value Index Funds
Index providers build most style-oriented benchmarks by carving a broad universe of stocks, like the S&P 1500 Index, into different segments based on constituents’ size and style traits. Index providers differentiate themselves with distinct definitions of size and style. For example, the S&P 500 Growth Index leans larger because it chooses from 500 of the largest U.S. stocks, while the CRSP U.S. Large Cap Growth Index pulls from the market’s heftiest 85%—an approach that historically added about 50-150 companies beyond the largest 500.
Measuring style is more nuanced than size. Exhibit 1 illustrates how S&P and CRSP indexes define value and growth, with shared criteria bolded. Both index providers score firms on the listed criteria, routing those that represent the cheaper half of the universe to the value portfolio and the richer half to the growth index. Despite a few different style components, these benchmarks usually draw similar lines in the sand.

That said, the S&P indexes’ momentum feature can be a stylistic wild card. Momentum posits that the market’s recent outperformers will continue to outperform in the near term. That description often applies to growth stocks, but cheaper firms can check the momentum box during value rallies. Such was the case toward the end of 2022, when the cheapest stocks were many of the bear market’s most resilient.
The momentum component sparked a flurry of unusual index changes when the S&P indexes rebalanced in December 2022. SPYG cut exposure to the tech and consumer discretionary sectors, two of the worst performing sectors in 2022, by a combined 15 percentage points. It filled the void with stocks from top-performing sectors—healthcare, energy, and consumer staples—whose collective weight swelled from about 16% to 37% overnight. Exxon Mobil XOM, Chevron CVX, Johnson & Johnson JNJ, and Merck MRK all entered the fray as top-20 holdings after previously residing in the value index. Meanwhile, VUG stood pat: None of its sector weights moved by more than 1.5 percentage points.
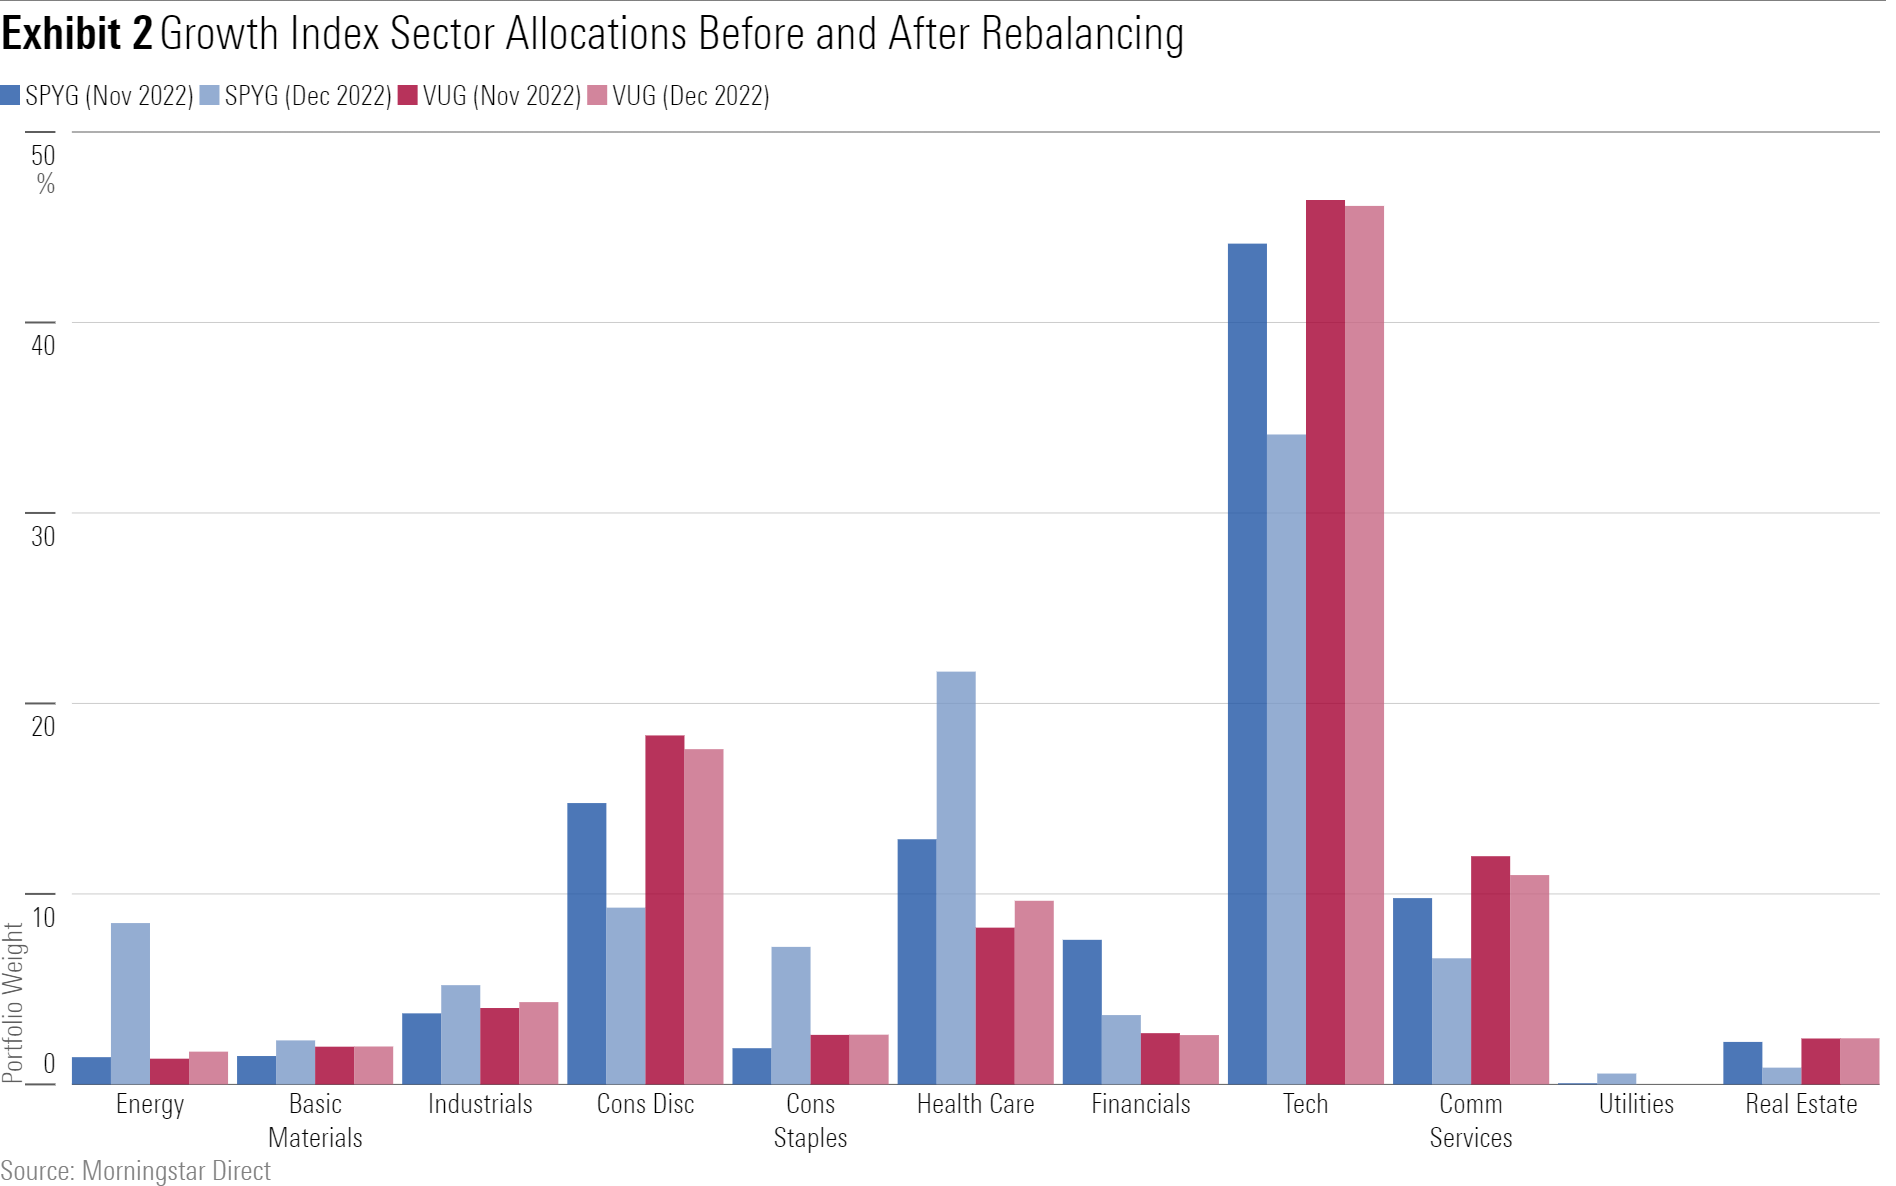
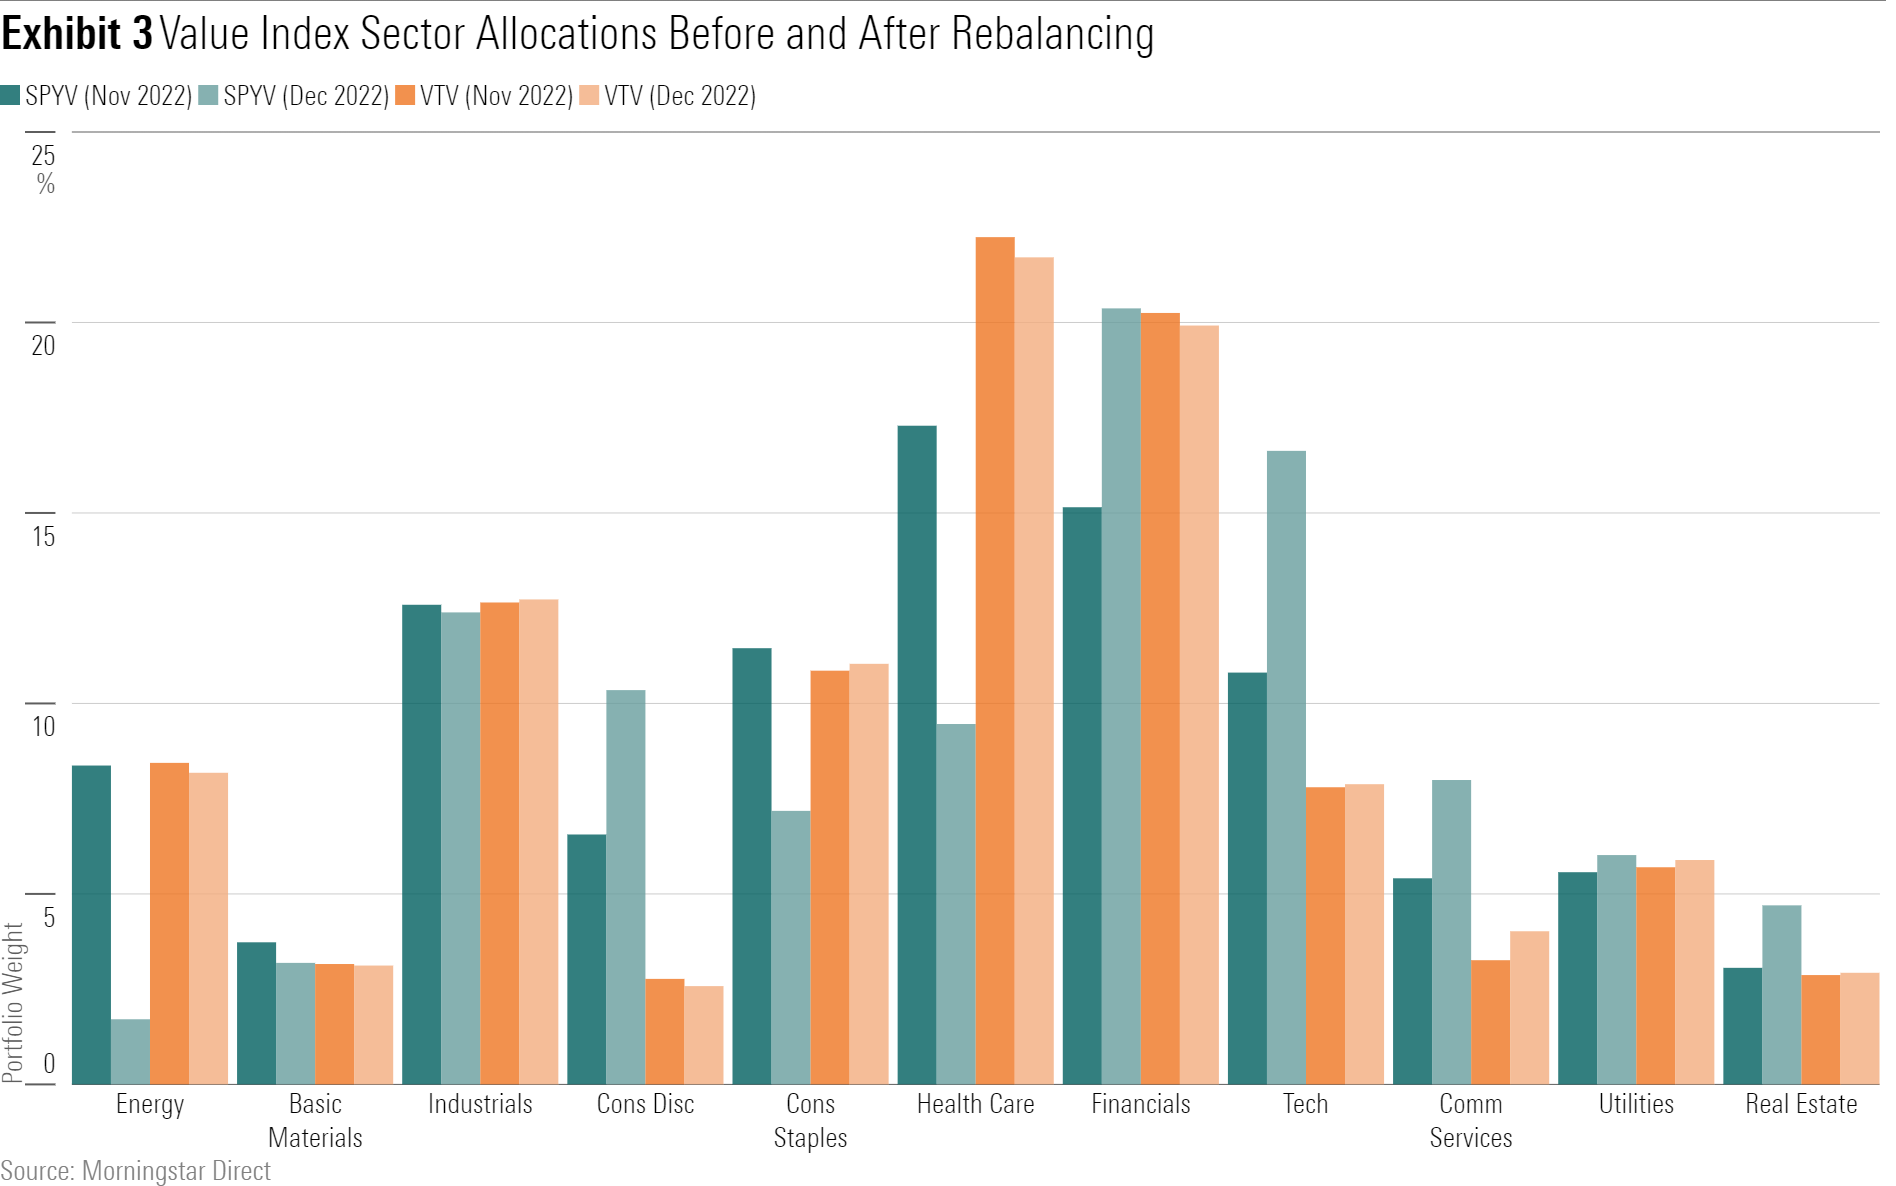
On the flip side of the rebalance, SPYV scooped up most of what SPYG discarded. Its tech and consumer discretionary exposure climbed by 10 combined percentage points as Microsoft MSFT, Amazon.com AMZN, and Meta META cannonballed into the top-10 holdings. The fund halved its exposure to the healthcare, energy, and consumer staples firms that served as ballast in 2022. VTV welcomed Meta to its ranks, too, but no other addition or subtraction represented more than 0.2% of that portfolio.
The S&P indexes’ December shuffle has so far been disastrous for SPYG. The battered tech and consumer discretionary firms it sold have fared far better than the companies that replaced them. The fund has watched former holdings Meta and Salesforce CRM power VUG and other growth peers with excellent 2023 rebounds. Meanwhile, newly boosted stakes in healthcare firms Pfizer PFE, UnitedHealth Group UNH, and Johnson & Johnson—all absent from VUG—sapped returns, as each firm lost between 12% and 22% for the year to date through March 13.
On the other hand, SPYG’s trash is SPYV’s treasure. Many of its new additions have flourished, while those it traded to its counterpart have floundered. That pushed SPYV well ahead of VTV, which didn’t unload the same stocks at its quieter December 2022 rebalance.
Down the Ladder
How index providers choose to gerrymander the stock universe by size and style leads to even more disparity between small-cap index strategies. At the end of January 2023, iShares S&P Small-Cap 600 Growth ETF IJT and Vanguard Small-Cap Growth ETF VBK shared only 11% of their portfolios. For investors seeking small-growth exposure, these two index funds—commonly misunderstood to be interchangeable measures of that market—offer entirely different portfolios.
Much of the difference owes to the index providers’ different definitions of “small cap.” S&P draws the border much lower than CRSP, leaving IJT with an average market capitalization about half the size of VBK. That proved to be a headwind early in 2023. IJT shed 1.86% for the year to date through March 13, 2023, trailing VBK by 4.56 percentage points.
IJT also trailed iShares S&P Small-Cap 600 Value ETF IJS by 1.9 percentage points over that span. In this case, the S&P value index beat its growth counterpart in category-relative and absolute terms. A recent rebalancing is not to blame here, though. IJS has stayed above water in 2023 thanks to enormous returns from a select few longer-term holdings, like Myriad Genetics MYGN (purchased December 2018) and Cinemark CNK (August 2021).
Thinking Long Term
Divergent performance between S&P’s and CRSP’s style indexes in 2023 is a reminder that when it comes to indexes, the devil is in the details. But it’s important to stay focused on the big picture. All of the ETFs mentioned in this piece earn Morningstar Analyst Ratings of Bronze or better because they are sensibly constructed, cheap, and backed by strong organizations. An ill-timed rebalance does not diminish these funds’ credibility.
Moreover, style definition nuances tend to wash out over time. VUG led SPYG by just 22 basis points annualized from its January 2004 inception through March 13, 2023, despite numerous stretches like early 2023. Falling behind its competitors does not always mean an index fund is in disarray. Oftentimes, the best action for these fundholders is to take no action at all.
* Vanguard also offers ETFs that track S&P style indexes. CRSP’s size and value/growth definitions do not reflect Vanguard’s view on how best to draw index borders, nor do S&P’s measurements reflect State Street’s view.
The author or authors own shares in one or more securities mentioned in this article. Find out about Morningstar’s editorial policies.
/d10o6nnig0wrdw.cloudfront.net/09-25-2023/t_f3a19a3382db4855b642d8e3207aba10_name_file_960x540_1600_v4_.jpg)
/d10o6nnig0wrdw.cloudfront.net/04-09-2024/t_e87d9a06e6904d6f97765a0784117913_name_file_960x540_1600_v4_.jpg)
/cloudfront-us-east-1.images.arcpublishing.com/morningstar/T2LGZCEHBZBJJPPKHO7Y4EEKSM.png)
:quality(80)/s3.amazonaws.com/arc-authors/morningstar/30e2fda6-bf21-4e54-9e50-831a2bcccd80.jpg)