
What to Expect From Bond Total Returns When Interest Rates Rise
A basic understanding of bond math can help investors stay the course.

Bond math isn’t always intuitive, but a basic understanding of it lies within most investors’ grasp and can help them stay the course in turbulent markets. From 2021 to 2022, for example, the bellwether Morningstar US Core Bond Index lost money two years in a row, with its 13% drop in 2022 representing bonds’ worst calendar-year showing in the nearly 50 years since modern benchmarking began.
The year 2022 provided a harsh reminder that when interest rates rise, bond prices drop until their yield matches that of new issues; however, there’s a silver lining amid those losses. Provided that a bond does not default, its price returns to par as it nears maturity. Meanwhile, investors who reinvest the bond’s coupon payments at higher interest rates eventually earn more than if the bond’s price had never fallen in the first place.
3 Questions
These are the basic dynamics of the bond price-yield relationship, whether one invests in individual issues or bond funds. It is worth going a bit further to frame expectations for bond total returns in the aftermath of a rapid change in interest rates. By focusing on an individual bond and utilizing some simplifying assumptions, we will answer three questions:
1) How long until your return equals the annualized yield to maturity at which you bought the bond?
2) How long would your return be negative if you had to sell before maturity?
3) What will your final total return be at maturity?
Simplifying Assumptions and Background
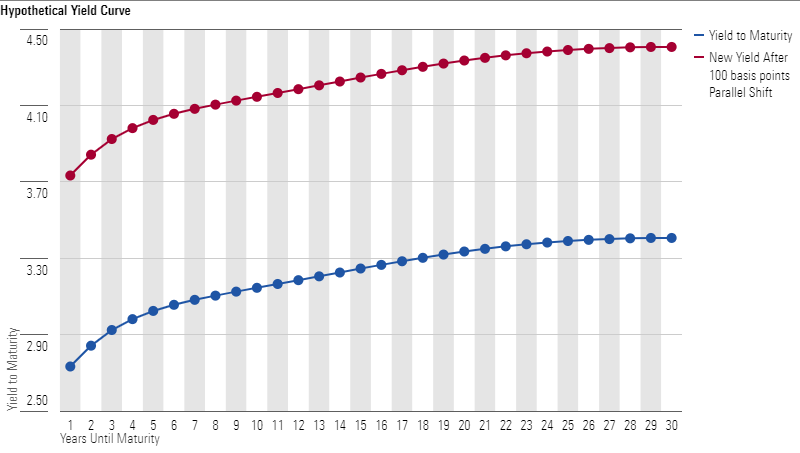
To keep things simple, we’re assuming our individual bond lacks embedded call options and can be relied on for timely payments of interest and principal, meaning that it won’t default—all features we expect of a U.S. Treasury bond. We will also assume a parallel rise in interest rates across the yield curve (a point-in-time plot of interest rates running from the shortest to longest maturities of a given issuer).
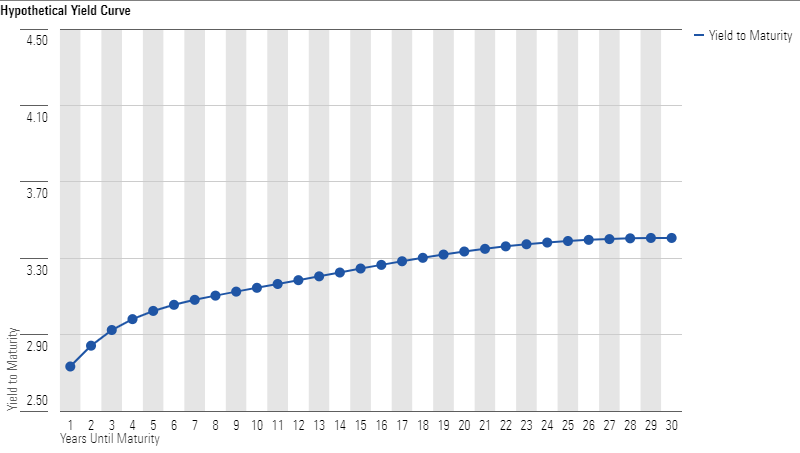
If the yield for a one-year bond near the front end of the curve goes up by 100 basis points, for example, a parallel shift would move up the yield for the same issuer’s 30-year bond, by the same amount, at the long end of the curve. Finally, our example will assume that rates go up in the first six months of the bond’s life and then stay at that same level for its remainder—from the first coupon payment and reinvestment until the last.
The bond math under these assumptions has long been understood, but the terminology has evolved over the decades. In 1938, Frederick Macaulay introduced the aptly named “Macaulay duration.” Noting that a bond’s maturity alone tells you nothing about the size or timing of its payments, his measure focused on the weighted-average time in years for receiving all a bond’s cash flows. For zero-coupon bonds, for example, where there is one lump sum payment at the end, Macaulay duration is equal to maturity. For the typical bond that makes semiannual coupon payments, it’s always less than maturity because you begin getting cash flows every year in the form of coupon payments.
Macaulay duration improved upon maturity alone, but practitioners later realized that it could be modified to reflect sensitivity to interest rates. “Modified duration” is a measure of a bond’s sensitivity to a sudden and parallel shift in the yield curve. For each year of modified duration then, a bond’s price could be expected to move 100 basis points for every 100-basis-point move in interest rates.
The measure is an approximation, and more accurate with smaller shifts, but it helps to set expectations. For example, the price of a bond with a five-year duration would drop about 500 basis points if yields increased 100 basis points, whereas the price of a bond with a three-year duration would only drop roughly 300 basis points. The longer the duration number, in other words, the greater sensitivity to interest-rate changes. For bonds without embedded options, this understanding of duration is the industry standard.
Answering Question One
But there’s another way to think about duration, and that brings us to the question concerning the wait time until your annualized total return equals the bond’s initial yield to maturity. The time frame at which you earn your initial yield equals the bond’s duration, no matter what happens to interest rates in the meantime. This is not common knowledge, but that’s how the math works, and it’s another perspective on duration. So, if you have a bond with a 4% yield to maturity and a duration of 8.0 years, your total return after eight years will be an annualized 4% regardless of what happens to interest rates in the interim.
Answering Questions Two and Three Through Illustrations
Neither the second nor the third question has a canned answer, so to address them, we will use illustrations of total return as a function of time relative to interest-rate shifts and a bond’s maturity. Although bond prices initially move in the opposite direct of interest-rate changes, if yields go up and you continue investing coupons at that higher rate and hold the bond to maturity, then your total return will be higher. Conversely, a drop in interest rates might help your bond price in the short term, but reinvesting coupons at a then-lower rate until maturity will result in a lower total return.
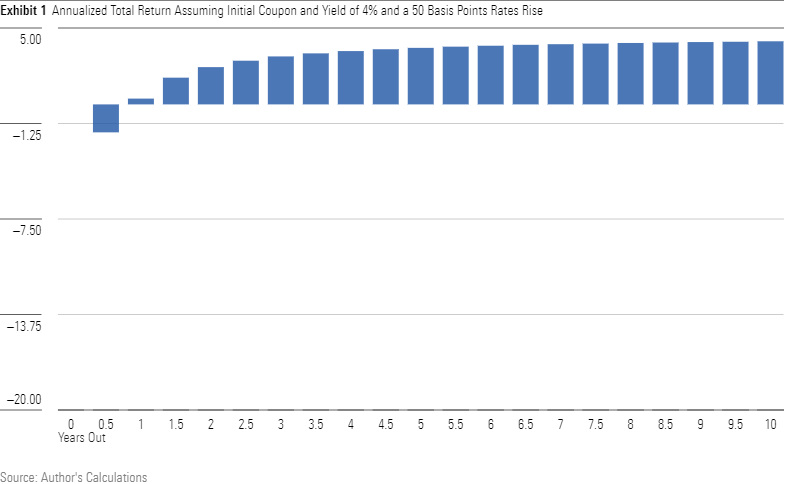
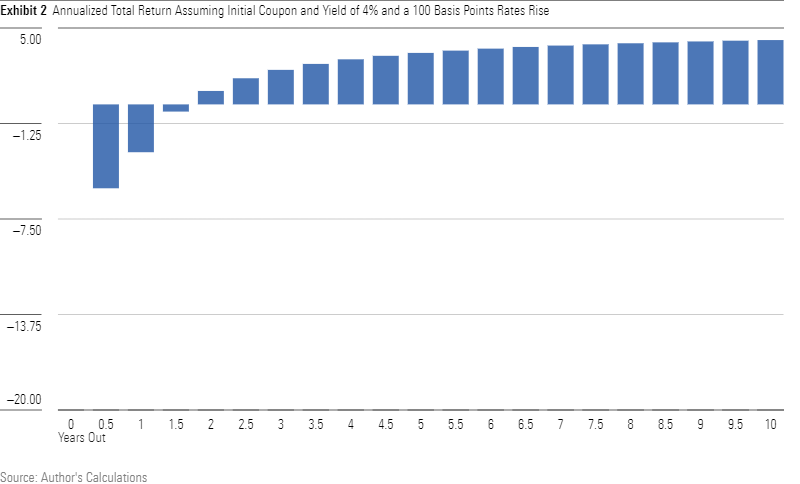
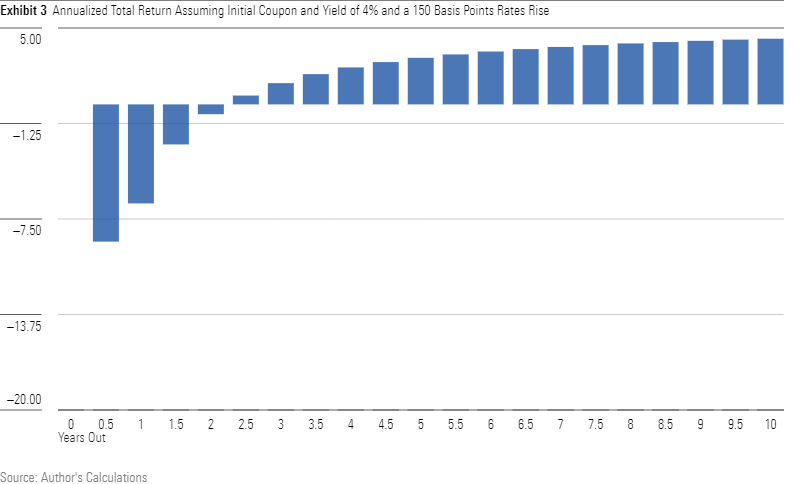
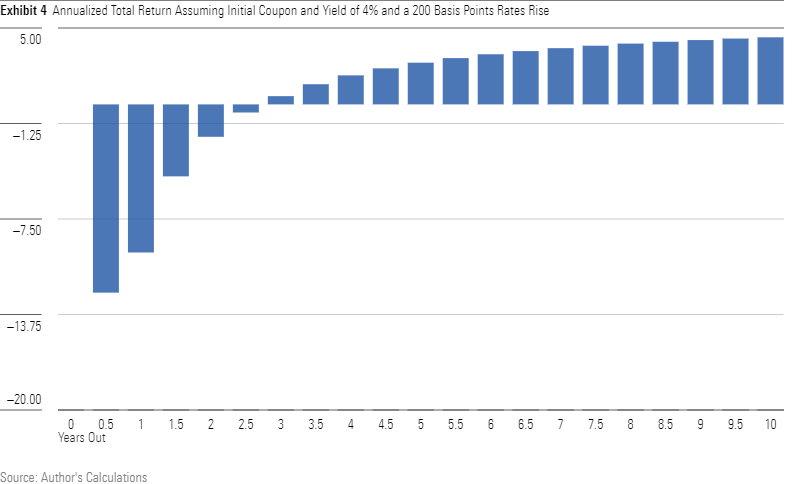
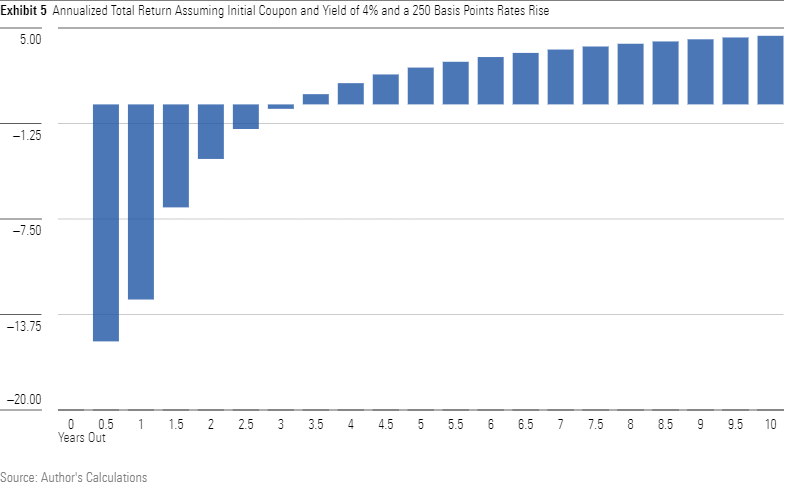
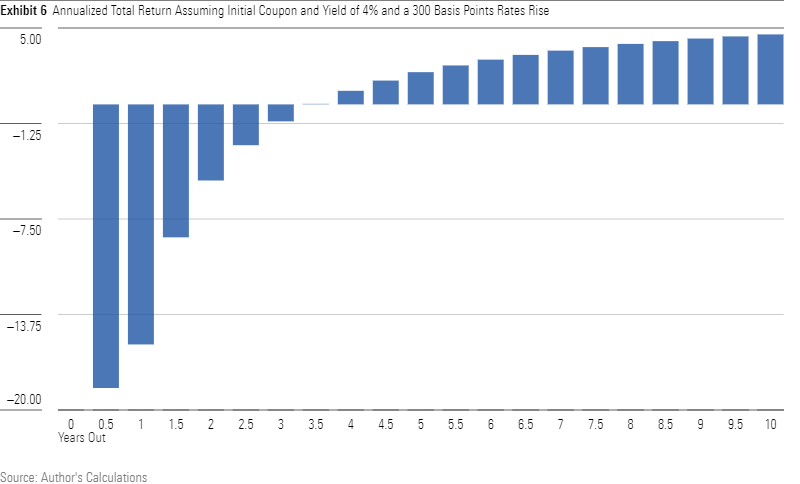
To illustrate the effect on rising interest rates, let’s look at several examples at the end of this article, starting with an increase of 50 basis points (Exhibit 1) and then continuing with additional illustrations in increments of 50 until we reach 300 basis points (Exhibit 6). In each case, as a reminder, market yields increase once—prior to the first coupon payment—and then stay at that elevated level for the remainder of the bond’s life.
The accompanying exhibits show that, for smaller increases, the period of negative return is relatively short and the initial losses small—less than a year for a 50-basis-point rise, less than two years for 100 basis points. But at bigger increases, both the losses and the period of negative return are more dramatic. If rates were to rise 300 basis points, the initial drop in value would be close to 20%, and it would take four years to clear the no-loss threshold. Yet, in the end, one would have made 4.58% in total return as reinvested coupon payments took advantage of the higher rates and so compounded more rapidly.
The Advantage of Bond Math
Even with simplifying assumptions, understanding bond math can be a challenge. But it’s worth it. Armed with knowledge about the bond-price yield relationship, concepts like duration, and the power of reinvesting coupons, investors can make informed judgments about how to navigate bond market downturns well.
The author or authors do not own shares in any securities mentioned in this article. Find out about Morningstar’s editorial policies.
/d10o6nnig0wrdw.cloudfront.net/04-25-2024/t_d30270f760794625a1e74b94c0d352af_name_file_960x540_1600_v4_.jpg)
/cloudfront-us-east-1.images.arcpublishing.com/morningstar/DOXM5RLEKJHX5B6OIEWSUMX6X4.png)
/cloudfront-us-east-1.images.arcpublishing.com/morningstar/ZKOY2ZAHLJVJJMCLXHIVFME56M.jpg)