
Geographic Risks of Rental Property Ownership
Investing directly in real estate can mean a broad range of potential return outcomes—and a range of risks.


Picking the right area to invest in real estate is hard enough. But add numerous unprecedented developments to the mix—a pandemic, high interest rates, and Americans fleeing to secondary cities at historical rates—and the risk of leveraging wealth to a mortgage in the wrong location feels especially greater than buying a share of a REIT investment.
Here, we take a closer look at geographic risk’s impact on direct real estate investments.
Why REITs Have Lower Risk Than Direct Real Estate
REIT management teams often invest in hundreds of properties across various sectors and markets, ensuring that investors take on lower geographical risks and higher diversification.
Additionally, REITs tend to come with fewer risks than rental properties because they:
- Develop their own properties.
- Are managed by real estate experts.
- Offer fewer options to choose from than investment properties.
- Can expand externally by raising capital through the public equity market.
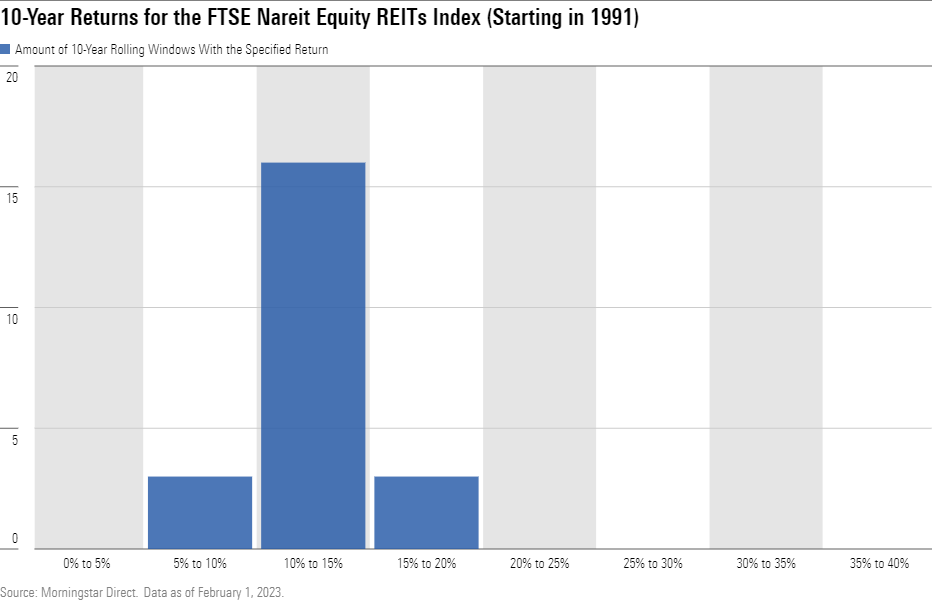
- Historically provide a tight range of returns.
The chart below highlights the consistency and predictability of the annualized return from investing in a REIT index for a decade, starting anytime between 1991 and 2012.
What Are the Risks of Investing in Real Estate Directly vs. REITs?
Buying and owning property is rarely easy, especially because it’s hard to predict if a neighborhood will start to trend downward, lowering the resale value and rental prices to attract long-term tenants.
For example, consider direct real estate investors who owned a rental property (leveraged at 20% equity) for at least 10 years, starting anytime between 1991 and 2012 in any of the 100 biggest metropolitan statistical areas, or MSAs. They would have experienced inconsistent and sporadic compound annual growth rates based on the investment time window and property location, as shown in the chart below.
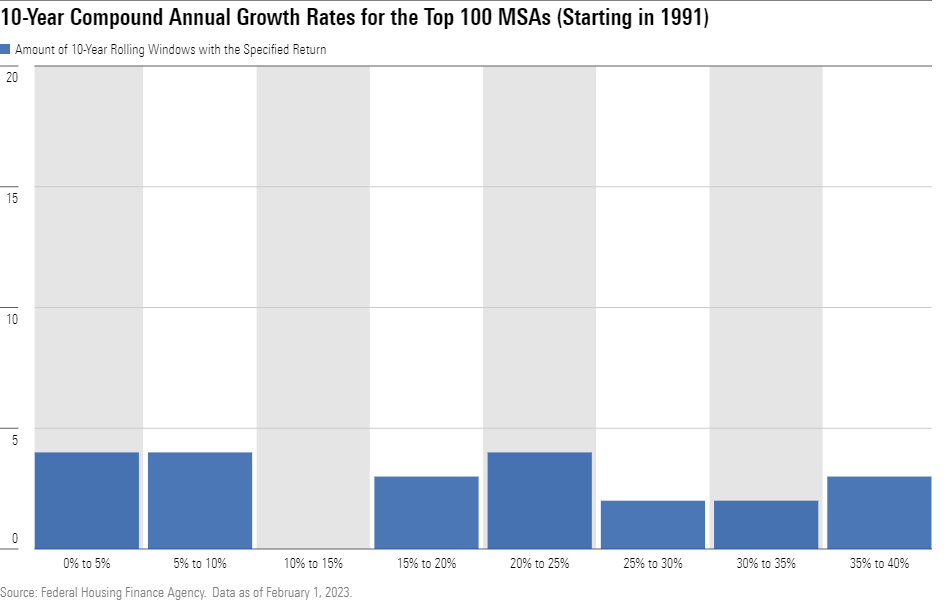
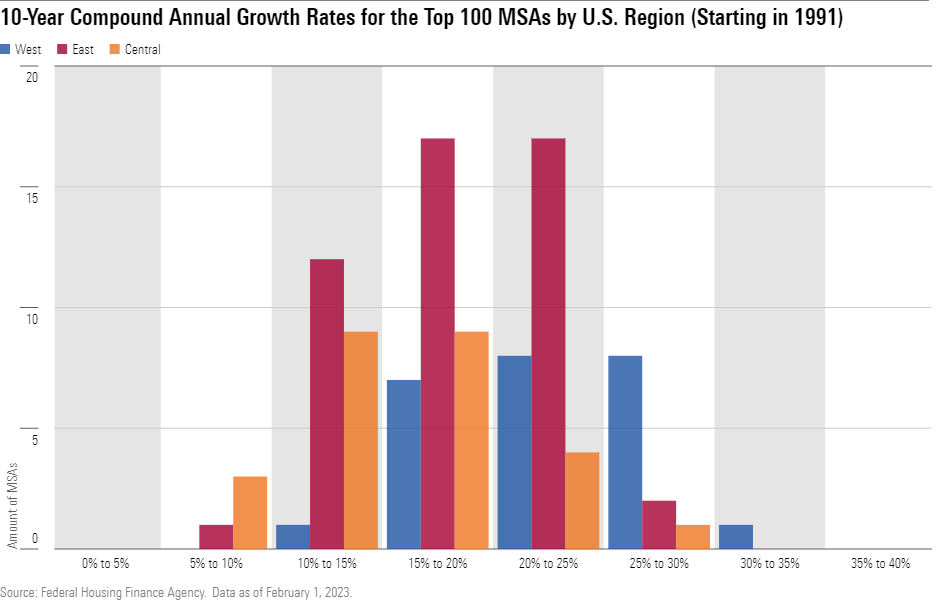
This inconsistency happens because investing in physical real estate can have significant geographical risks. For example, our analyses indicate that while property price returns often ranged between 15% and 25% across the Central, East, and West regions in the United States in the past 32 years, it was more likely to fall below that range when investing in the Central and East regions.
On the other hand, you were more likely to reach peak returns in the West, as early investors in West Coast cities saw their properties appreciate faster than homes in any other region. That said, you had to get into that market at the right time: Investors today are likely to pay a hefty price to enter the market and need to make a sizable down payment to see immediate positive cash flow on a rental property.
Meanwhile, despite more modest returns, the housing markets in the Central and East tend to be more affordable, allowing home prices to cool down slowly after a housing boom.
Even within the same market, the range of potential return outcomes can be broad and complex to navigate.
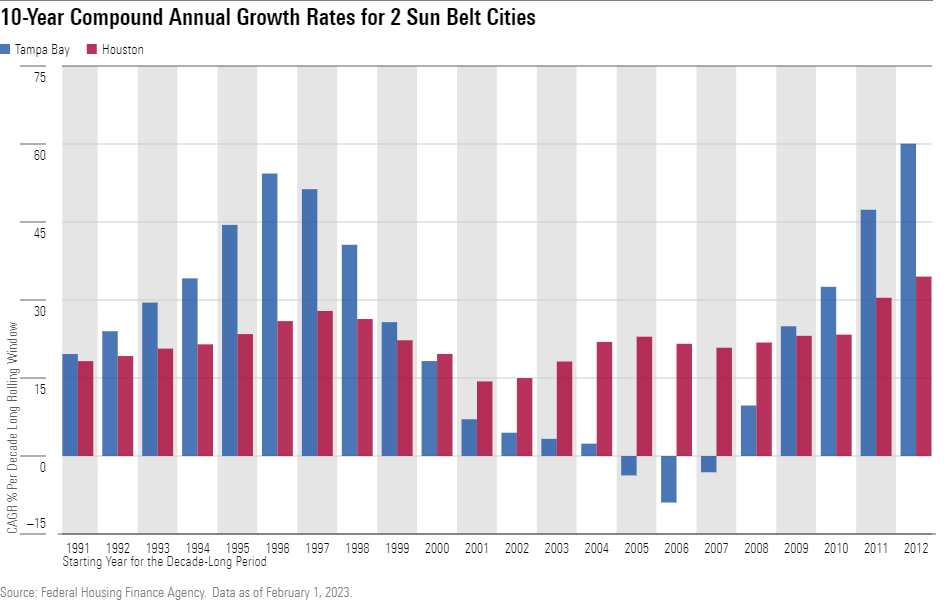
For example, take Tampa Bay and Houston—two comparable Sun Belt cities. Your real estate returns in these two cities would have varied substantially depending on the decade when you bought your property. If you made your investment 1) in the 1990s, you would have seen greater long-term returns in Tampa Bay; 2) between 2000 and 2008, you would have withstood the effects of the housing crisis better in Houston; or 3) after 2009, you would have seen positive growth for both cities, especially in Tampa Bay.
The highs and lows of Tampa Bay and the long run of mediocre returns from Houston may make it surprising that they currently are among the most thriving areas in the real estate game.
Early investors who capitalized on the low costs of real estate development in the South now enjoy the fastest-growing home sales prices. While it may make sense that cities with warm weather, affordable housing, and low tax rates are good areas to invest in, it’s harder to know when you should invest and how long you should hold.
The Complexities of Predicting Real Estate Winners
In hindsight, the benefits of investing in the Sun Belt cities after the housing crisis seem obvious. However, property markets quickly rise and fall, so picking the right time and location for an investment is easier said than done.
If you’re newer to real estate, reviewing historical trends can be a helpful guide. So, let’s turn back the clock about 20 years, to 2001. Despite being in the midst of an economic recession, there was unexpectedly high performance in the housing sector.
- There were new annual records for home sales and homeownership.
- Mortgage rates were at near all-time lows.
- Housing affordability was the most favorable in the past 28 years.
Real estate professionals around the country anticipated that the increase in home supply would make early 2002 a good time to buy, even if interest rates were slowly beginning to rise—defying an economy in recession.
Let’s say you had the ability to purchase a property in a large metro area at the beginning of 2002 for $500,000 and hold it for 20 years. Which area would you pick? Below you’ll find more information to help guide your decision.
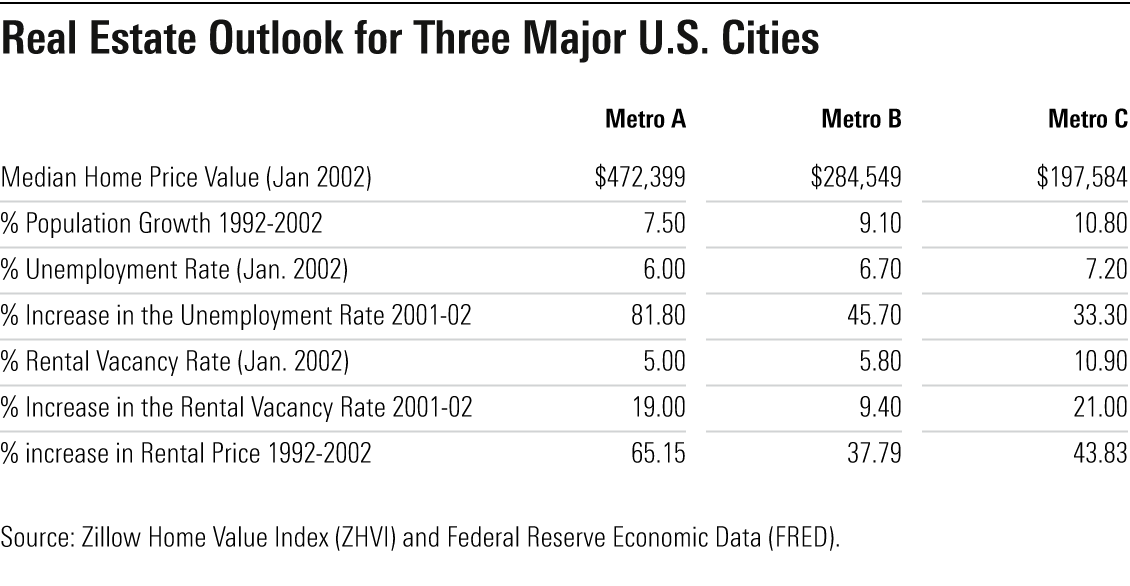
- Metro A faced a downward spiraling disaster after the dot-com bubble left many people unemployed and forced them to leave the area, causing vacancy rates to climb. While the market was considered a real estate gold mine in the late 1990s, its heavy dependence on the troubled technology sector led economists to anticipate a slow economic recovery and an uncertain future.
- Metro B faced a more mixed picture. In 2001 alone, more than 25 companies relocated out of the area, increasing unemployment rates and reducing the number of building permits. On the other hand, sales of existing single-family homes and sales prices were up from the previous year despite an economic slowdown.
- Metro C had another excellent year in residential construction and home sales as property prices remained relatively low compared with the national average. In addition, despite relatively high unemployment rates, there were plans for an automotive-supplier project that would introduce hundreds of manufacturing jobs to the area.
Still undecided on which metro area would have been the best long-term investment? You’re not alone.
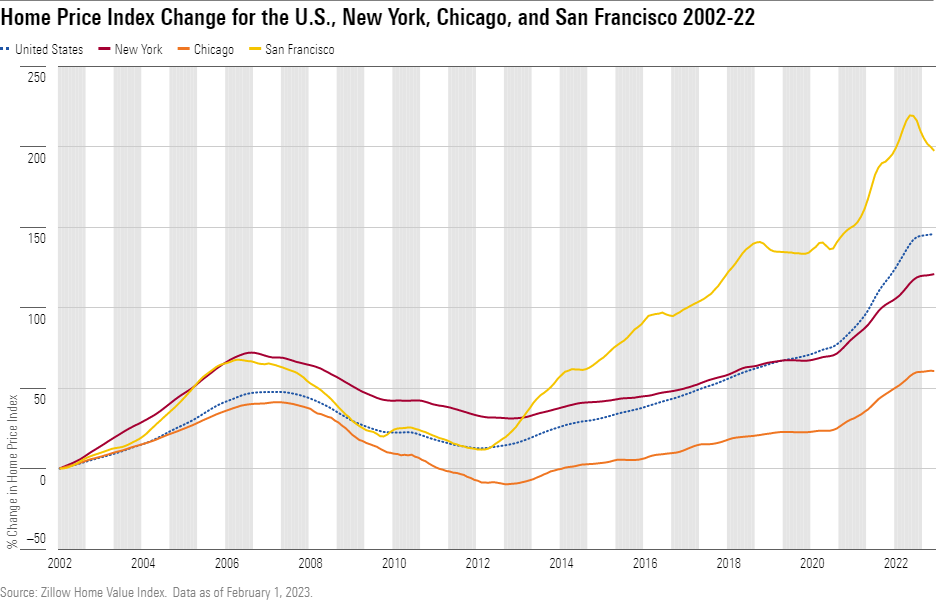
Real estate investing was much murkier in the early 2000s, as the current top housing markets weren’t necessarily the prime locations from 2002 to 2012. In fact, since 2002, more than 300 of the top 500 metro areas appreciated less than the U.S. average, including 28 of the largest 50.
Here’s how each of those investments would have fared:
- An investment in Metro C (Chicago) would have seen your capital appreciation grow at a lower rate than the national average. Yes, your property value would have increased to $800,000 by 2022, but that falls $400,000 short of the U.S. average due to a relatively low annual home growth rate after 2006. Since then, income and property taxes have gradually risen, and the lack of employment opportunities has caused residents to leave the city at unprecedented rates.
- An investment property in Metro B (New York) would have performed around the national average, with your home value rising to $1.1 million by 2022. New York City’s recovery after the 2008 housing crisis was particularly strong as people continued to flock to the area and residents were more likely than average to keep their jobs and avoid foreclosure. However, strengthened rent controls and low capitalization rates have made New York a complex property investment choice unless you are focusing on the luxury marketplace, which is still one of the most expensive housing markets in the world.
- Metro A (San Francisco) would have seen the best returns of these three options. Your investment property would have experienced an eye-popping 300% growth in its value, turning that $500,000 investment property into $1.5 million. In 2002, it would have been hard to believe that one of the best future housing markets would be led by the development of internet-related companies, considering that the industry had just lost more than 75% of its market value during the dot-com bust.
But then again, these strong returns highly depend on when you invested.
As many big technology companies weathered the storm in California, Silicon Valley became home to the hottest residential bidding wars, reaching a peak in 2012.
Strict zoning laws combined with the limited amount of land have made real estate scarce in San Francisco compared with other California areas. However, high property prices, strict rent-control regulations, and tenancy rights make it extremely difficult to be a successful new real estate investor in San Francisco unless you are willing to provide a significant down payment for immediate positive cash flow.
Picking Real Estate Winners Is Only Simple in Hindsight
While home appreciation can be compelling for rental properties, finding the location that will grow a property’s value the fastest with the greatest return can be highly speculative. The stakes are especially high for homeowners who borrow up to 80% of the home price value. On the other hand, REIT management teams strategically finance their investment properties with 30% to 40% leverage, allowing for higher liquidity during economic distress.
Even those who invest a significant amount of their wealth in a property are exposed to unprecedented outside risks. Each market is unique, regardless of the location you decide to invest in, and some secular dynamics are harder to identify than others. For example, the Chicagoland counties accounted for some of the largest numbers of homeowners with underwater mortgages, as lackluster job and pay growth pushed residents to move out of the area.
Unless you have a time machine, factors like these may be beyond your ability to forecast. That said, for those who get the timing right, the rewards can be great when investing directly in real estate.
The author or authors do not own shares in any securities mentioned in this article. Find out about Morningstar’s editorial policies.
/d10o6nnig0wrdw.cloudfront.net/04-25-2024/t_d30270f760794625a1e74b94c0d352af_name_file_960x540_1600_v4_.jpg)
/cloudfront-us-east-1.images.arcpublishing.com/morningstar/DOXM5RLEKJHX5B6OIEWSUMX6X4.png)
/cloudfront-us-east-1.images.arcpublishing.com/morningstar/ZKOY2ZAHLJVJJMCLXHIVFME56M.jpg)