A Brutal Year in the Markets Doesn’t Rattle ETF Investors
U.S. ETFs reel in $597.9 billion in 2022.

After years of torrid growth that featured only brief interruptions, markets crashed back down to earth in 2022. The Morningstar Global Markets Index, a broad gauge of global equities, declined 18.31% on the year after it slid 3.71% in December. That marked its worst calendar year since 2008. Meanwhile, the Morningstar US Core Bond Index closed the year 12.96% lower than where it started—the worst year on a track record that dates back to 2000. The index fell in nine of the 12 months on the year after declining 0.42% in December.
While the market’s woes caused myriad headaches—and prompted more outflows from mutual funds—they did not scare off exchange-traded fund investors. U.S. ETFs hauled in $597.9 billion in 2022, punctuated with $37.8 billion of inflows in December. The annual sum fell well short of the $901.7 billion that ETFs collected in 2021, but it ranked second all-time and illuminated ETF investors’ faith in the vehicle. Stock ETFs’ $365.8 billion inflow in 2022 led the way in absolute terms, but fixed-income funds posted the strongest organic growth. They reeled in $196.4 billion—or about one third of all 2022 inflows—despite constituting about one fifth of the ETF market.
Here, we’ll take a closer look at how the major asset classes performed in 2022, where investors put their money, and which corners of the market look rich and undervalued at month’s end—all through the lens of ETFs.
Reality Check
Exhibit 1 shows December returns for a sample of Morningstar analyst-rated ETFs that serve as proxies for major asset classes. In a fitting end to a dreadful year, the blended global portfolio shed 3.37% last month. The merits of diversification did not evaporate in 2022, but portfolios that spanned only stocks and bonds likely had a difficult run.
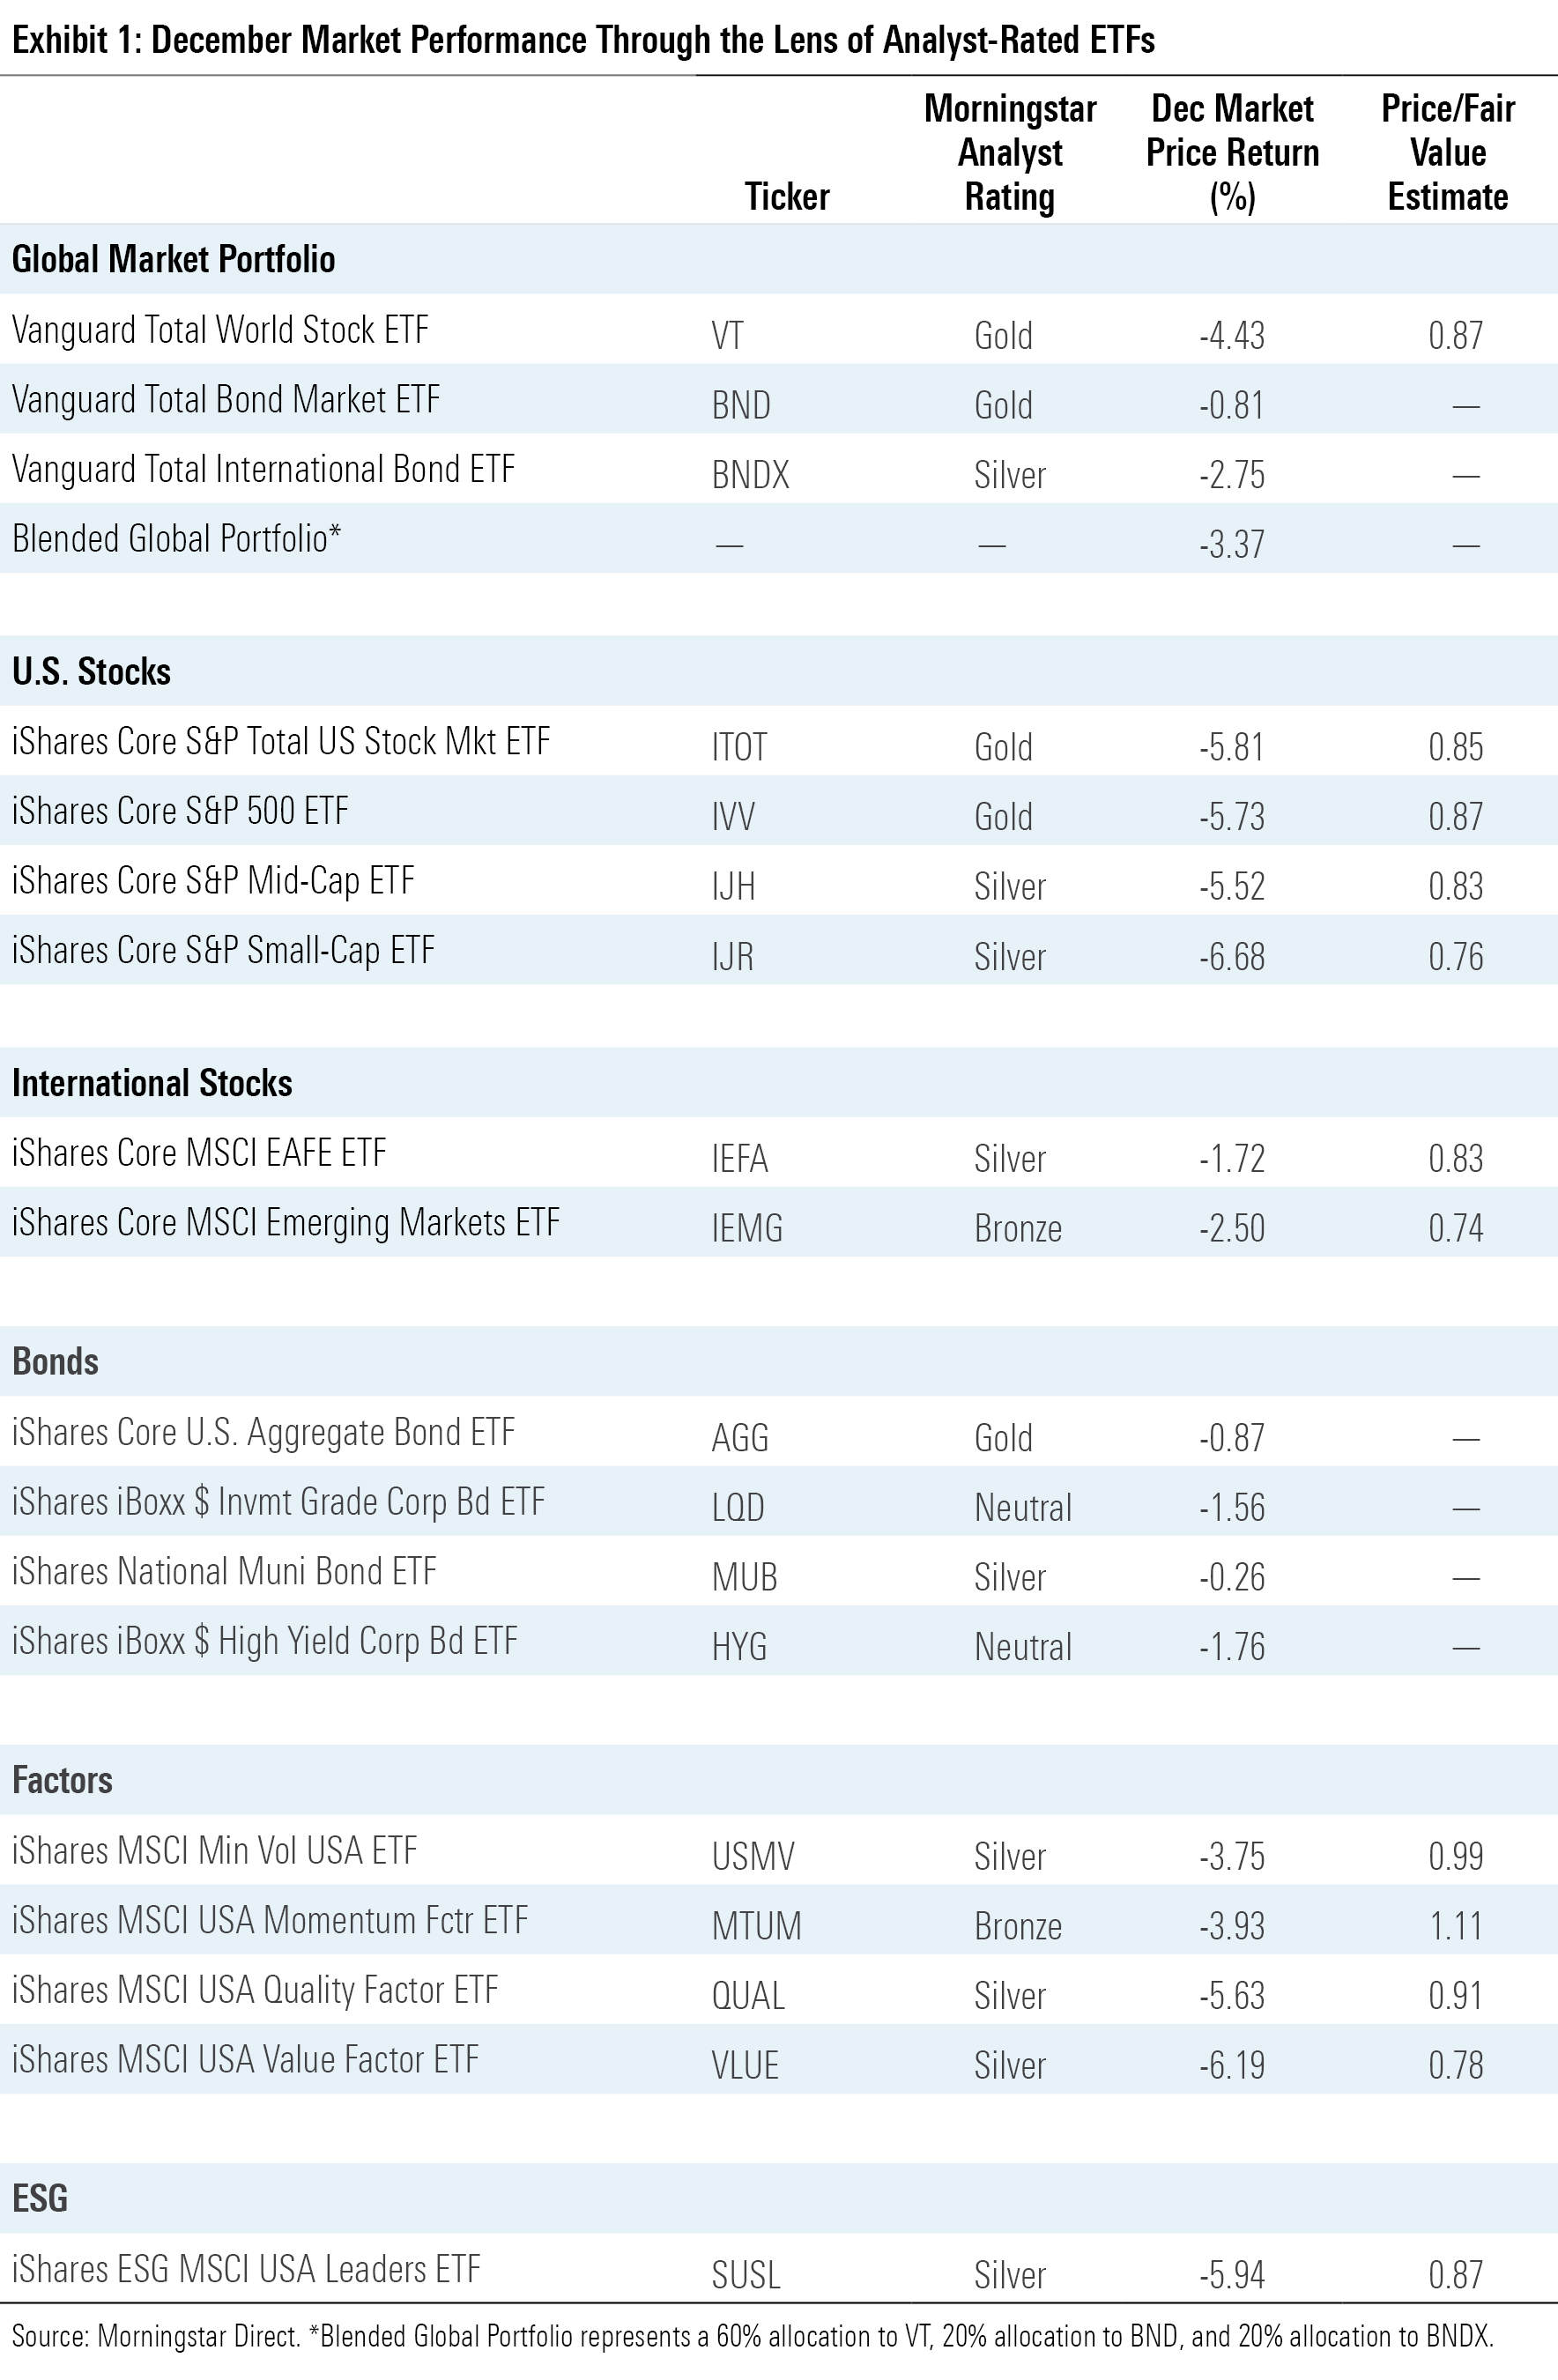
As the Morningstar 2022 Year in Review points out, one dominant force dictated the trajectory of markets last year: inflation. The Federal Reserve tried to wrestle it with seven interest-rate hikes that raised the federal-funds effective rate from a near-zero level to between 4.25% and 4.50% over the year. These increases left bonds with a black eye: Vanguard Total Bond Market ETF BND shed 13.11% in 2022, the worst year on an extended track record that dates to 1987. Vanguard Total International Bond ETF BNDX fared little better, sliding 12.76%. All told, 2022 was one of the worst years for fixed income ever.
Bond ETFs most sensitive to interest rates bore the brunt of the pain. Vanguard Long-Term Bond ETF BLV, which sported an average maturity of 23.6 years at the end of September 2022, lost 26.96% last year. Vanguard Short-Term Bond ETF BSV curbed its decline at 5.49%, as its average holding was set to mature in 2.9 years at the end of the third quarter. Bond funds that cast further down the yield curve fared much better in the low-interest-rate environment that characterized 2019 and 2020, but the stricter monetary policy of 2022 dimmed their track record.
Equities all over the world peeled back in 2022. Vanguard Total International Stock ETF VXUS shed 16.09%, though the fact that it held up better than broad domestic index funds may be some consolation. VXUS and other foreign-stock portfolios can trace some of their troubles to the strength of the U.S. dollar, as international gains were translated back into the base currency at unfavorable rates. To examine the impact of currency fluctuations in 2022, consider that iShares Currency Hedged MSCI ACWI ex US ETF HAWX outperformed iShares MSCI ACWI ex US ETF ACWX, which tracks an unhedged version of the same index, by about 7.5 percentage points last year.
Developed- and emerging-market stocks both finished the year well within the red, but developed markets offered a bit more stability. IShares Core MSCI EAFE ETF IEFA slid 15.21% on the year, while iShares Core MSCI Emerging Markets ETF IEMG tumbled 19.97%. The funds were neck and neck over the year’s first three quarters, but strong finishes from French, German, and U.K. stocks pushed IEFA ahead in the fourth. Chinese and South Korean equities finished the year well, too, but suffered from dreadful starts that prevented IEMG from coming out on top.
U.S. stock investors will be happy to put 2022 in the rearview mirror. Inflation—and the Fed’s interest-rate hikes in response—spelled trouble from start to finish. IShares Core S&P Total U.S. Stock Market ETF ITOT shed 19.47% on the year after it hit its all-time peak on Jan. 3, 2022. The fund looked to turn a corner late in the year, surging nearly 14% over October and November, but continued economic concerns saddled the fund with a 5.81% decline in December.
Performance was fairly consistent up and down the market-cap ladder in 2022. IShares Core S&P 500 ETF IVV finished the year 18.13% lower than where it started, while iShares Core S&P Small-Cap ETF IJR booked a 16.19% loss. While such a decline is hardly cause for celebration, 2022 marked the first calendar year that IJR outperformed its large-cap sibling since 2016. It was a resilient effort from this small-cap portfolio, whose companies were aided by their lower exposure to overseas operations. Small-cap stocks tend to be more sensitive to economic contractions, however, which will present challenges if the new year ushers in a recession.
While U.S. companies broadly slumped in 2022, energy stocks bucked the trend. Bolstered by an oil supply shock and the continued reopening of the global economy, Energy Select Sector SPDR ETF XLE shot up 64.17% on the year—nearly 63 percentage points ahead of the only other SPDR sector ETF to finish 2022 in the black, Utilities Select Sector SPDR ETF XLU. Meanwhile, many of 2022′s worst-performing sectors were those that led the way in the preceding years. Communication Services Select Sector SPDR ETF XLC dropped 37.63%. It entered the year with a 23% stake in Meta Platforms META, which lost nearly two thirds of its value on the year. Consumer Discretionary Select Sector SDPR ETF XLY suffered a 36.27% drawdown as it grappled with dreadful years from its two largest holdings, Amazon.com AMZN and Tesla TSLA.
The wide dispersion of sector performance helped Vanguard Value ETF VTV outperform Vanguard Growth ETF VUG by over 30 percentage points in 2022. The former slid only 2.07%, while the latter spiraled 33.15%. VTV’s loftier allocation to energy stocks certainly helped its cause, and more exposure to sturdier utilities, consumer staples, and healthcare stocks provided ballast, too. The more mature but slower-growing stocks favored by VTV tend to hold up better in rising-rate environments because their forecast cash flows come nearer in the future. Should the Fed reverse course and trim interest rates in the year ahead, VUG may quickly return to form.
ETF Investors Searched for Safety
Investors poured $597.9 billion into U.S. ETFs in 2022. That did not come close to the annual flows record set the year before, but ETF providers should consider it a successful commercial year for the industry considering the difficult market backdrop. Stock ETFs, which constitute about three fourths of the ETF market, led the way with $365.8 billion of inflows. But fixed-income ETFs posted stronger growth when accounting for assets under management, collecting $196.4 billion of their own in 2022.
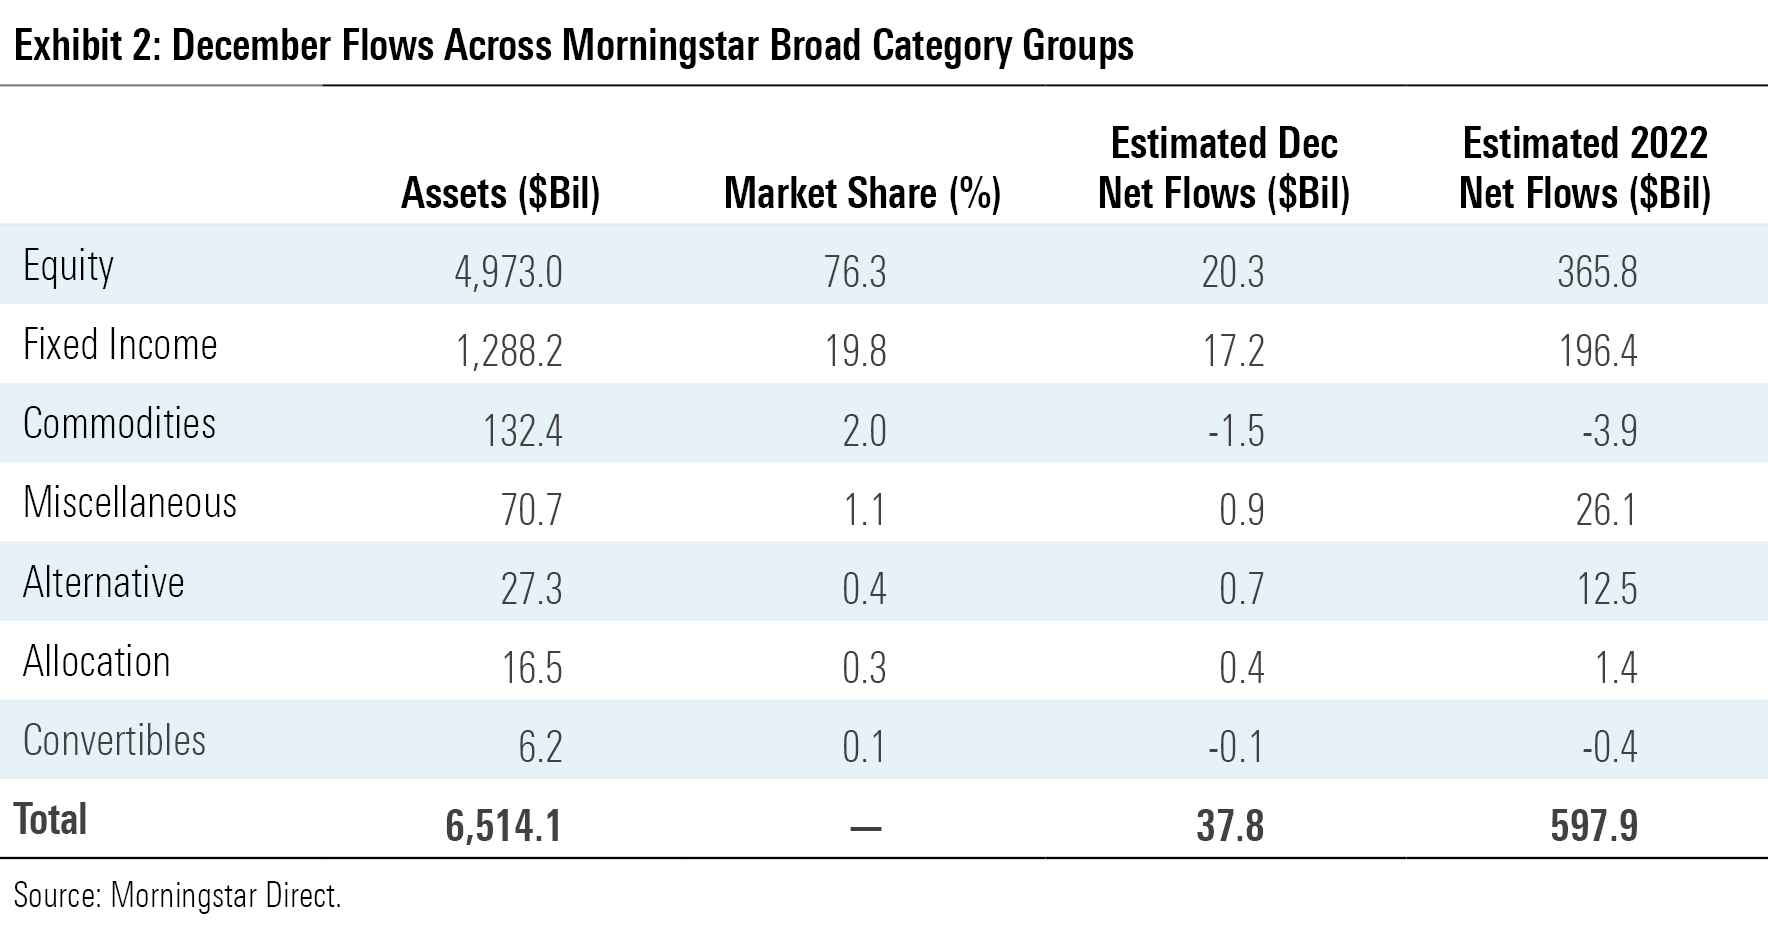
Flows within the fixed-income universe reflected investors’ desire for safety amid the turbulent markets that characterized 2022. Ultrashort bond funds—the closest alternatives to cash under the fixed-income umbrella—raked in $55.9 billion last year. SPDR Bloomberg 1-3 Month T-Bill ETF BIL and WisdomTree Floating Rate Treasury ETF USFR led the charge with over $11 billion of inflows apiece. Treasury funds, backed by the full faith and credit of the U.S. government, also spent the year in high demand. The long-government Morningstar Category reeled in $36.6 billion in 2022, which blew past its previous flows record by over $20 billion. Investors piled into these funds in the second half of 2022, likely aiming to “buy low” after their interest-rate sensitivity spelled trouble earlier in the year.
Inflation was the subject of many headlines in 2022, but ETF investors fled the funds constructed to combat it. Inflation-protected bond ETFs saw the steepest outflows of any fixed-income category, shedding nearly $11 billion in 2022. That came one year after these funds reeled in a record-setting $40 billion in a banner 2021. Similarly, bank-loan funds surrendered almost $4 billion after collecting a landmark $10 billion the year prior. Investors who positioned themselves for inflation showed they were ready to move on quickly once interest-rate increases commenced.
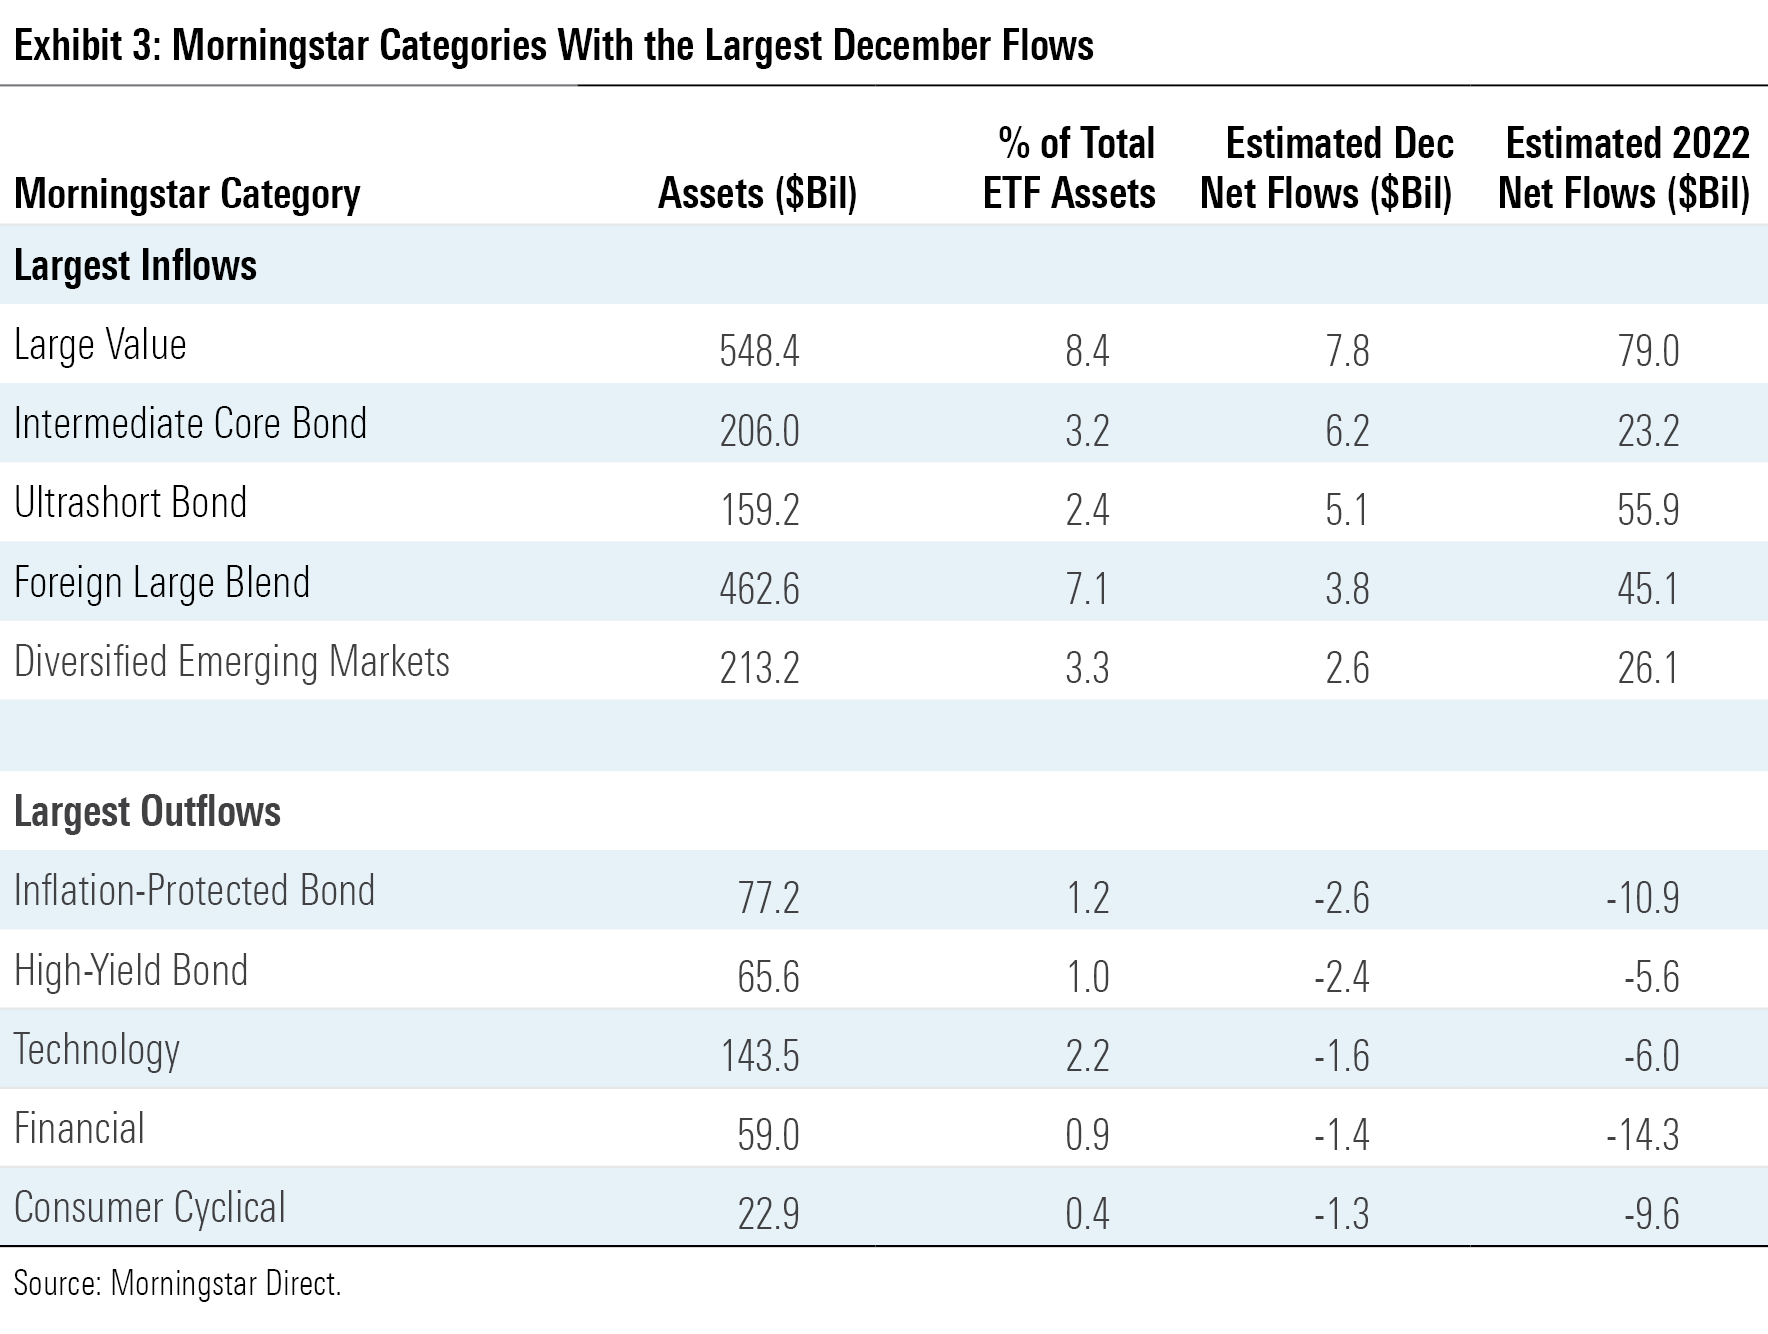
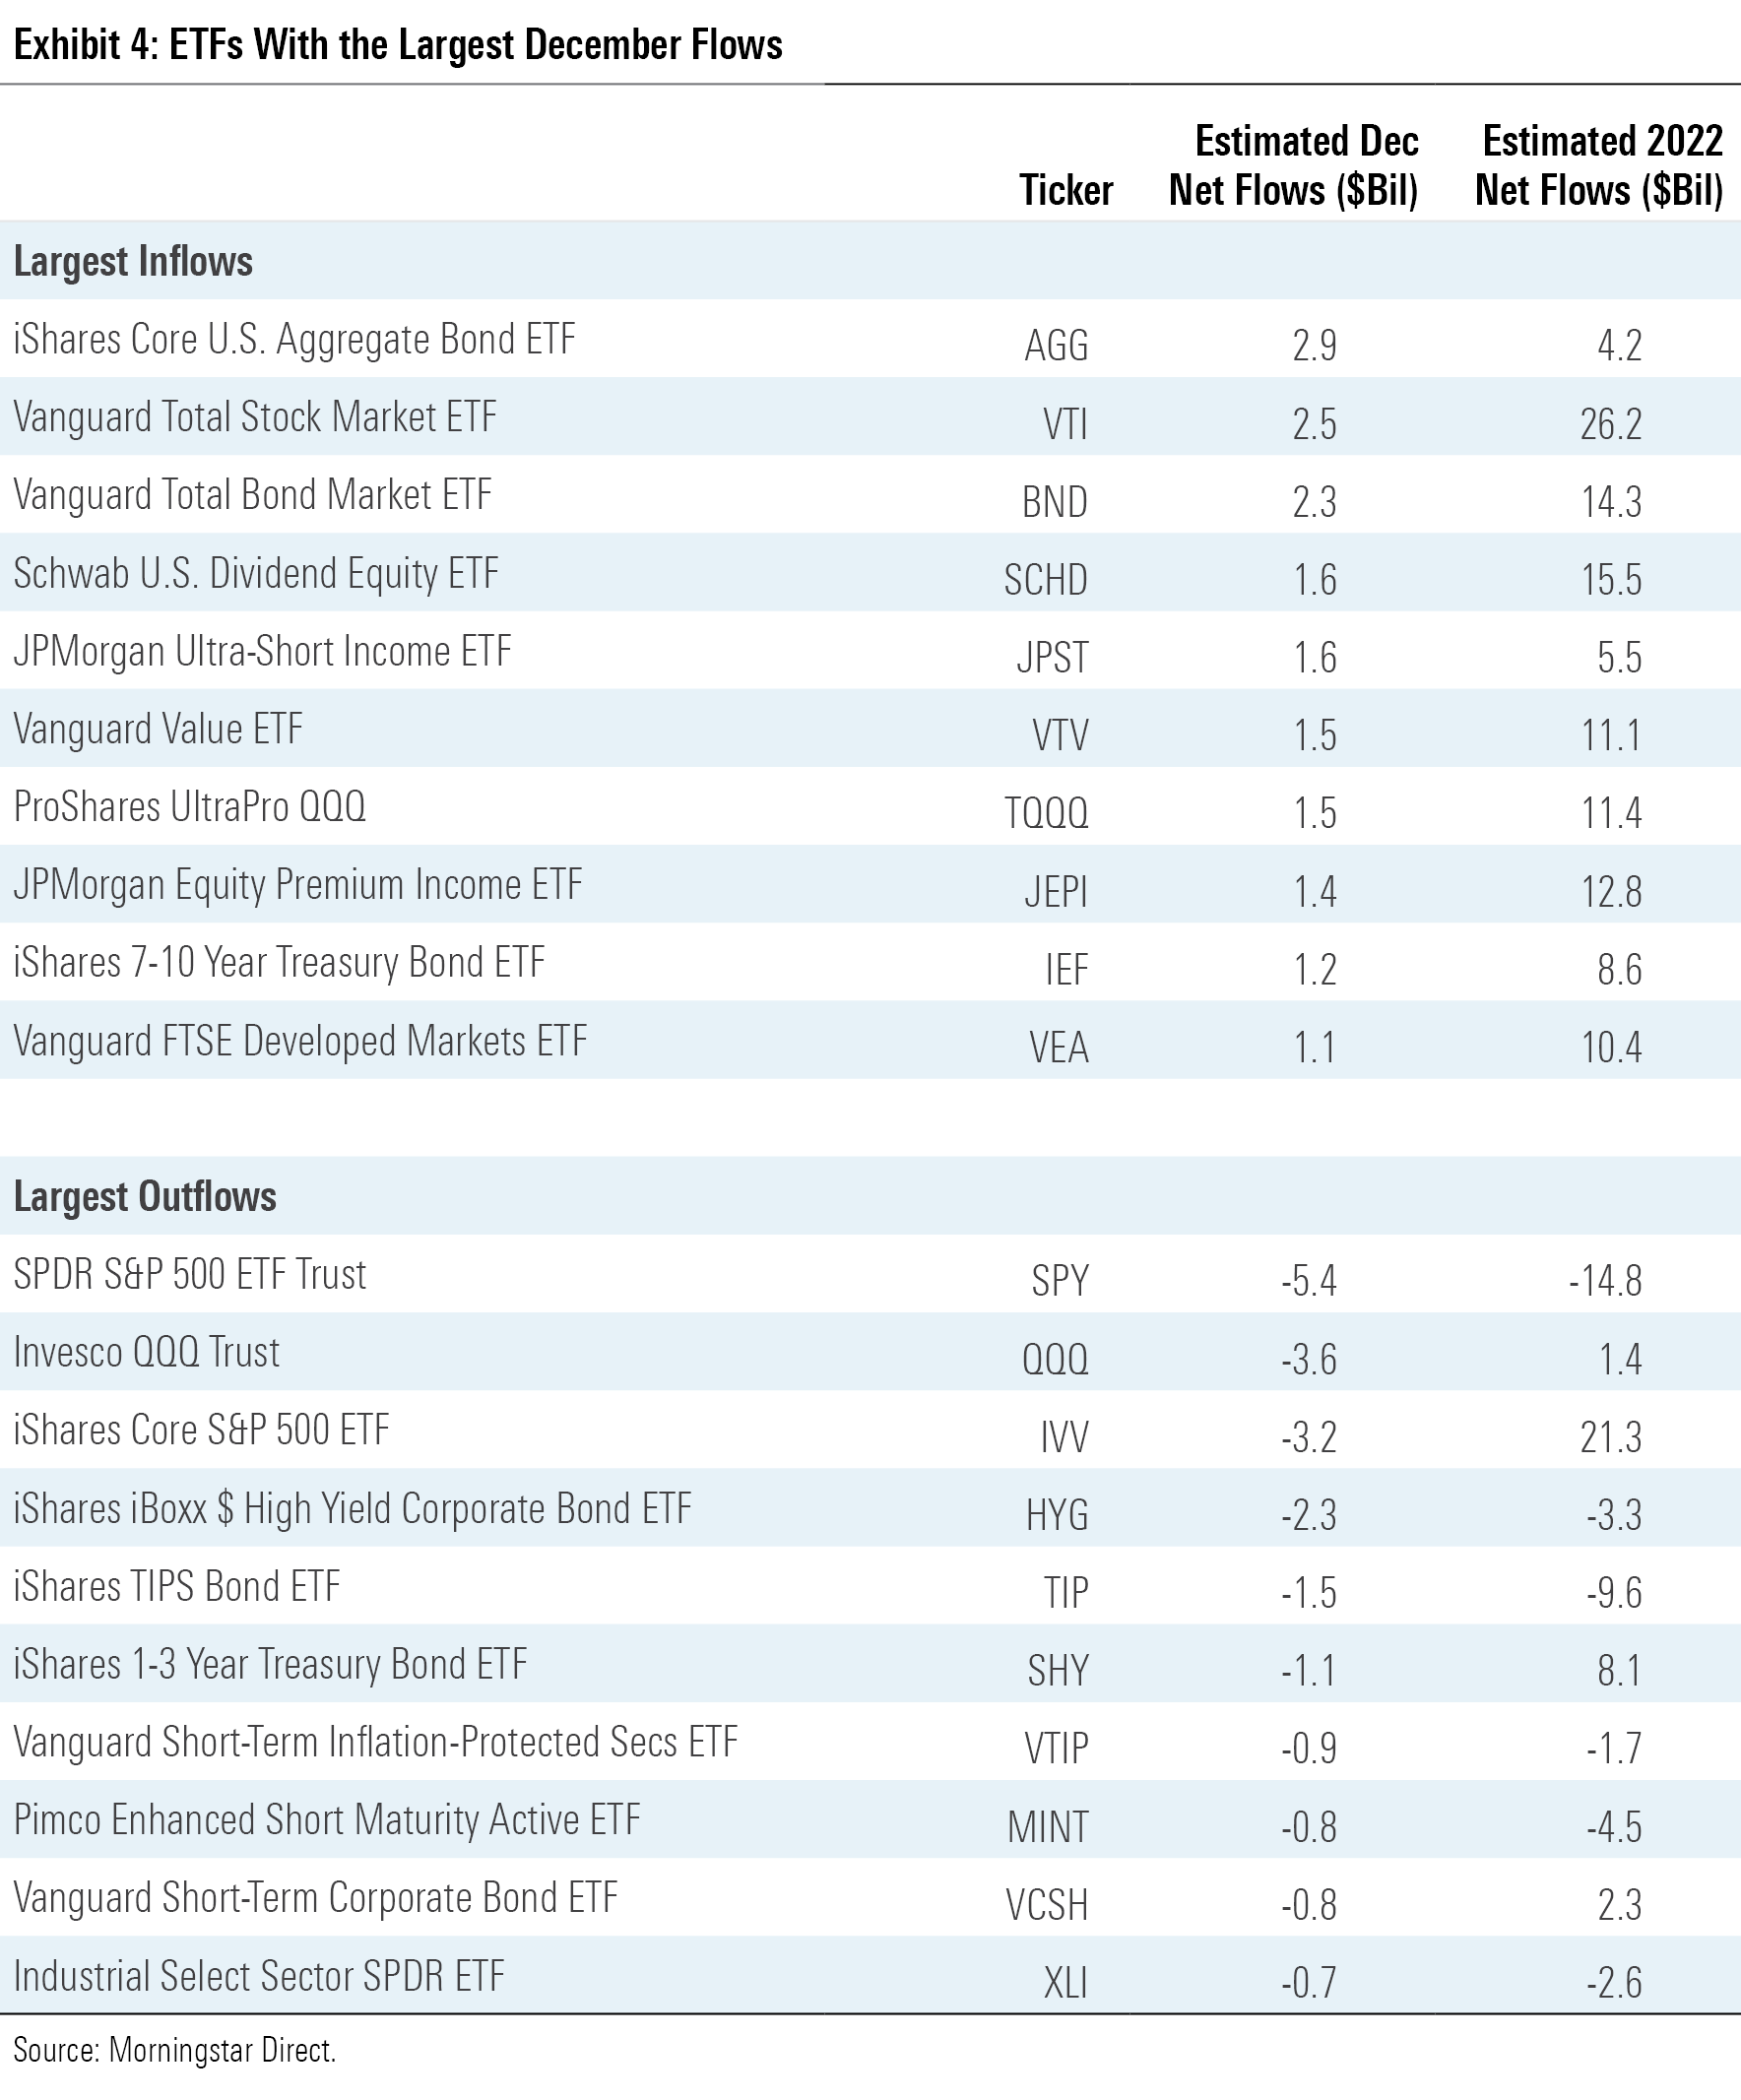
Plain-vanilla, broad-market index funds showed that their popularity is not just an artifact of bull markets. Large-blend funds led all Morningstar categories with $111.5 billion of inflows last year, as behemoths like Vanguard S&P 500 ETF VOO ($39.8 billion inflow), Vanguard Total Stock Market ETF VTI ($26.2 billion), and iShares Core S&P 500 ETF ($21.4 billion) continued their runaway commercial success. Perhaps not as performance-proof, however, was SPDR S&P 500 ETF Trust SPY. It shed $14.8 billion in 2022, which ranked last among all ETFs. Often used as a capital market instrument rather than a buy-and-hold investment, the market’s volatility wreaked havoc on the granddaddy of all ETFs.
Investors who prefer a value or growth bet with their stock ETFs gravitated toward the value side of the Morningstar Style Box. Large-value funds pulled in $79.0 billion in 2022, compared with $28.2 billion for their growth peers. This $50.8 billion difference marked the widest annual flows disparity between the two categories in Morningstar’s database, which dates back to 1993. Value stocks’ more resilient performance and advantage in rising-rate environments likely boosted value funds’ appeal.
The secret sauce to the large-value category’s flows success, however, was the breakout of dividend stock funds. Many of 2022′s most popular large-value funds were not intentional value strategies, but those whose dividend focus pushed them to the cheaper end of the style box. Dividend ETFs reeled in a total of $69.5 billion of new money in 2022—$51.6 billion of which funneled into the large-value category. Schwab U.S. Dividend Equity ETF SCHD set the pace with an inflow of $15.5 billion, followed by Vanguard High Dividend Yield ETF VYM ($8.9 billion) and iShares Core High Dividend ETF HDV ($5.5 billion). Dividend funds tend to attract investors in difficult markets because their dividend policies can reflect stability and operational efficiency. But in 2022, many riskier high-dividend strategies thrived because of their heavy allocations to booming energy stocks.
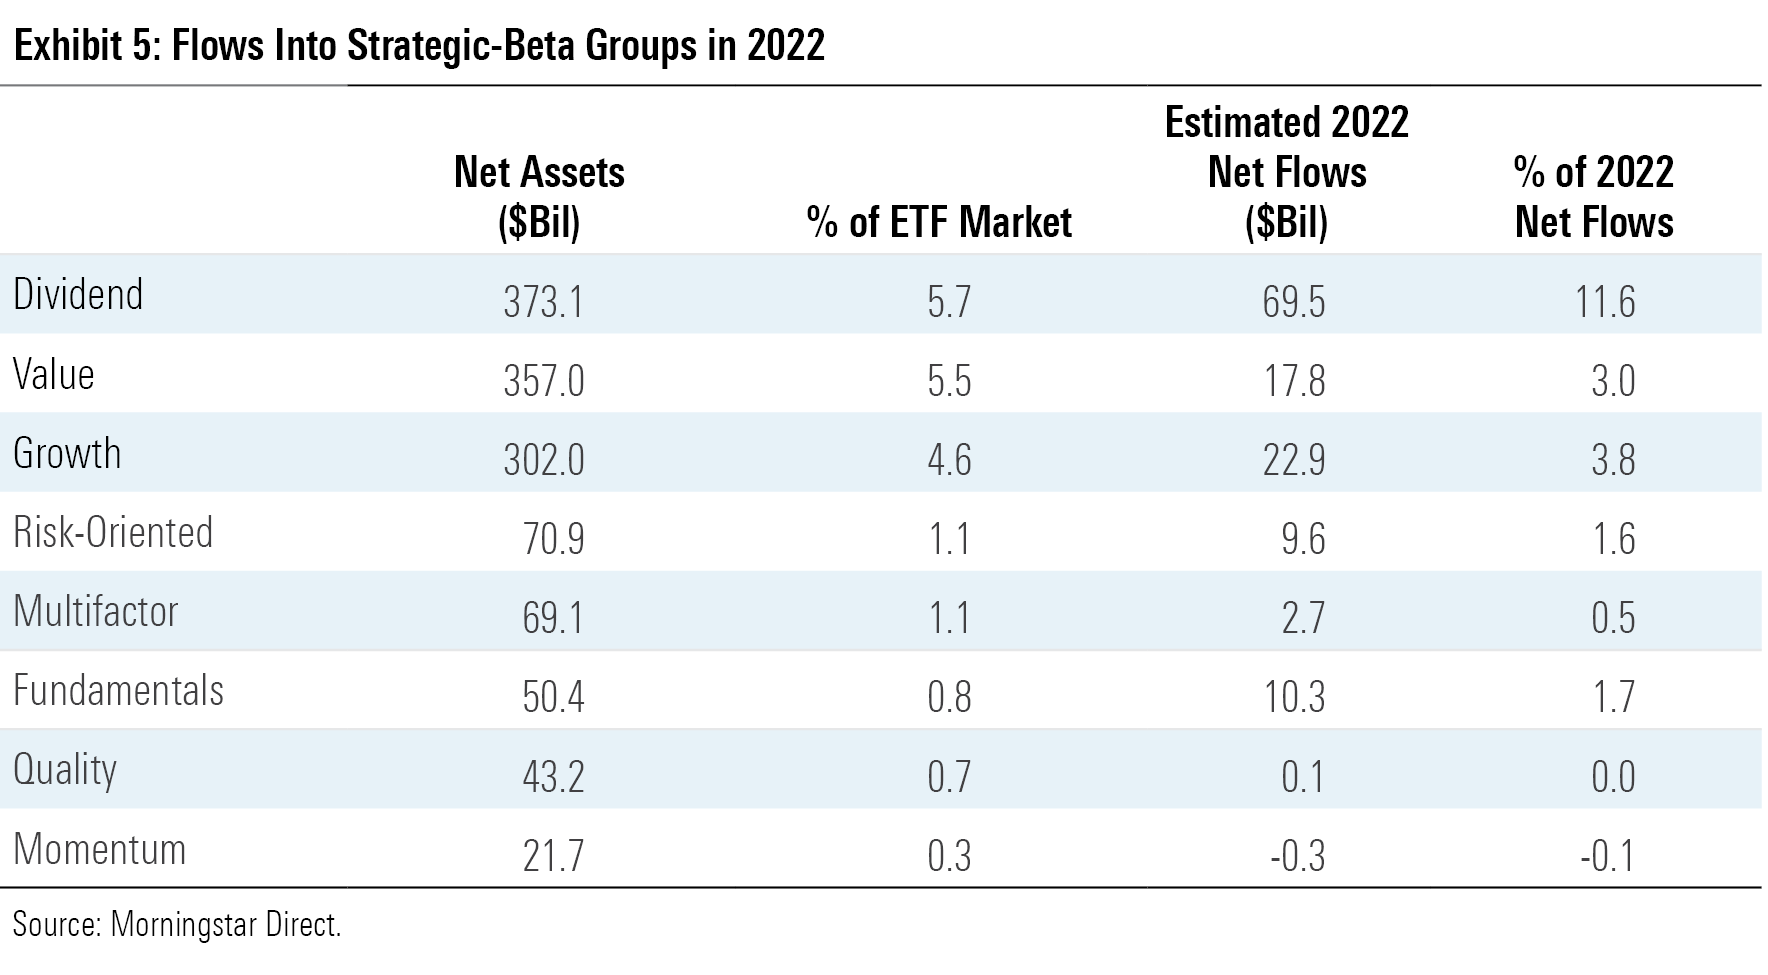
Sector ETFs shed $13.2 billion in 2022, one year removed from a record-setting $102.2 billion inflow in 2021. The turnaround was no fault of more-defensive sectors. Healthcare, consumer staples, and utilities funds collectively welcomed over $25 billion of new money as investors flocked to the market’s safest corners. Predictably, some of the more cyclical sectors were to blame. Financial, technology, and real estate sector ETFs bled a total of $25 billion after reeling in nearly $50 billion in 2021.
Active ETFs continued to build momentum in 2022. While their market share rested at only 5.3% at year’s end, active ETFs claimed 14.4% of ETF inflows in 2022. Systematic funds offered by the likes of Dimensional and Avantis helped power active ETFs’ stellar year. But if there existed an annual flows breakout ETF of the year, none would deserve it more than JPMorgan Equity Premium Income ETF JEPI. This active covered call strategy entered the year with $5.9 billion in assets and pulled in a whopping $12.8 billion over the subsequent 12 months. That made JEPI the runaway active ETF flows leader, but 33 others finished the year with over $1 billion of inflows.

Vanguard Three-Peats
At the end of 2019, Vanguard represented 25.8% of the U.S. ETF market, while iShares’ 38.7% market share gave them a commanding lead. After adding $192.7 billion in 2022—tops among all ETF providers for the third consecutive year—Vanguard’s market share rested at 29% to iShares’ 33.8%.
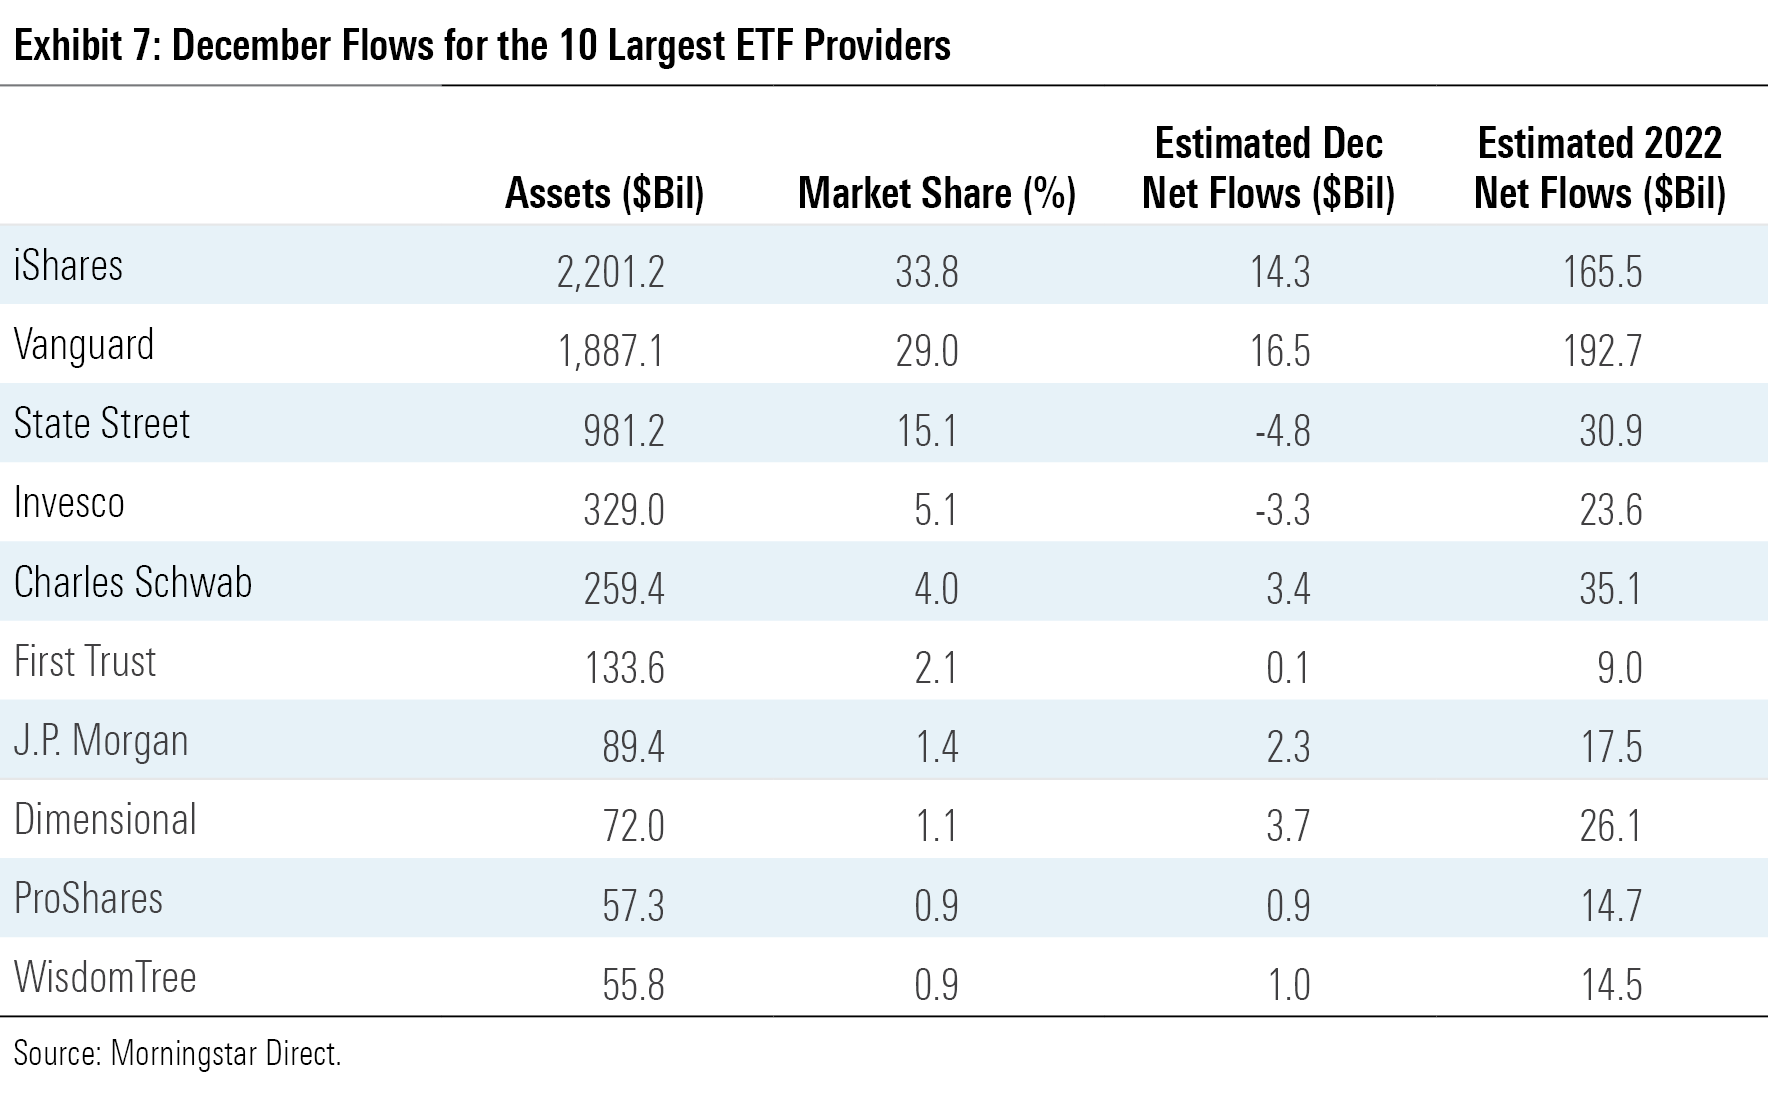
Vanguard secured its annual flows three-peat with sustained success from its plain-vanilla stock index funds. Its stock ETFs reeled in $143.5 billion in 2022—about twice as much as iShares’ equity lineup, which is about the same size. Stalwarts like VOO and VTI led the way, but stellar flows into VTV, Vanguard FTSE Developed Markets ETF VEA, and VUG—each of which absorbed between $9 and $12 billion in 2022—helped as well. Time will tell whether iShares can claw back the market share it ceded over the past three years. IShares will look to build on momentum from its fixed-income offerings, which collected over $100 billion last year, and its environmental, social, and governance funds, of which Vanguard offers far fewer.
Charles Schwab notched a strong 2022 flows campaign, collecting $35.1 billion of new money that exceeded heftier peers in State Street and Invesco. Schwab’s 29-ETF lineup is leaner than its larger competitors’, but it has found success by primarily sticking to sensible index strategies. SCHD was its crown jewel in 2022, but Schwab Intermediate-Term U.S. Treasury ETF SCHR and Schwab International Equity ETF SCHF provided a jolt as well, absorbing more than $4 billion apiece.
J.P. Morgan and Dimensional, the seventh- and eighth-largest ETF providers, respectively, enjoyed lucrative years on the backs of their active lineups. Headlined by JEPI, J.P. Morgan’s discretionary active ETFs collectively took in over $20 billion in 2022, while its index strategies saw modest outflows. Dimensional, which offers systematic active funds, saw even more success. It pulled in $26.1 billion last year, as none of its 30 ETFs endured outflows. Like Vanguard, Dimensional has benefited from an investor base that seems to appreciate the virtues of staying invested in a difficult market.
Value in Emerging Markets
The fair value estimate for ETFs rolls up our equity analysts’ fair value estimates for individual stocks and our quantitative fair value estimates for stocks not covered by Morningstar analysts into an aggregate fair value estimate for stock ETF portfolios. Dividing an ETF’s market price by this value yields its price/fair value ratio. This ratio can point to potential bargains and areas of the market where valuations are stretched.
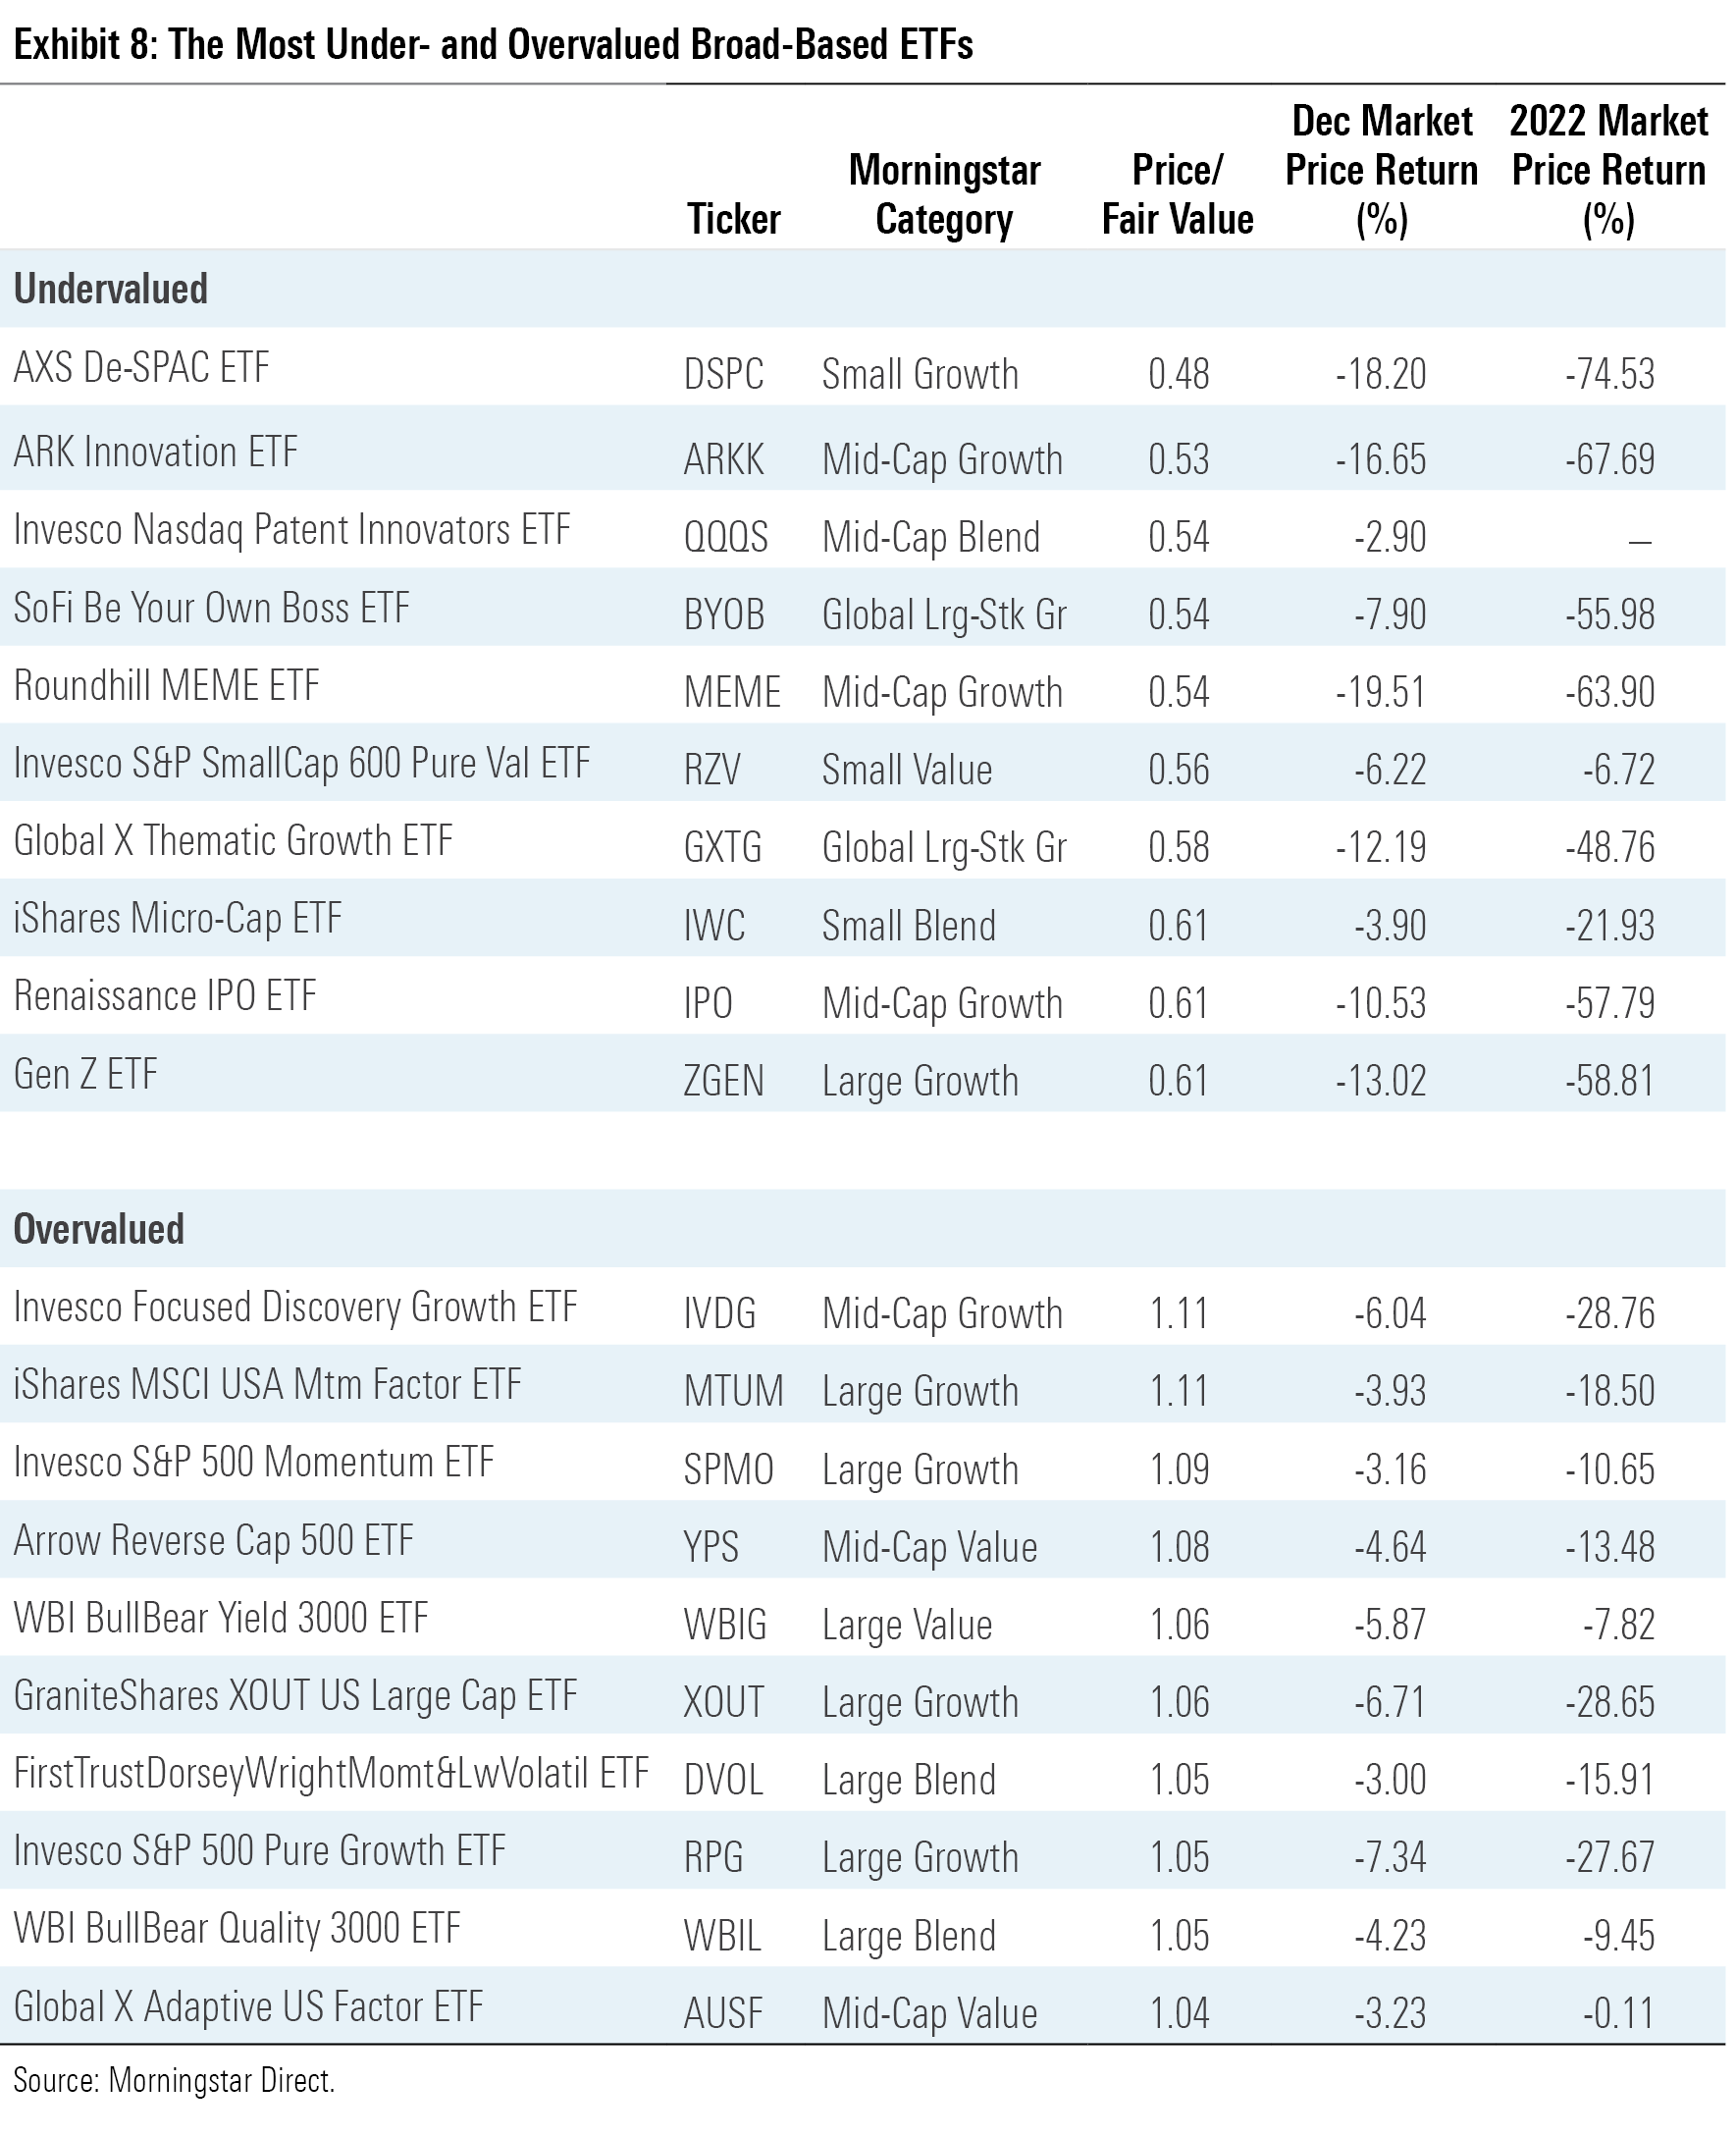
At the end of 2022, diversified emerging-markets ETFs looked cheap compared with their developed-markets and domestic peers. IEMG traded 26% below its fair value at year’s end—a more attractive discount than the 17% one offered by IEFA. Emerging-markets funds come with risks that help explain their steep discounts. For example, many of these funds incurred losses when their Russian holdings were marked to zero after Russia invaded Ukraine early in 2022. Still, emerging-markets funds showed some resilience in 2022 and have long runways for growth in the future.
For U.S. investors who prefer to stay closer to home, small-value funds looked cheap at the end of 2022 as well. IShares S&P Small-Cap 600 Value ETF IJS traded 30% below its fair value, while the broad U.S. market offered only a 10% discount. Dimensional US Small Cap Value ETF DFSV and Avantis U.S. Small Cap Value ETF AVUV, which sport Morningstar Analyst Ratings of Silver and Bronze, respectively, both offered 26% discounts to their fair value. These funds may face acute challenges if the economy tips into a recession, but their sensible approaches that prioritize profitability make them compelling long-term options.
The author or authors do not own shares in any securities mentioned in this article. Find out about Morningstar’s editorial policies.

/s3.amazonaws.com/arc-authors/morningstar/30e2fda6-bf21-4e54-9e50-831a2bcccd80.jpg)
/cloudfront-us-east-1.images.arcpublishing.com/morningstar/T2LGZCEHBZBJJPPKHO7Y4EEKSM.png)
/d10o6nnig0wrdw.cloudfront.net/04-18-2024/t_34ccafe52c7c46979f1073e515ef92d4_name_file_960x540_1600_v4_.jpg)
/d10o6nnig0wrdw.cloudfront.net/04-09-2024/t_e87d9a06e6904d6f97765a0784117913_name_file_960x540_1600_v4_.jpg)
:quality(80)/s3.amazonaws.com/arc-authors/morningstar/30e2fda6-bf21-4e54-9e50-831a2bcccd80.jpg)