
October Rally Ignites Optimism in the ETF Market
Investors poured $85.9 billion into ETFs as stocks launched a powerful rebound in October.
/s3.amazonaws.com/arc-authors/morningstar/30e2fda6-bf21-4e54-9e50-831a2bcccd80.jpg)

Global stocks soared in October, one month removed from a September slide that pushed many indexes deeper into a bear market. The Morningstar Global Markets Index, a broad gauge of global equities, advanced 6.02% in its fourth positive month this year. Bonds did not join the fun, however, as the Morningstar US Core Bond Index retreated 1.29%. With only two months left on the calendar, the broad fixed-income benchmark has plummeted 15.67% for the year to date, its worst year on record by a wide margin.
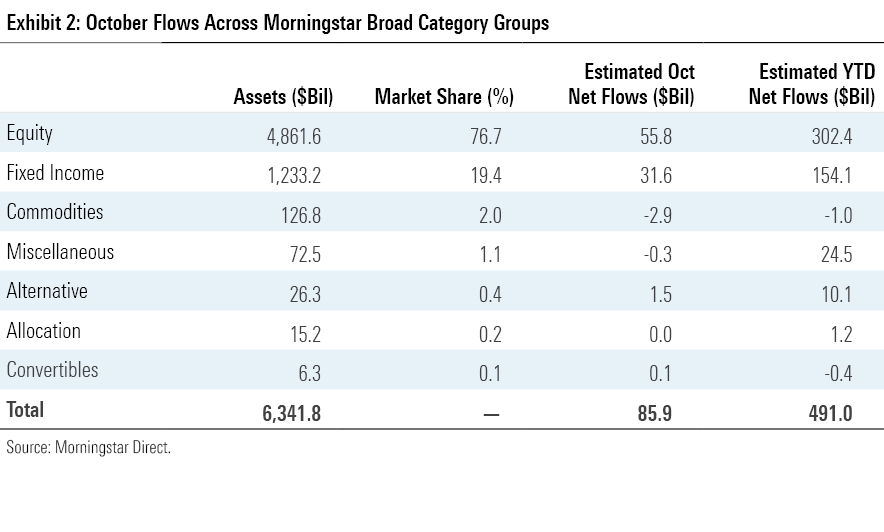
Still, a rebound in stocks gave investors a reprieve. U.S. exchange-traded funds racked up inflows totaling $85.9 billion in October, their best haul since March ($98 billion). Investors have now poured $491 billion into ETFs on the year. They are on pace to breeze past the half-trillion-dollar threshold and post their second-best year of flows ever, behind 2021′s $902 billion explosion.
Stock ETFs led the way in absolute flows last month, but bond ETFs posted the best organic growth rate, which scales for total assets. They collected $31.6 billion in October: 37% of total flows for the asset class that represents less than one fifth of the total ETF market by assets.
Here, we’ll take a closer look at how the major asset classes performed last month, where investors put their money, and which corners of the market look rich and undervalued at month’s end, all through the lens of ETFs.
Stocks Leave Bonds in the Dust
Exhibit 1 shows October returns for a sample of Morningstar Analyst-rated ETFs that serve as proxies for major asset classes. Investors in a blended global portfolio clawed back some of their September losses with a 3.71% gain last month.
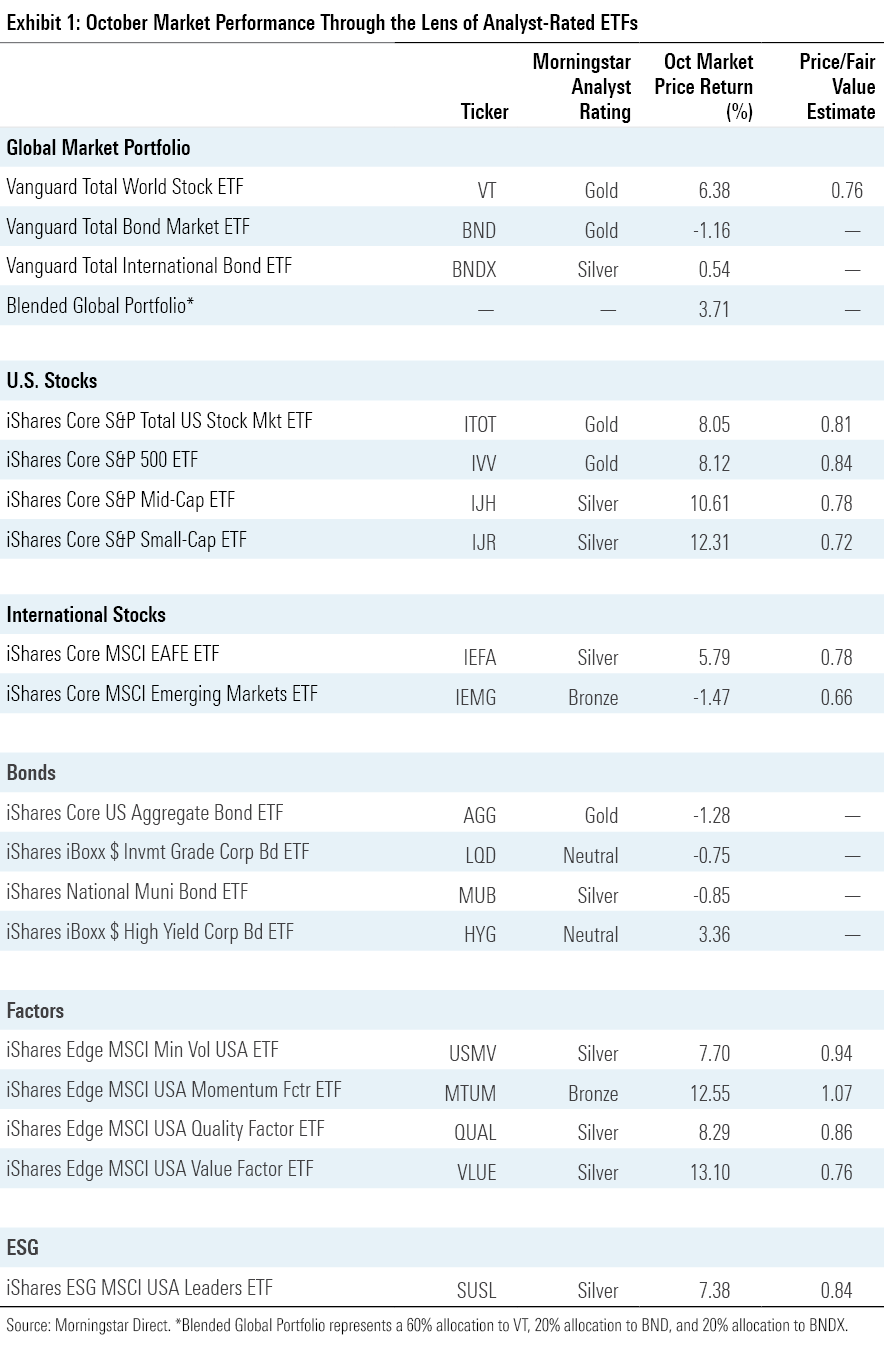
Stocks and bonds have moved in tandem for much of the year, but that trend fizzled when bonds continued their slide in October. Vanguard Total Bond Market ETF BND shed 1.16% of its value, while international cousin Vanguard Total International Bond ETF BNDX grinded 0.54% higher. Bond markets seem unconvinced that inflation is in the rearview, as rising yields last month continued to torch funds that shoulder interest-rate risk. While iShares Short Treasury Bond ETF SHV scratched out a small October gain, iShares 20+ Year Treasury Bond TLT slid nearly 6% and is now down 31.4% for the year. When will the tide turn for these longer-dated bond funds? Whether the Federal Reserve raises rates by 50 or 75 basis points in December—a decision very much in question—should help answer that question.
On the other hand, bond ETFs that focus on credit risk found a reprieve in October. These funds invest in lower-quality debt and tend to be more closely correlated with the stock market. IShares iBoxx $ High Yield Corporate Bond ETF’s HYG returns showed a 0.8 correlation with the S&P 500 over the past decade, compared with 0.24 for BND. That worked in HYG’s and its riskier peers’ favor last month, as the fund climbed 3.36%. High-yield bond funds are not a stabilizing force in the portfolio—HYG climbed or fell more than 3% in six of the past seven months—but they have mostly held up better than their government-backed counterparts in 2022.
An excellent month in the equity market made the bond sleeve’s subpar performance an afterthought in the blended portfolio. Vanguard Total World Stock ETF VT, the lone tenant of the stock sleeve, climbed 6.38% in October. Rising bond yields have hurt stock values this year because they increase their cost of capital, but loftier yields did not spill into stock valuations in October.
Vanguard Total International Stock ETF VXUS, a broad portfolio of international equities, added 3.41% in just its third positive month of 2022. Weak performance from Asian stocks weighed on returns. Chinese companies, which constituted about 9% of the portfolio entering October, continued their free-fall: The Morningstar China Index tumbled 16% last month and has shed 41.1% for the year to date through October. Investors rushed out of Chinese equities after President Xi Jinping was elected to his third term in October, a result that stands to strengthen the state’s grip on the economy and crystallize China’s zero-COVID policy (and the economic harm that comes with it). The Taiwanese market wobbled in October as well, partly because of shaky performance from the country’s large semiconductor firms.
Turbulence in the Far East caused even more acute pain for emerging-markets funds like iShares Core MSCI Emerging Markets ETF IEMG, the lone stock portfolio in Exhibit 1 to finish October in the red. Entering October, China and Taiwan represented 28% and 15% of the portfolio, respectively. Emerging-markets funds’ valuations can look very attractive—IEMG’s price/fair value ratio signals a 34% discount as of October—but they contain unique risks that investors must consider before signing on the dotted line.
IShares Core S&P Small-Cap ETF IJR outpaced iShares Core S&P 500 ETF IVV last month, notching a 12.31% gain to its larger sibling’s 8.12%. It’s normal for small-cap stocks to outperform in market rallies because they tend to be more economically sensitive than large caps. But they tend to fall further in market drawdowns, too, a trend that has broken of late. Since the start of 2022, IJR captured 115% of IVV’s upside and only 96% of its downside. Time will tell whether small caps continue to shoot forward with more speed than large caps despite not pulling back as far.
A sunny October market still cast shade on a few of IVV’s marquee names. Subpar earnings drove monthly losses for mainstays like Microsoft MSFT (0.33% loss), Alphabet GOOG (1.19% loss), and Amazon.com AMZN (9.35% loss). But no stock was hit harder than Meta Platforms META, which sank 31.4% last month after doubling down on its metaverse strategy and projecting significant operating expense growth in 2023. Meta, which entered the year as the S&P 500′s fourth-largest constituent and concluded October as its 16th, has lost 72.3% of its value so far this year.
Most of October’s losers fall on the growth end of the style spectrum, which helped Vanguard Value ETF VTV outperform counterpart Vanguard Growth ETF VUG by 7.62 percentage points in October. Cheaper sectors thrived last month, giving VTV a distinct advantage. While Communications Services Select Sector ETF XLC—home to Meta and other faster-growing names—squeaked out just a 0.67% October return, Financial Select Sector SPDR ETF XLF, Industrial Select Sector SPDR ETF XLI, and Energy Select Sector SPDR ETF XLE gained 11.92%, 13.89%, and 24.97%. October was the perfect storm for energy stocks. OPEC+ slashed production at the start of the month to tip the supply/demand balance in its favor, then firms like ExxonMobil XOM reported banner profits (though that drew the ire of the White House). So far this year, XLE has shot up 67.2%, more than over 70 percentage points better than its next-closest sector ETF competitor.
Investors Seek Extra Credit
Investors sank $82 billion into U.S. ETFs in October, the most since March. Stock ETFs led the way with $56 billion of inflows. But bond ETFs notched a stellar month of their own, as the $29 billion they reeled in translated into even stronger organic growth, which scales for total assets under management. After outflows in January, fixed-income ETFs have rattled off nine consecutive months of inflows, from as little as $3 billion to about 10 times that sum.
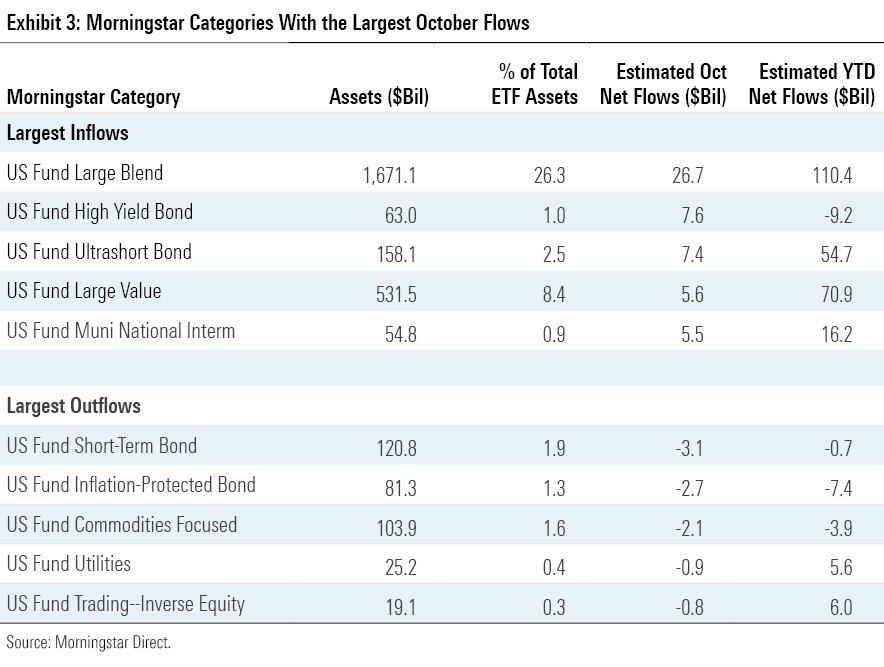
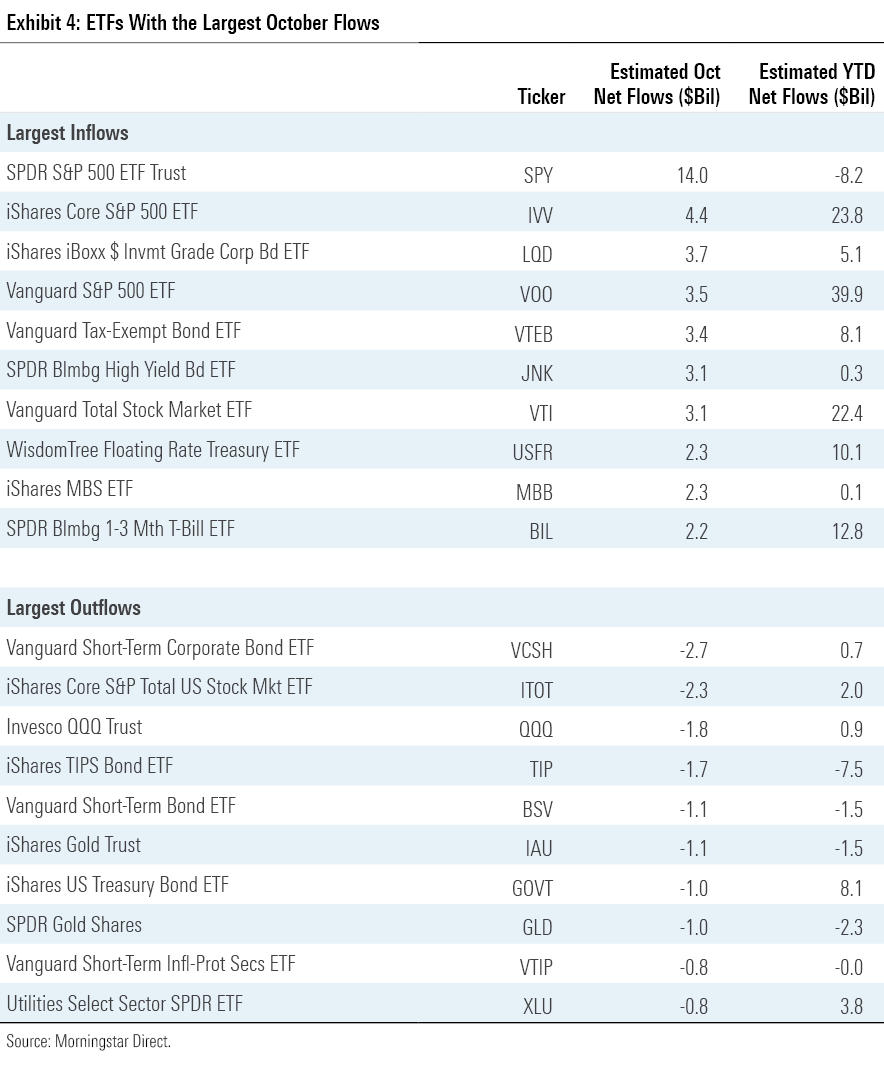
Much of the investment in the stock ETF universe went into the U.S. large-blend Morningstar Category, its largest cohort. A revitalized market renewed investor enthusiasm for broad-based, low-cost index funds. SPDR S&P 500 ETF Trust SPY paced all ETFs with $14 billion of inflows—more than triple its next-closest competitor—and fellow S&P 500 trackers IVV and Vanguard S&P 500 ETF VOO each scored top-five October inflows. Investors that preferred to bet on style favored value to growth last month, continuing a 2022 trend. Large-value funds have absorbed $70.9 billion this year, about 4 times that of the large-growth category.
After a quiet two months, demand for international equities came to life in October. These funds raked in $9.4 billion last month, their strongest one-month inflow since exploding for $23.7 billion in January. Foreign large-blend funds, which represent about half of all international-stock assets, pulled in $5.1 billion. Investors opted for cheap, broadly diversified funds overseas too: SPDR Portfolio Developed World ex U.S. ETF SPDW and Vanguard FTSE Developed Markets ETF VEA added almost $1 billion apiece. The strengthening U.S. dollar has left these funds well behind their currency-hedged peers this year, but investors have been slow to adopt international funds constructed to sidestep exchange-rate risk. Currency-hedged stock funds have added a modest $5.7 billion for the year to date.
Sector ETFs shed $10.4 billion in September, their worst month on record, but rebounded nicely with $3.8 billion of inflows in October. Flows within this space painted a picture of optimism. ETFs that track the cyclical energy, financials, and technology sectors each pulled in about $1 billion last month. Meanwhile, utilities sector ETFs saw modest outflows for the first time this year. Investors that pick their spots in the market treated the October rally as a bellwether, not a blip on the radar.
In another sign of investor optimism, flows into riskier bond categories spiked in October. High-yield bond funds, which suffered nearly $17 billion of outflows over the first three quarters, welcomed $7.6 billion in their best month since July 2020. SPDR Bloomberg High Yield Bond ETF JNK paved the way with inflows of $3.2 billion in October, with iShares 0-5 Year High Yield Corporate Bond ETF’s SHYG $2.1 billion haul not far behind. The corporate bond category collected $3.8 billion in October, pushing the group more firmly into inflow territory on the year.
That is not to say bond ETF investors threw all caution to the wind. All three government bond categories (short-, intermediate-, and long-term) pulled in between $2 billion and $3.5 billion in October. It has been an excellent year for the Treasury trio, which has collectively hauled in $68 billion of new money since the start of 2022. Investors also poured $7.4 billion into ultrashort bond funds in October, second most among all categories. Widespread risk-aversion has made it a banner year for these funds, which tend to perform like cash. They have now absorbed $54.7 billion for the year to date, eclipsing their previous record $49.2 billion annual inflow from 2018.
Funds that can offer protection from inflation saw more money rush out their doors in October. Inflation-protected bond funds in particular have felt the bottom fall out beneath them. One year removed from a record-setting $40 billion inflow in 2021, these funds have endured more than $7 billion of outflows so far this year. Some investors believe inflation has already peaked, driving them out of funds designed to weather it. Plus, investors that filed into inflation-protected bond funds last year likely felt some buyer’s remorse in 2022. Another popular inflation antidote, commodities funds, have seen a stark turnaround in flows as well. October marked their sixth consecutive month of outflows, pushing them into 2022 outflows after they absorbed $21.2 billion over the first four months of the year.
The State of State Street (Part II)
State Street reminded the ETF industry who rounds out its “Big Three,” as it led all fund families with $29.3 billion of inflows in October. It’s been an up-and-down year for State Street, which has seen five months of inflows and five months of outflows in 2022. Sporadic flows into and out of SPY explain much of the oscillation, as the storied fund represents about 38% of State Street’s ETF AUM. Its lucrative month helped earn State Street the October crown, as did investors’ renewed appetite for sector ETFs: State Street’s suite of sector funds account for about 27% of its AUM and collectively hauled in $3.9 billion in October.
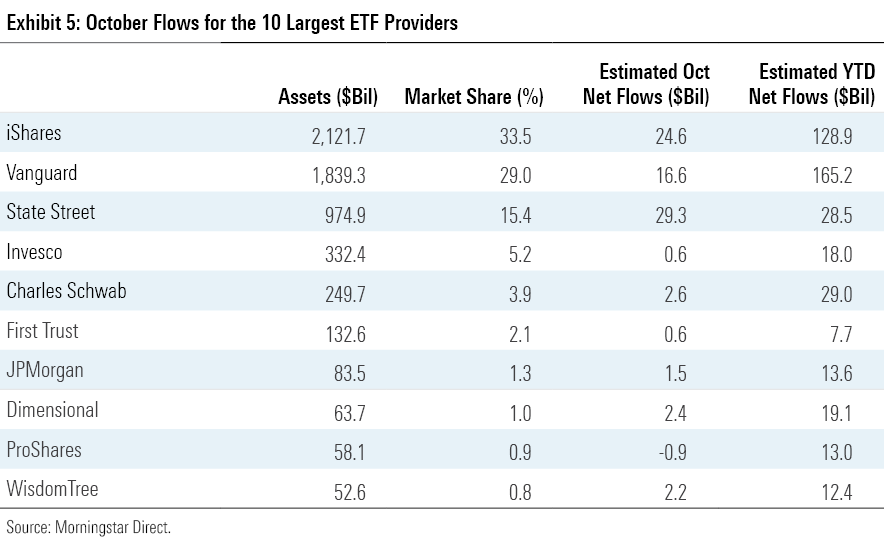
WisdomTree added $2.2 billion of new money in October, pushing its year-to-date total to $12.4 billion and keeping it on pace for its best year of inflows since 2015. The firm’s stellar year echoes its earliest days as an ETF provider. WisdomTree’s first ETFs saw early commercial success because their fundamental focus and value bias were a welcome alternative to the frothier market-cap-weighted index funds that had plummeted when the tech bubble burst a couple years prior. Now, WisdomTree has seen an uptick in flows after the market’s fastest-growing stocks again fell out of favor more than 15 years later. But this time around, their fixed-income funds have carried the load. WisdomTree Floating Rate Treasury ETF USFR has led the way, raking in $10.1 billion this year after adding $2.3 billion in October.
Cannabis and China Look Cheap
The fair value estimate for ETFs rolls up our equity analysts’ fair value estimates for individual stocks and our quantitative fair value estimates for stocks not covered by Morningstar analysts into an aggregate fair value estimate for stock ETF portfolios. Dividing an ETF’s market price by this value yields its price/fair value ratio. This ratio can point to potential bargains and areas of the market where valuations are stretched.
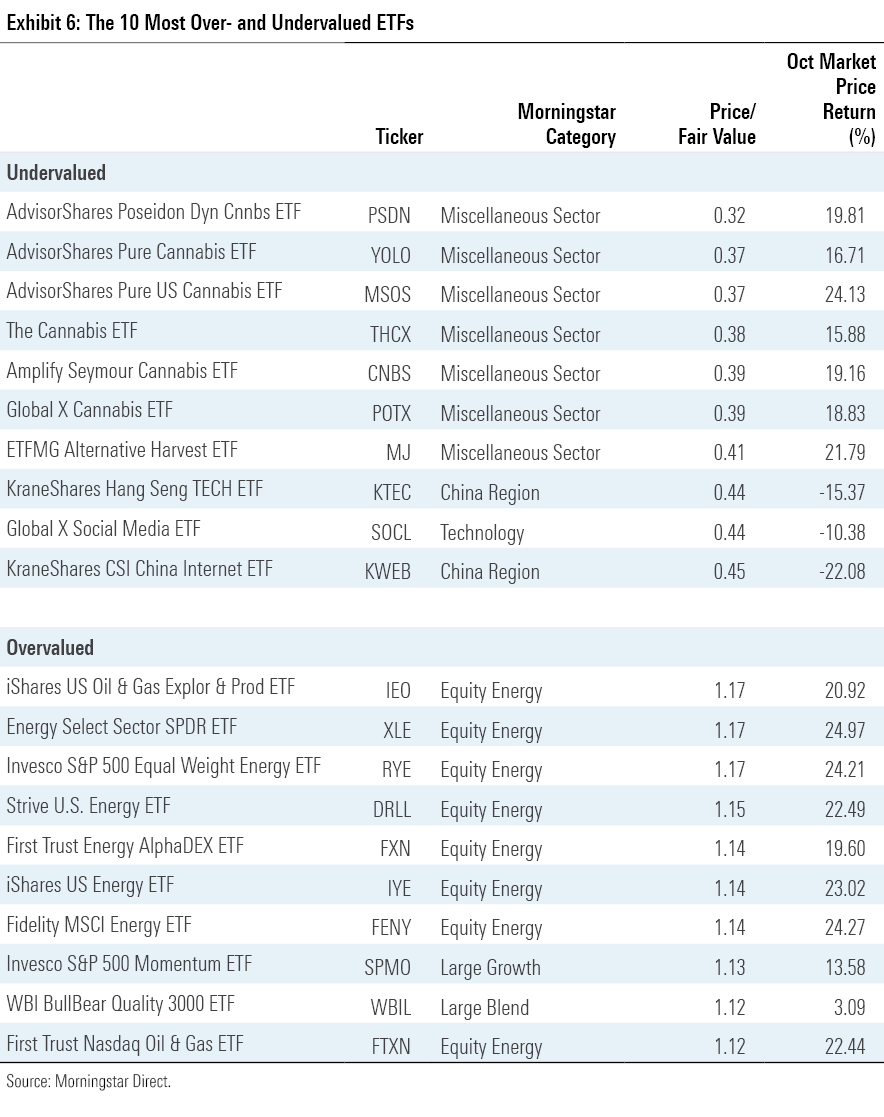
Once again, funds that aim to leverage the legalization of cannabis held down the cheaper half of Exhibit 6, claiming the top seven cheapest spots. It has been a painful year for these funds, but October brought optimism for perhaps the first time this year. President Biden announced that he would pardon thousands convicted on federal charges of marijuana offenses, and Senate Majority Leader Chuck Schumer indicated a bill that would open U.S. banks to Canadian cannabis companies was close. Jointly, these Washington announcements powered each cannabis fund on the list to at least a 15% return in October. The fact they remain so undervalued shows how far they had fallen: Even after their recent rebound, the seven cannabis ETFs in Exhibit 6 shed between 48% and 68% of their value on the year.
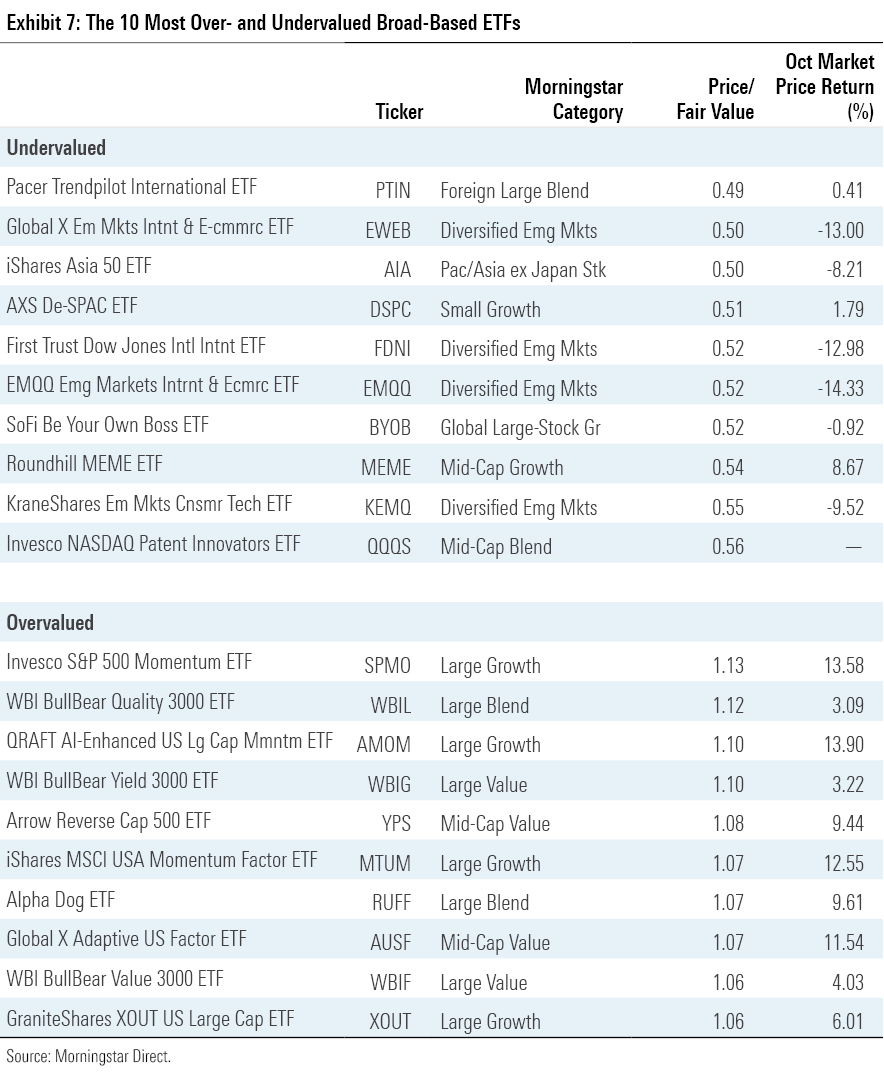
For testimony of how much the market has changed in one year, look at iShares MSCI USA Momentum ETF MTUM, which finds itself on the pricier half of Exhibit 7. This fund selects and weights 125 U.S. stocks by their exposure to momentum, a well-vetted risk factor that has historically been tied to outperformance. Market momentum can shift on a dime, which can make this fund look quite different from one semiannual rebalance to the next. Indeed, at October’s end, stocks that were in the portfolio a year ago represented just 10% of the portfolio. In response to the market, MTUM loaded up on healthcare, energy, and consumer staples stocks, sporting a combined 69% stake in those sectors at October’s end, a 50-percentage-point uptick from October 2021. While this sector shuffle requires a lot of turnover—and transaction costs—it has been worth the squeeze: The fund’s return ranked with the top 1% of its category peers in October and within the best decile for the year to date.
The author or authors do not own shares in any securities mentioned in this article. Find out about Morningstar’s editorial policies.
/cloudfront-us-east-1.images.arcpublishing.com/morningstar/T2LGZCEHBZBJJPPKHO7Y4EEKSM.png)
/d10o6nnig0wrdw.cloudfront.net/04-18-2024/t_34ccafe52c7c46979f1073e515ef92d4_name_file_960x540_1600_v4_.jpg)
/d10o6nnig0wrdw.cloudfront.net/04-09-2024/t_e87d9a06e6904d6f97765a0784117913_name_file_960x540_1600_v4_.jpg)
:quality(80)/s3.amazonaws.com/arc-authors/morningstar/30e2fda6-bf21-4e54-9e50-831a2bcccd80.jpg)