
Q3 2022 Market Performance in Charts
Bonds again offer no safe harbor as stocks make a round trip in the bear market.
/s3.amazonaws.com/arc-authors/morningstar/ba63f047-a5cf-49a2-aa38-61ba5ba0cc9e.jpg)

For investors, the third quarter began with a relief rally but ended back in the doldrums.
It was an especially dour quarter for the already-bloodied bond market, where many bond mutual funds are posting their worst losses ever.
The result is that even investors with portfolios diversified among stocks and bonds—through what is often referred to on Wall Street as the 60/40 portfolio approach—are facing losses approaching 20% this year. In fact, in the third quarter, the performance of a 60/40 portfolio would have been worse than one just invested broadly in stocks, an extremely unusual turn of events.
Stock and bond market performance—along with increasingly extreme moves in the currency markets—continued to be driven by the knock-on effects of decades-high inflation, aggressive interest-rate increases by the Federal Reserve and other major central banks, rising risks of recession, and lingering ripples from the pandemic and Russia’s invasion of Ukraine.
By quarter-end, stocks were solidly in bear-market territory, and bond yields—which move in the opposite direction of prices—were at their highest levels in years.
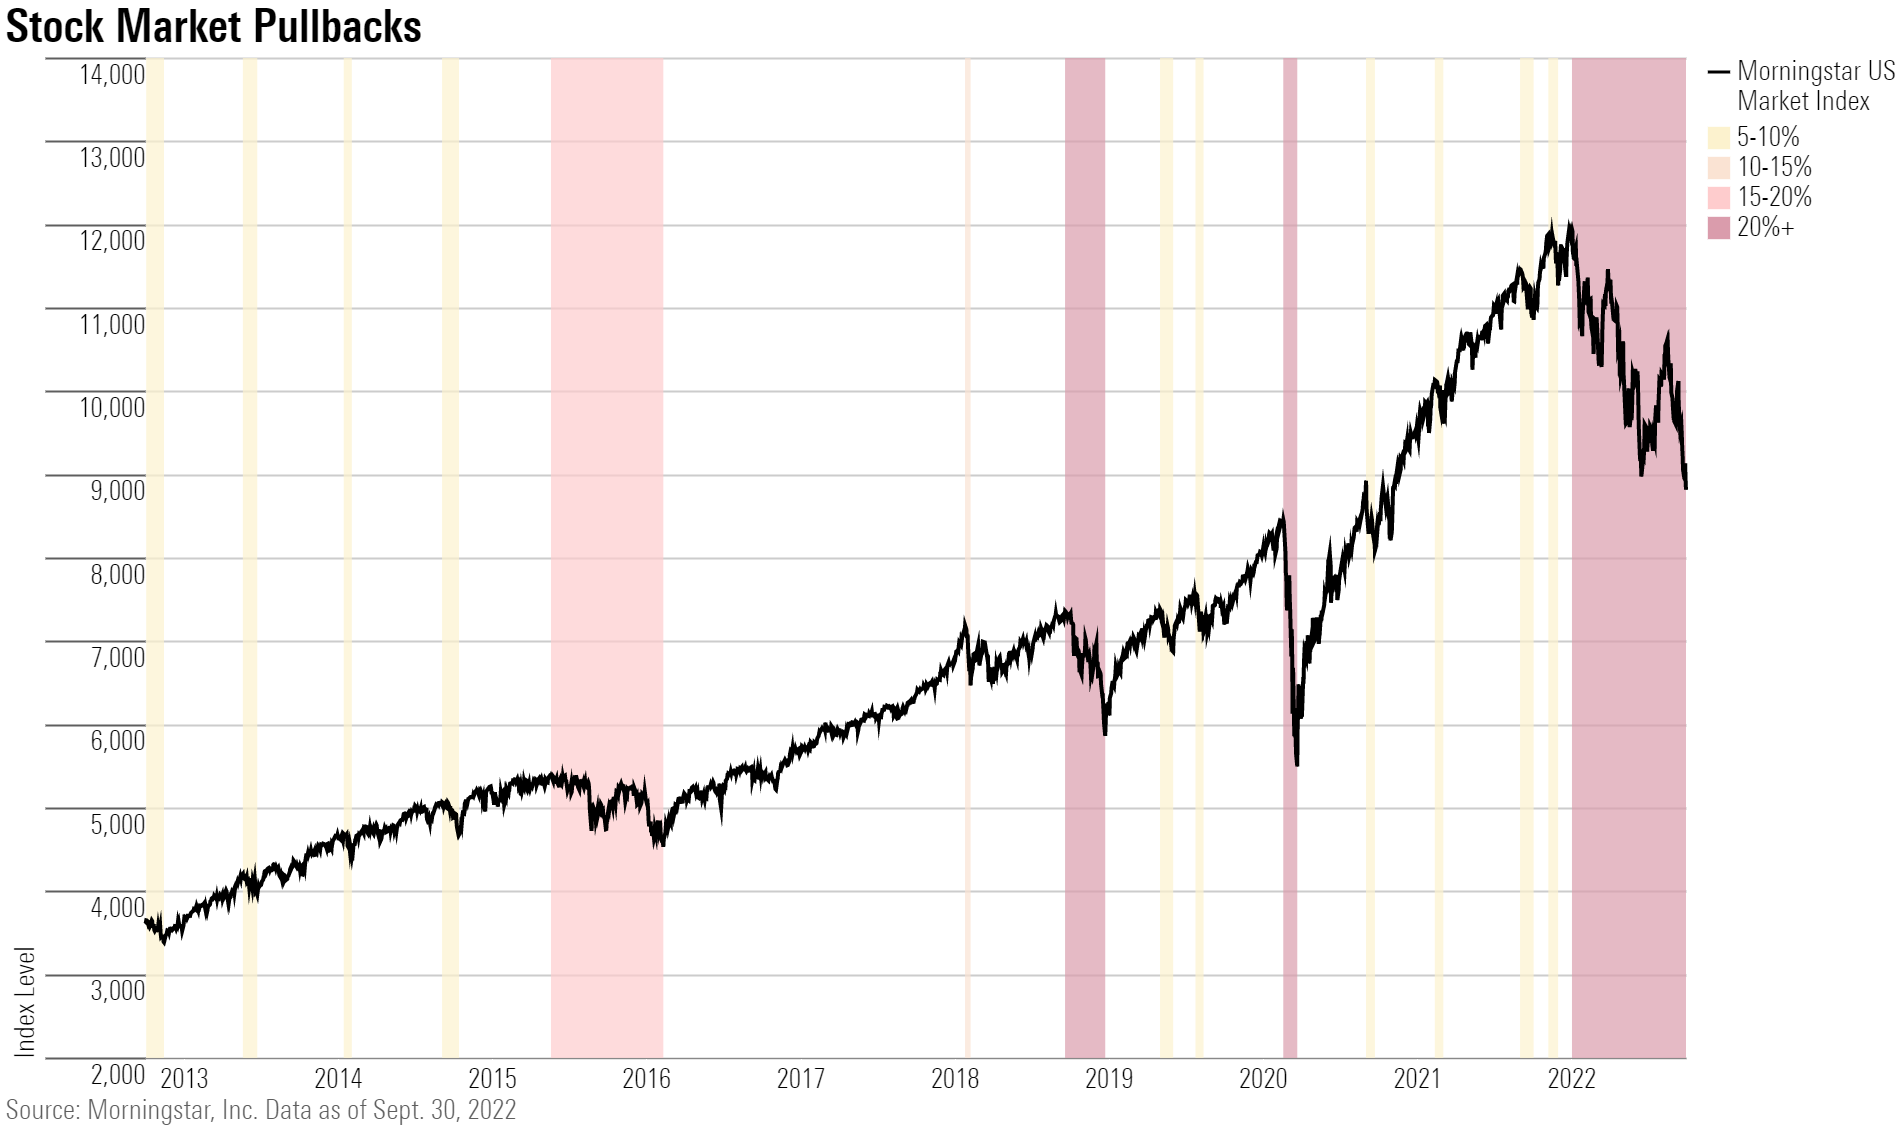
It didn’t start out that way, however. A stock market rally that began at the tail end of the second quarter took the Morningstar US Market Index up over 18% from its mid-June bottom. Bond yields declined amid hopes that inflation had passed its peak and that the Fed could cool its hawkish interest-rate increases.
But a shockingly high inflation reading for August caused worry for investors and Fed officials alike. At the latest policy meeting on Sept. 20, chairman Jerome Powell and the Federal Reserve board signaled more rate hikes ahead for the rest of the year, leading bonds and stocks deep into a selloff that lasted through the final days of the quarter.
Key Stats: Q3 Market Performance
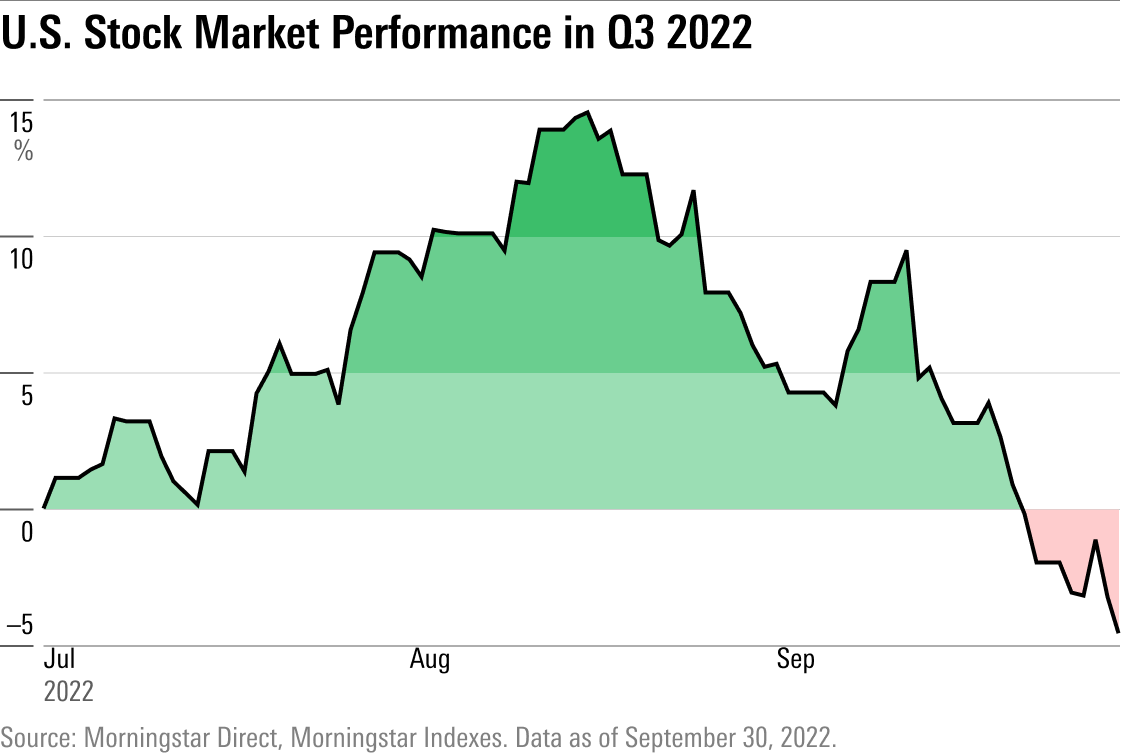
- The Morningstar US Market Index lost 4.6% during the third quarter. Stocks hit a new bear market low on the quarter's final day, down 24.9% so far in 2022. That's their worst performance through this point in any year since 2002.
- It was a dramatic round trip for stock market performance in the third quarter. The Morningstar US Market Index rose 14.6% from the end of June through Aug. 16, then fell 16.5% from that high by the end of the third quarter.
- The Morningstar US Market Index has fallen for three consecutive quarters, the kinds of losses not seen since 2008.
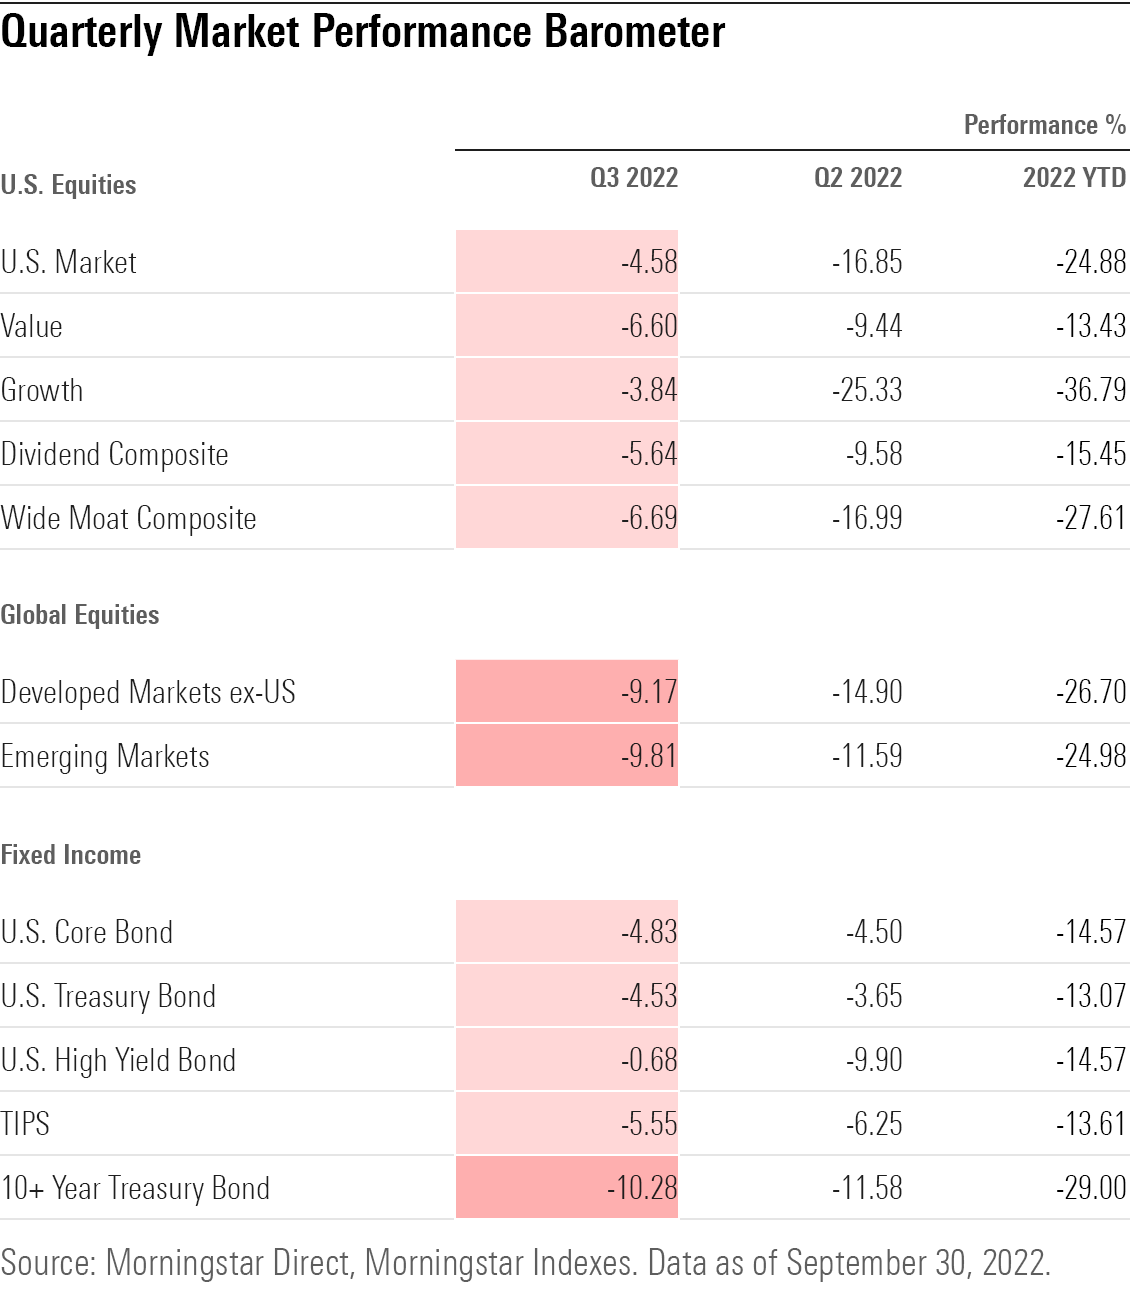
- Dividend stocks took a hit, falling 5.6% as a group, trailing the broader market by a full percentage point.
- Bonds are having their worst year in modern history, as the Morningstar US Core Bond Index fell 14.6% for the year through Sept. 30.
- The yield on two-year U.S. Treasuries rocketed higher, ending the quarter at 4.22%, up from just 0.27% a year ago. Before September, two-year yields haven't been as high since October 2007.
- The yield curve is now significantly inverted, marking a commonly cited indicator of impending recession. The last time the yield curve inverted at all was in 2019. Now, it's the most inverted it has been since the summer of 2000.
- The Fed's hawkish effort to stamp out inflation brought two more aggressive rate hikes, raising the effective federal-funds rate target to 3.00%-3.25%, its highest level since 2008.
- The U.S. dollar is on its strongest run in two decades, adding to concerns about the outlook for corporate earnings.
- Crude oil prices reached their lowest levels since January, ending the quarter at $77.1/barrel.
Best and Worst Market Performance
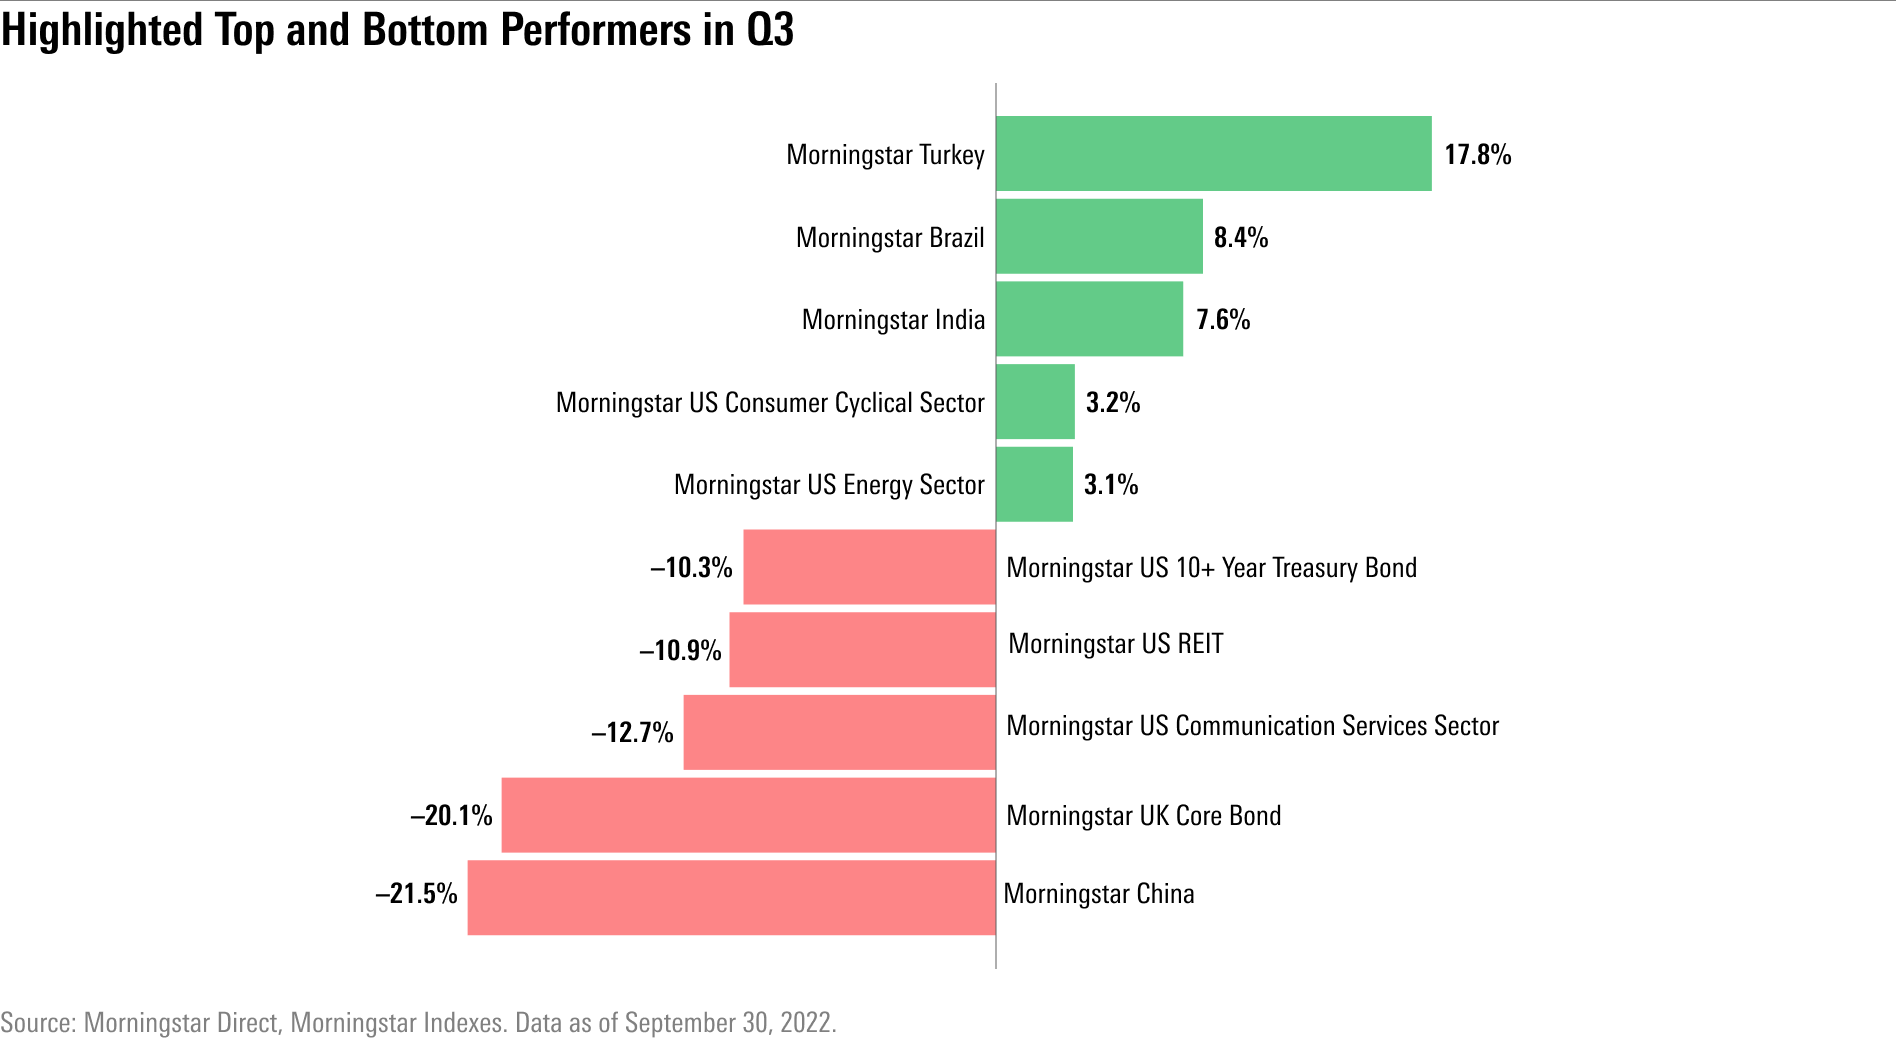
By the end of the third quarter, economically sensitive markets were among those with the biggest losses as investors continued worrying about the potential for a global recession amid sharply rising interest rates.
The Morningstar US REIT Index—representing publicly traded real estate investment trusts—and the Morningstar 10+ Year Treasury Bond Index, both of which are sensitive to interest-rate changes, fell 10% each this quarter.
The Morningstar UK Core Bond Index had its worst quarter ever as the British pound plunged to an all-time low versus the dollar. The pound’s value declined steeply as a new U.K. government unveiled plans to grow the country’s economy through a combination of tax cuts and heavy government borrowing at a time when inflation is already a challenge.
While the third quarter saw poor performance for emerging-markets investments overall, a few countries bucked the trend. Among Morningstar’s country indexes, the Morningstar Turkey Index was the top performer as the country’s central bank continued lowering interest rates despite 80% inflation. Morningstar’s Brazil and India indexes each saw positive gains in the down quarter.
Stock Market Performance
At the end of the third quarter, stocks were back in bear-market territory, erasing a bounce that began in the final weeks of the second quarter.
While the third quarter had a sour end, the stock market’s performance had started out on an up note. In July, the Morningstar US Market Index jumped 9.4% for its best monthly performance since November 2020. Stocks continued their run through the first half of August, reaching a high point on Aug. 16. That rally had stocks up 14.5% for the quarter, clawing back more than half the market’s losses suffered through mid-June. The strong move higher, coupled with expectations that inflation had peaked, had investors wondering if the worst was over and if stocks had started a new bull run.
But it wasn’t to be the case.
Inflation continued to run hot, and by September, a third consecutive aggressive interest-rate increase from the Fed and growing fears of recession sent stocks into another tumble. An earnings warning from global shipping company FedEx FDX added to concerns about the impact of a slowing global economy on corporate profits, which have remained stronger than many had expected.
The Morningstar US Market Index hit a new bear-market low on the closing day of the quarter on Sept. 30 as investors resigned themselves to continued volatility and the potential for an extended bear market, rather than the V-shaped bounces that have occurred after recent downturns.
By the end of the third quarter, stocks were down 4.6% for the prior three months and 24.9% so far in 2022.
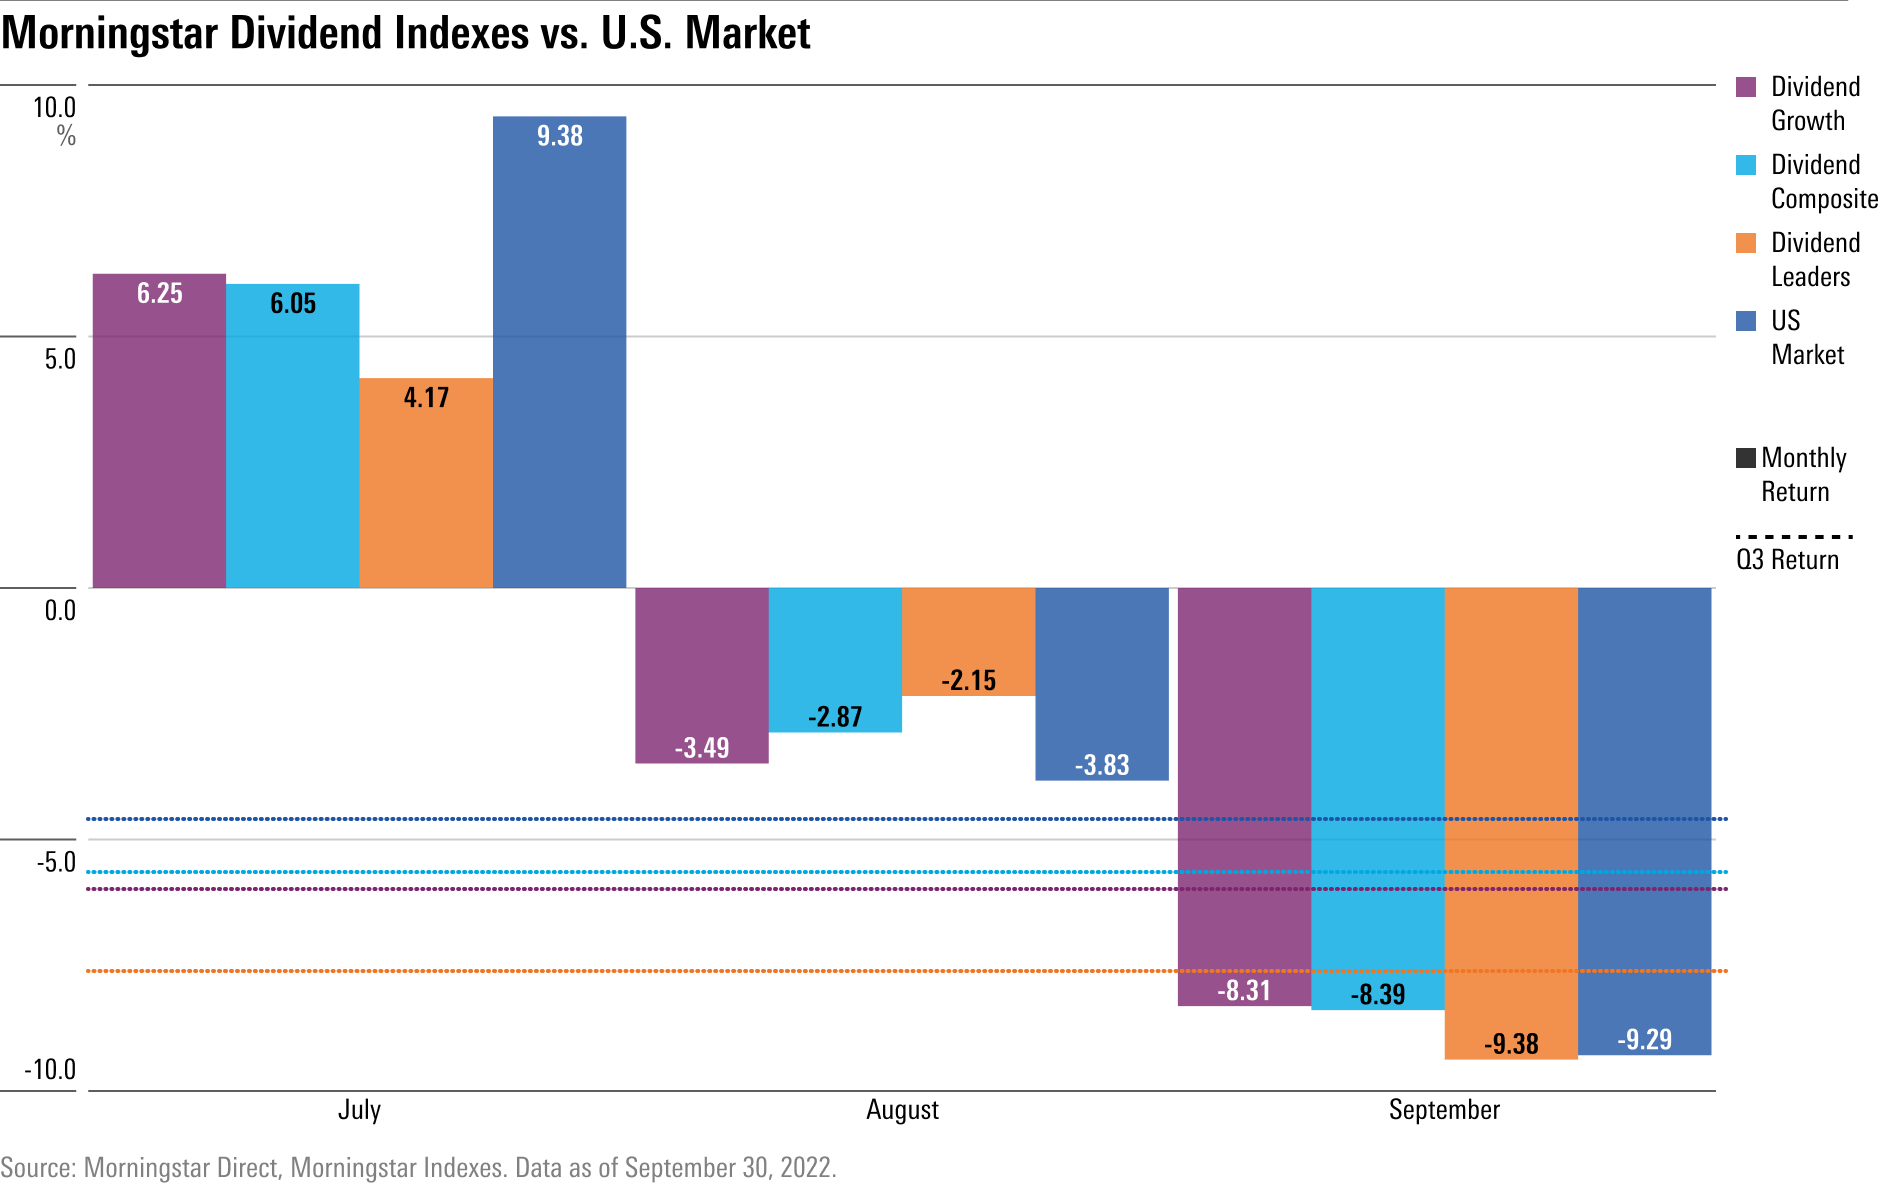
Dividend-Stock Performance
During the first half of 2022, dividend-paying stocks helped cushion the blow of the bear market. The Morningstar Dividend Composite Index—a broad measure of dividend stock performance—fell just 10.4%, half the losses taken by the Morningstar US Market Index through June. But when it came to third-quarter performance for dividend stocks, it was a mixed picture.
As the market rallied in July, dividend-paying stocks began to lag, and the Morningstar Dividend Leaders Index—a collection of the 100 highest-yielding stocks that also maintain a consistent history of paying dividends with a designated ability to maintain those dividends going forward—trailed the market by more than 5 percentage points. The tide shifted back in favor of dividend stocks in August as the broad market fell, and Dividend Leaders remained buoyant.
But in September, it was stocks of companies that have been growing their dividends over time—represented by the Morningstar US Dividend Growth Index—and stocks of companies with the highest yields—represented by the Morningstar High Dividend Yield Index—that fared best. Dividend Leaders, meanwhile, took a hit on the back of a 7.6% decline led by Verizon Communications VZ, Philip Morris PM, and International Business Machines IBM.
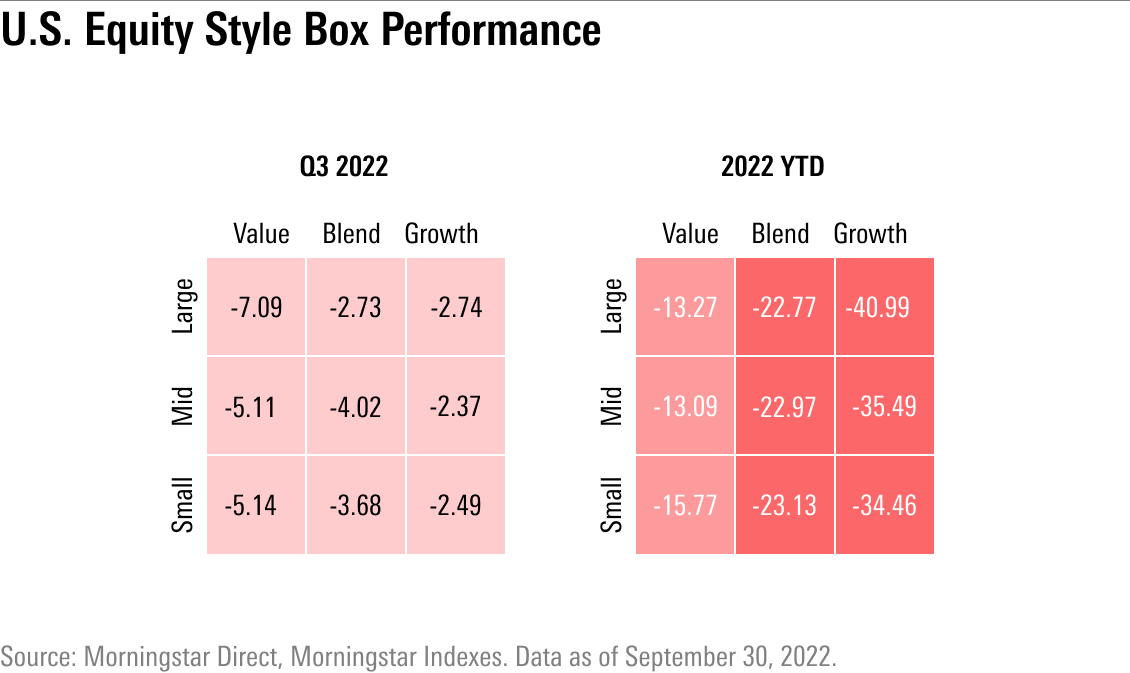
Value Stock vs. Growth Stock Performance
It’s been a brutal year for investors in growth stocks, but at the very least, the third quarter didn’t see those losses get that much worse.
For much of the quarter, there was no clear winner in the value-growth tug-of-war: Some in the markets recommended turning instead to beta—a measure of volatility—to find the next leaders amid the uncertain outlook. But in the third quarter's final days, growth and blend stocks outpaced their value counterparts.
In fact, by the end of the third quarter, losses on value stocks exceeded those on growth stocks, a reversal from the previous quarter, when value outperformed growth by the widest margin since the dot-com bubble collapse.
Still, large-growth stocks are on pace to have their worst year since 2008.
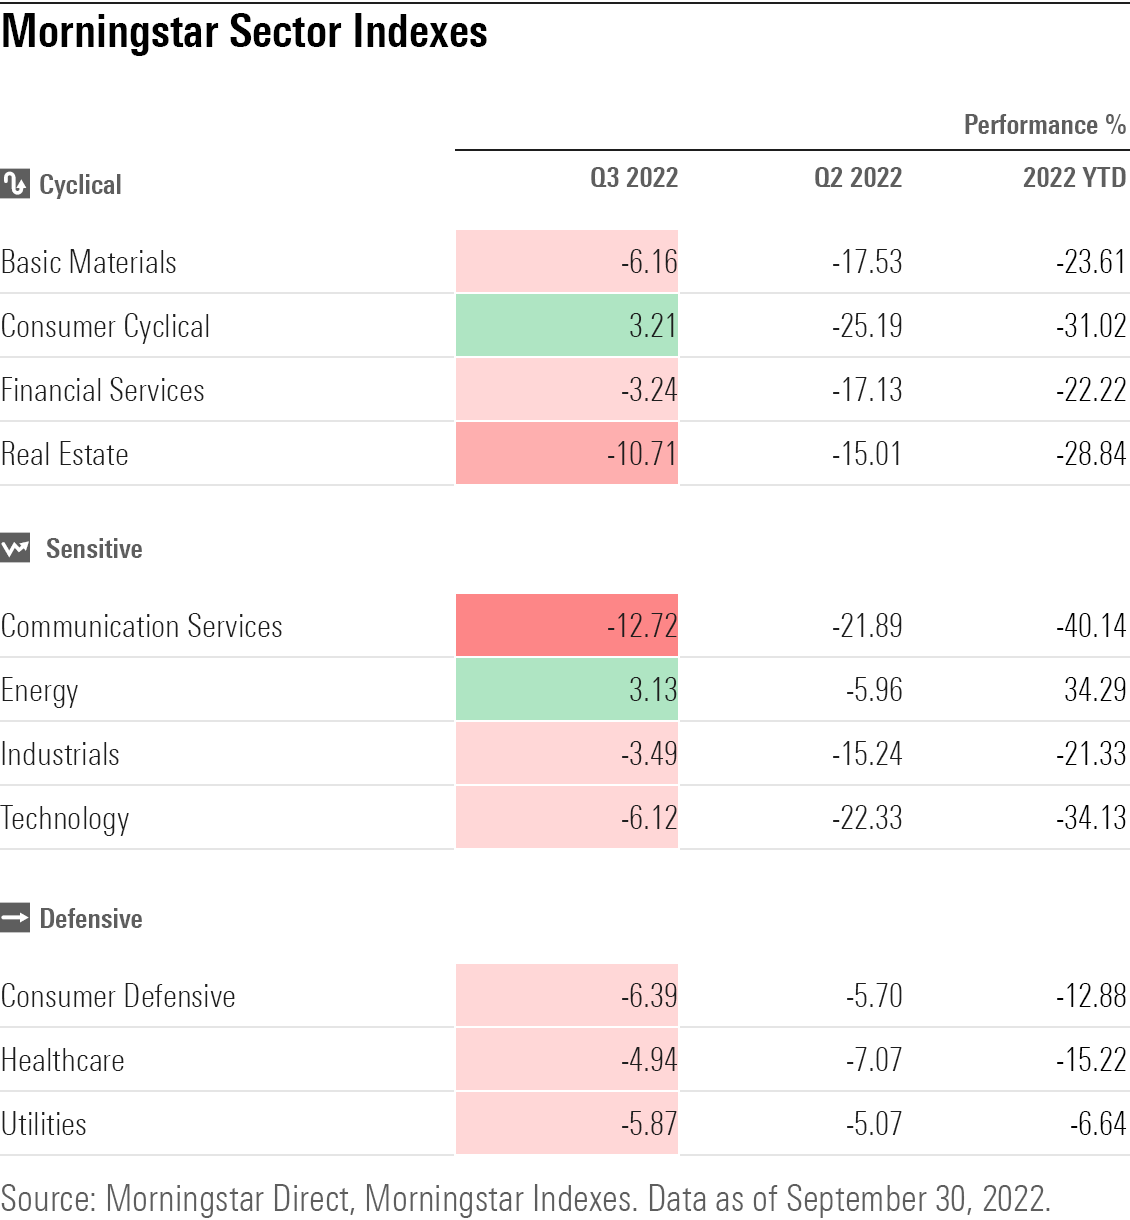
Sector Performance
Despite rising risks of a recession, economically sensitive consumer cyclical stocks were the winners as of the end of the third quarter, led by Tesla TSLA, Amazon.com AMZN, and Starbucks SBUX.
Also underlying the market performance at the sector level for consumer stocks, retail giants Walmart WMT and Home Depot HD reported better-than-expected second-quarter sales and profits in August. For the year to date, the sector hasn’t fared as well, lagging behind nearly all others.
The communication services sector was the key detractor from the broader market during the third quarter, dragged down by heavyweights such as Google GOOGL parent company Alphabet, Facebook parent company Meta META, and Verizon VZ. These high-growth, tech-enabled stocks are especially sensitive to interest-rate changes since their stock prices depend heavily on expectations of future earnings growth.
For the year, stocks from Morningstar's defensive Super Sector have broadly lived up to their name, protecting against some of the declines seen in 2022.
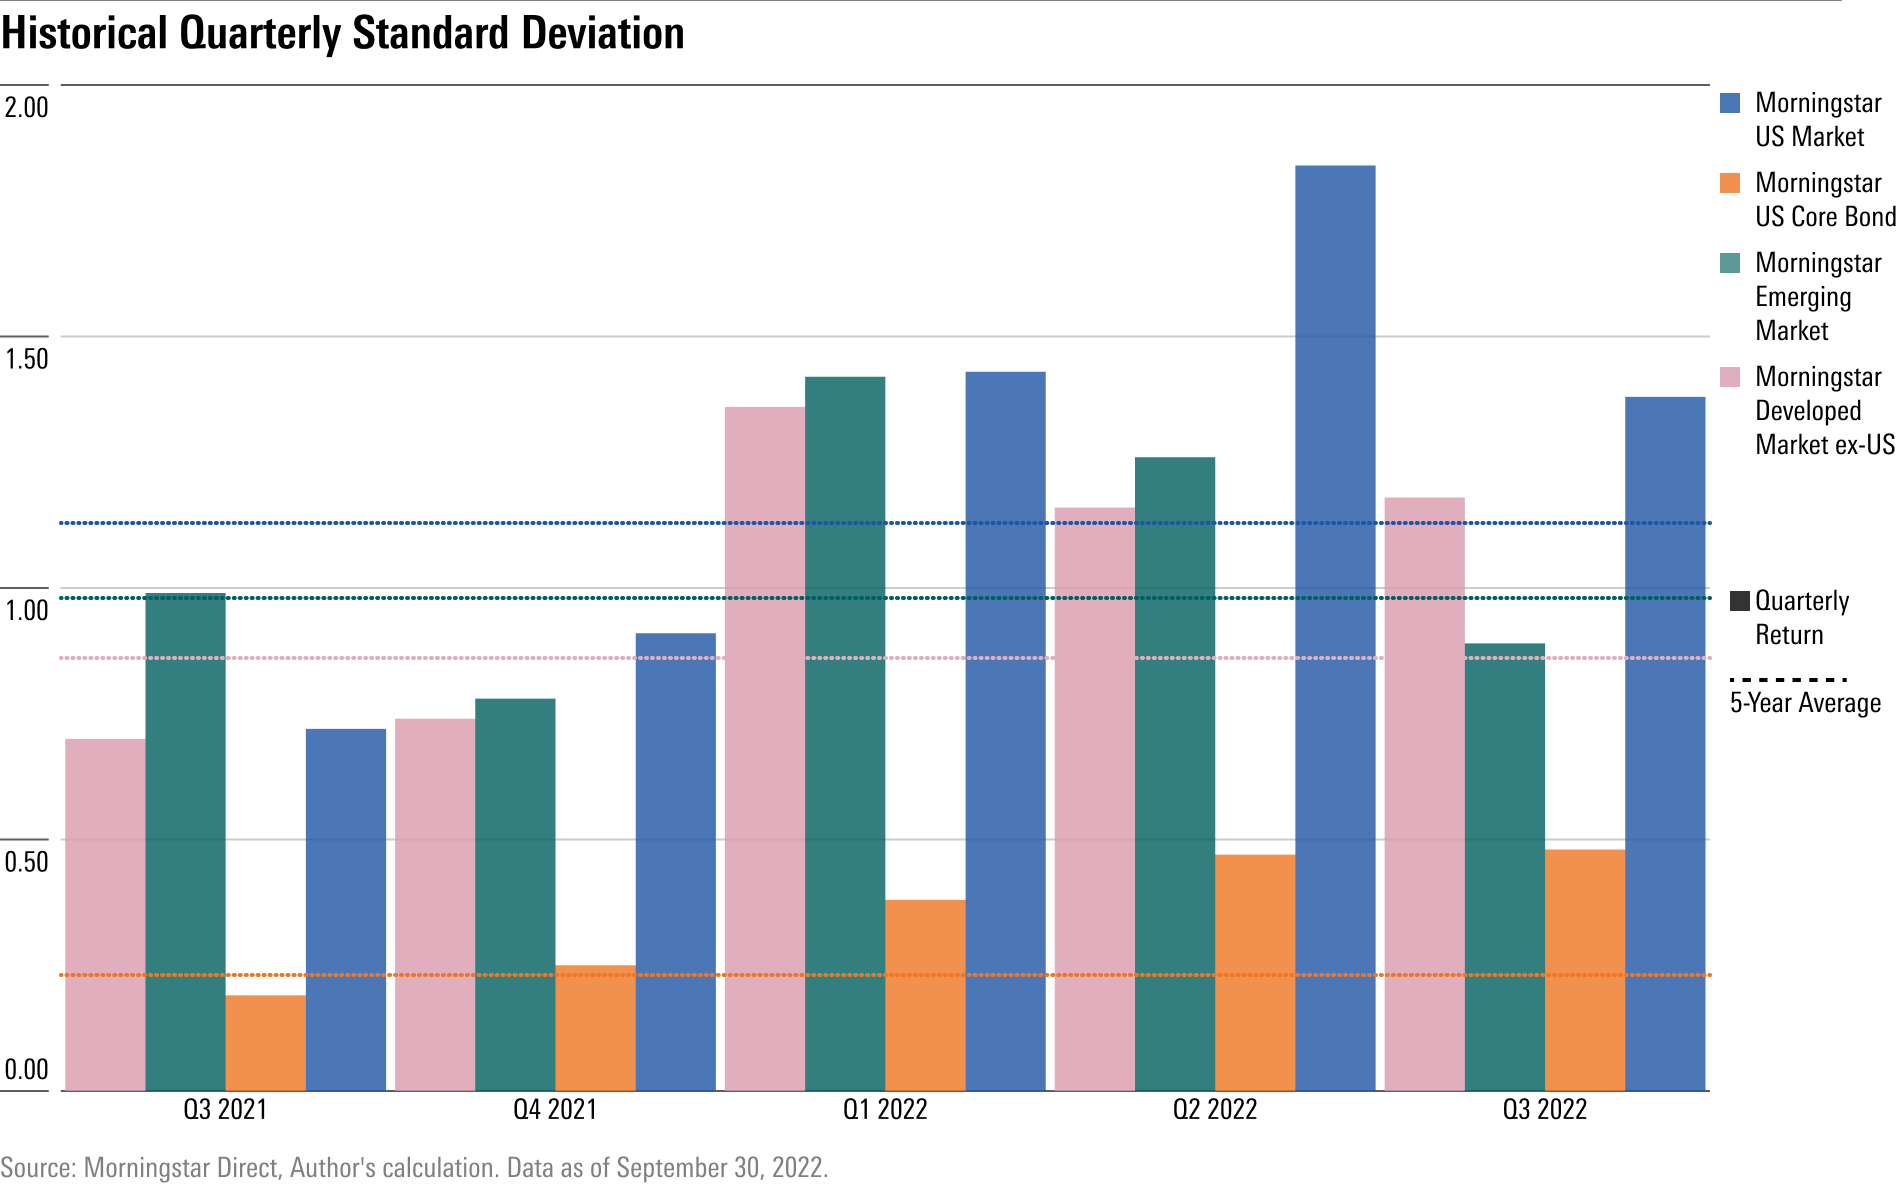
Volatility
If there was one dominant trend across the markets in the third quarter, it’s that volatility remained high.
That includes the move in stocks on Sept. 13, when the Morningstar US Market Index lost 4.3 percentage points in a single day. Before this past month, there hadn’t been any single-day drops of 4% or more since 2020.
The quarter also saw 14 days where the Morningstar US Market Index dropped between 1% and 2%. That’s a rate of market swings well-above the three-year average of just five such days per quarter.
Another measure of market volatility, standard deviation, shows just how much more prone global markets have been to wide price swings.
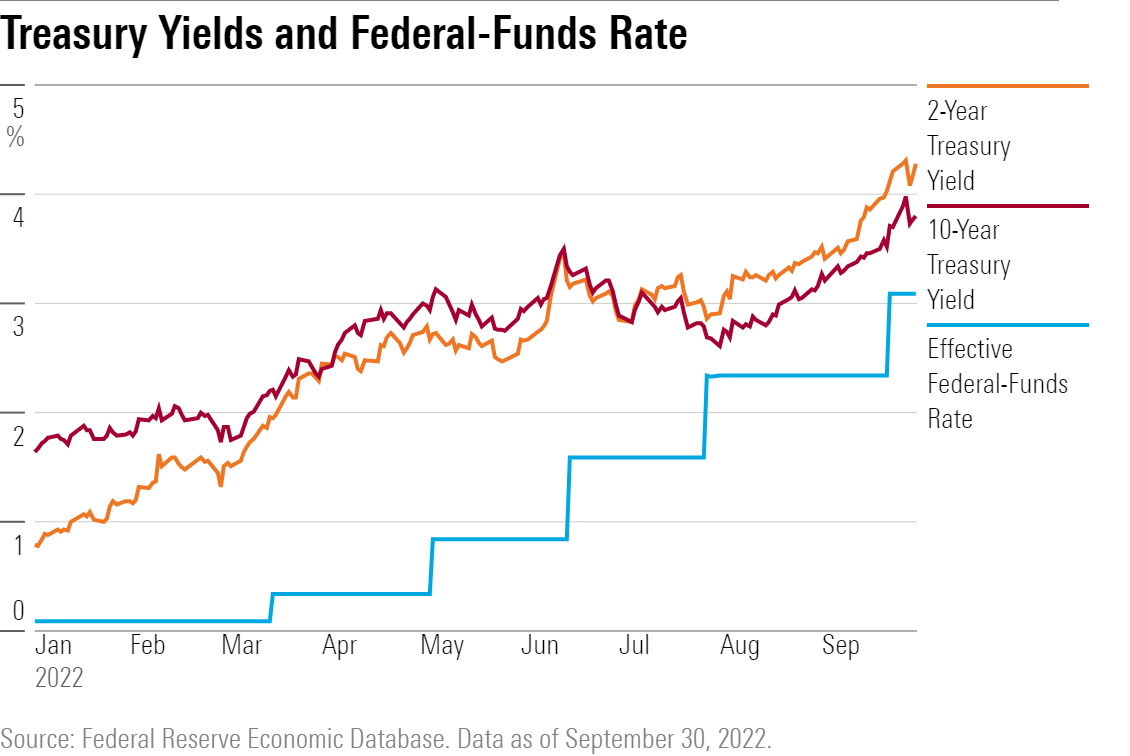
Rising Interest Rates
Underlying the market tumult has been the Fed’s unprecedented interest-rate increases and the resulting jump in bond yields.
The quarter saw two more aggressive interest-rate hikes of 0.75 percentage points, one in July and the other on Sept. 21. The effective federal-funds rate now stands at 3.00%-3.25%, its highest level since 2008. Prior to the Fed raising the fed-funds rate by three-fourths of a point in June, the Fed hadn’t raised its flagship policy rate by 0.75 percentage points in any single meeting since 1994.
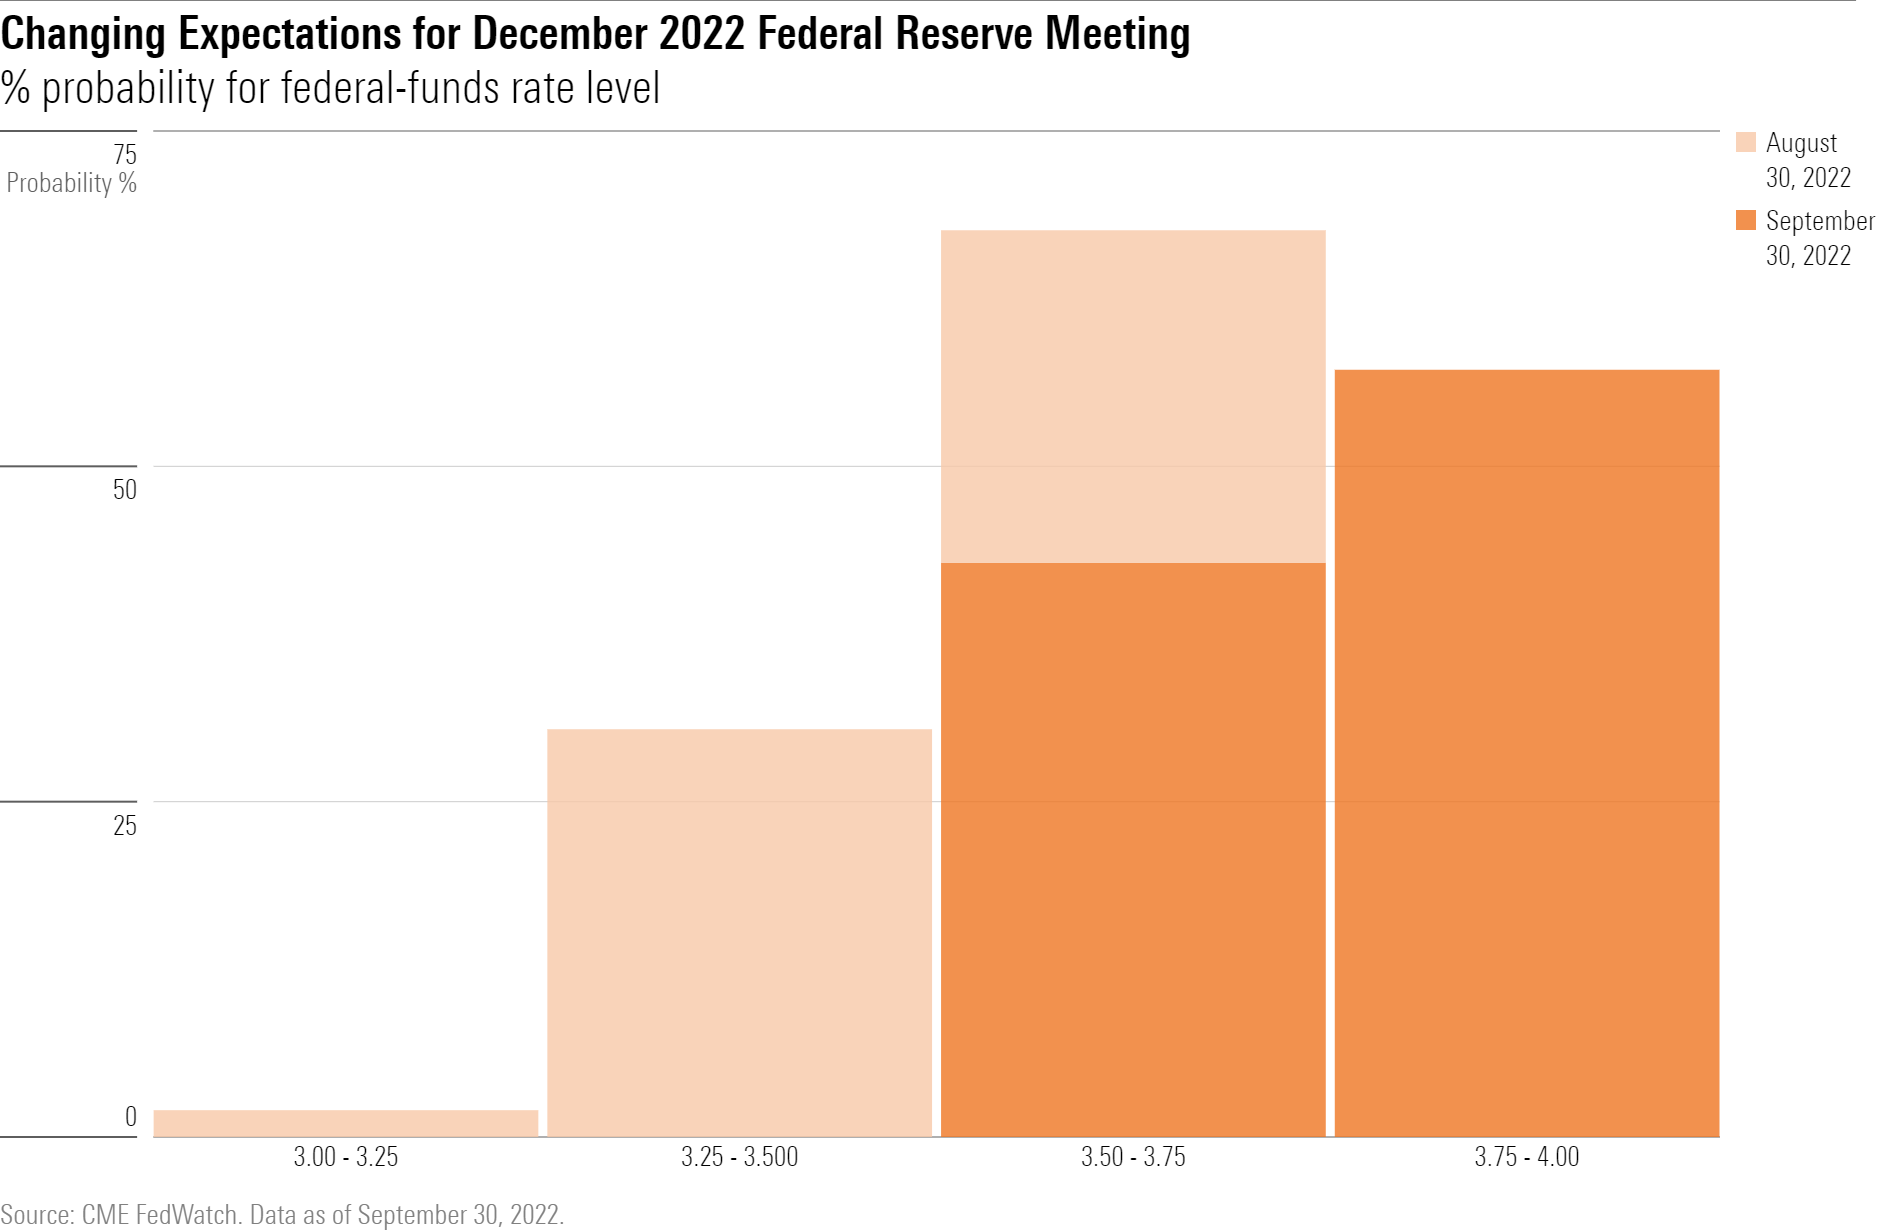
At its September policy meeting, the Fed signaled no signs of slowing down its aggressive stance, with officials’ latest projections suggesting that the federal-funds rate will rise by another percentage point by the end of 2022. The latest so-called “dot plot” of Fed officials’ forecasts showed that the median fed official expected interest rates to rise to 4.4% by the year’s end—a big increase from the median fed-member projection of 3.4% released in June.
(Morningstar’s chief economist Preston Caldwell writes that the Fed could pivot to lowering interest rates by the end of 2023.)
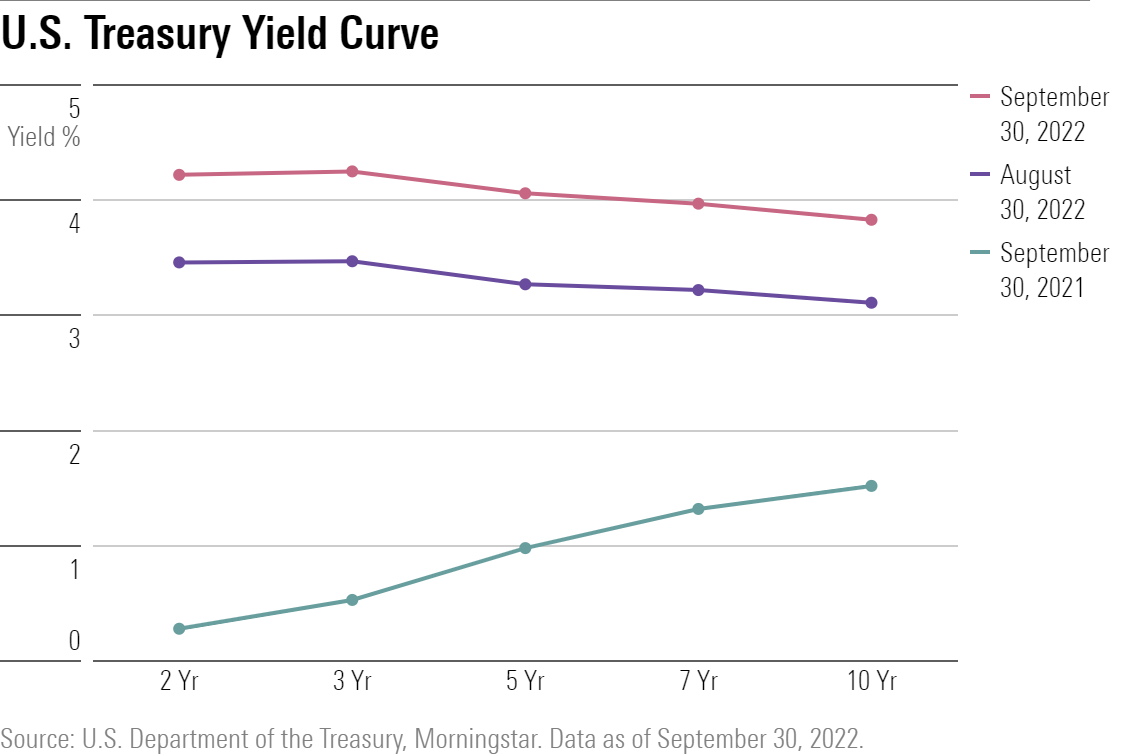
Inverted Yield Curve
As the Fed raised rates, yields on U.S. Treasuries climbed rapidly. The yield on the 10-year U.S. Treasury rose to 3.97% on Sept. 27, its highest level since 2010, and ended the quarter at 3.83%. That’s up from 2.88% on July 1. The two-year Treasury yield ended the quarter even higher at 4.22%, up from 2.84% at the start of the quarter—a very large move for a short-term government bond.
With short-term Treasury yields higher than long-term yields, the bond market is in what is called an inverted yield curve in Wall Street jargon. Inverted yield curves are often seen as a precursor to a recession. During the third quarter, the gap between the yield on the two-year note and 10-year note rose to 0.39 percentage points from negative 0.04 three months earlier.
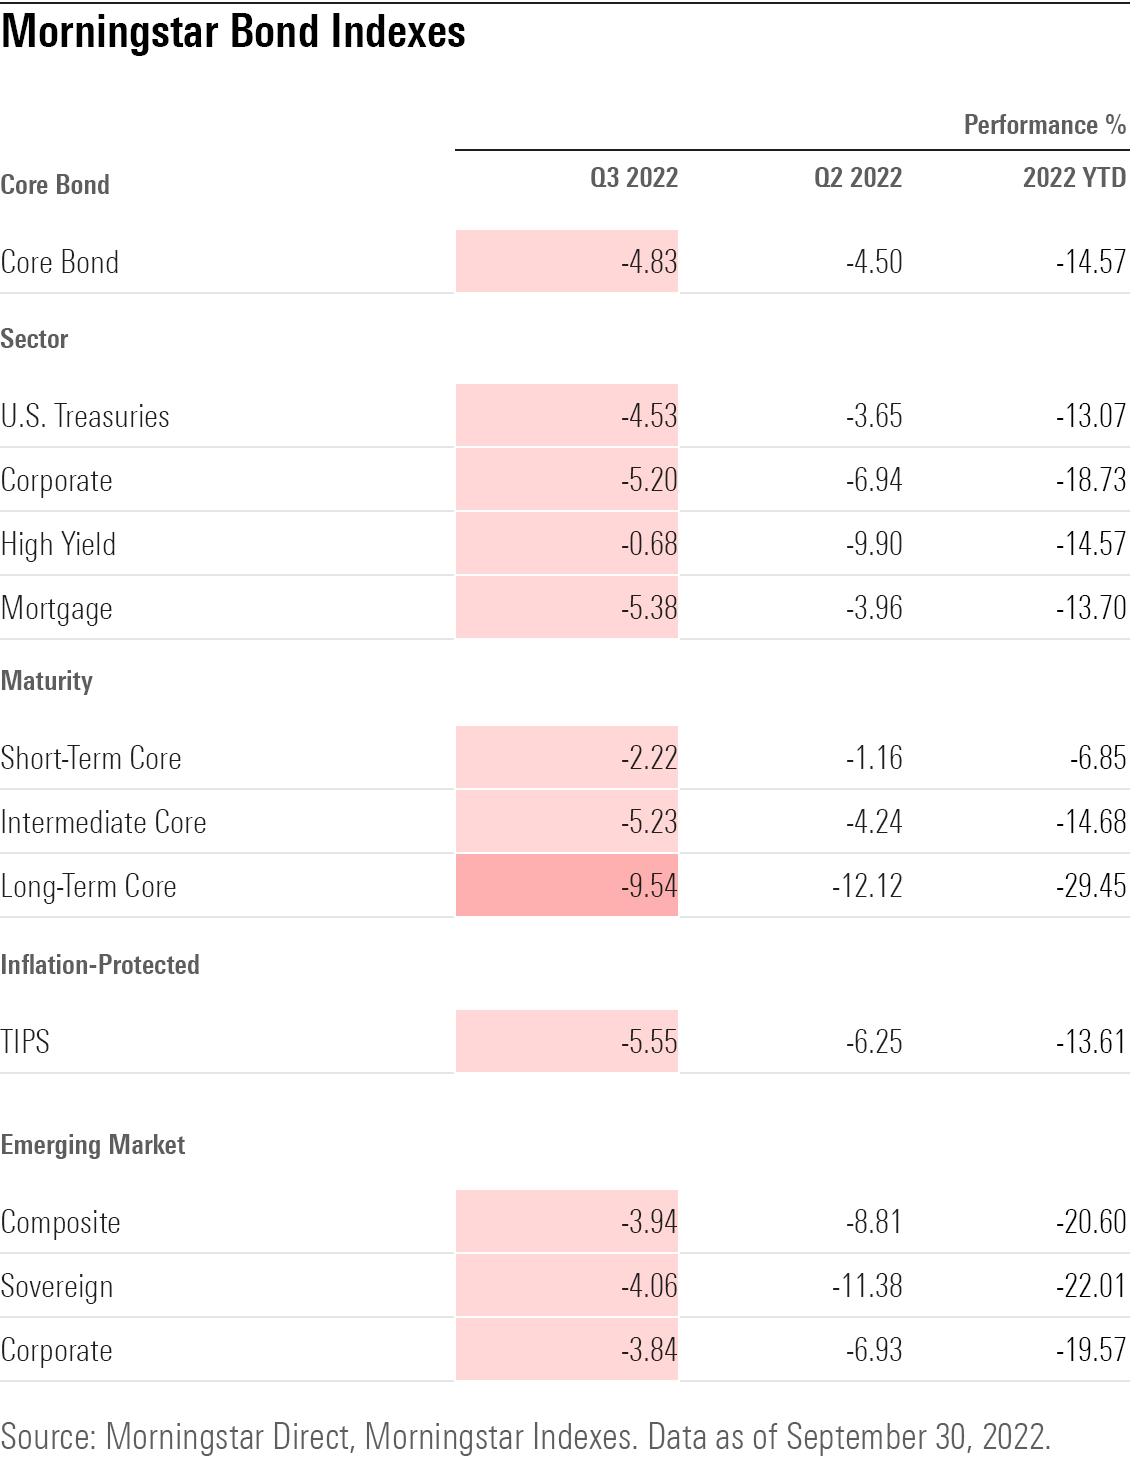
Third-Quarter Bond Market Performance
Against this backdrop, bonds of nearly all kinds posted steep losses as of the end of the third quarter, extending already historic losses from the first half of the year. Many corners of the bond market are posting their biggest losses on record for the year to date.
Among Morningstar’s fixed-income indexes, core bonds, global Treasuries, and long-term U.S. Treasuries all saw their worst market performance this year since the start of performance history in 1999.
The year’s massive decline in prices across the bond market has led to a huge rise in bond yields (bond yields and bond prices always move in opposite directions), making them attractive to income investors.
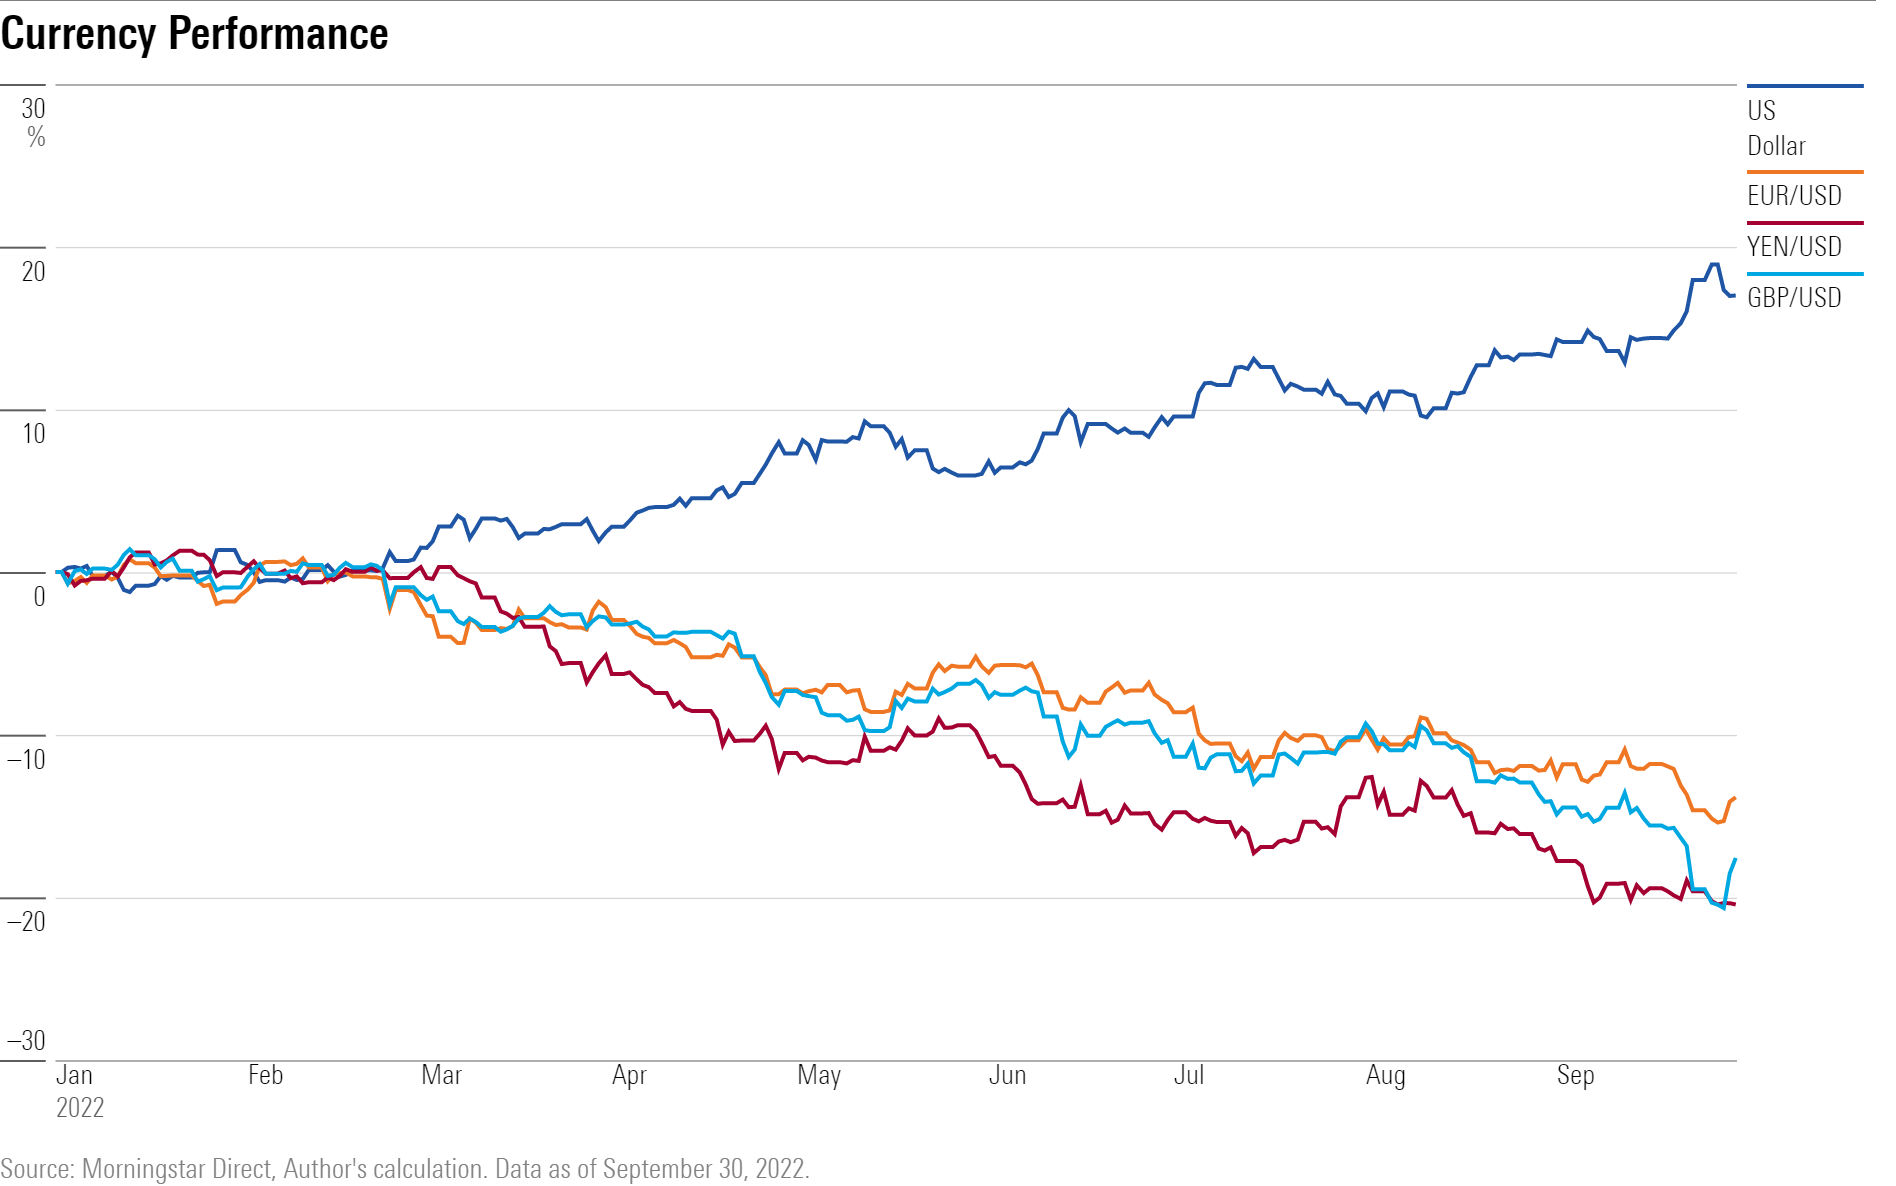
The Strengthening Dollar
The Fed’s rate hikes have also caused significant waves in the currency markets, where the U.S. dollar rose to multidecade highs against major currencies.
The dollar is having its best run in 20 years. With U.S. interest rates rising rapidly and investors worried about a global economic slowdown, investors have moved into U.S. currency in search of yield and a safe haven. The dollar rose 8.6% during the quarter. Meanwhile the euro fell 6.8% against the dollar, and the yen fell 15.2%.
The strengthening of the U.S. dollar will likely have a negative effect on third-quarter earnings, according to Morningstar’s chief markets strategist David Sekera. In particular, large multinational tech companies will see a headwind as sizable chunks of their sales come from outside the United States. That’s because as the value of the dollar rises, it makes U.S.-produced goods more expensive outside the country.
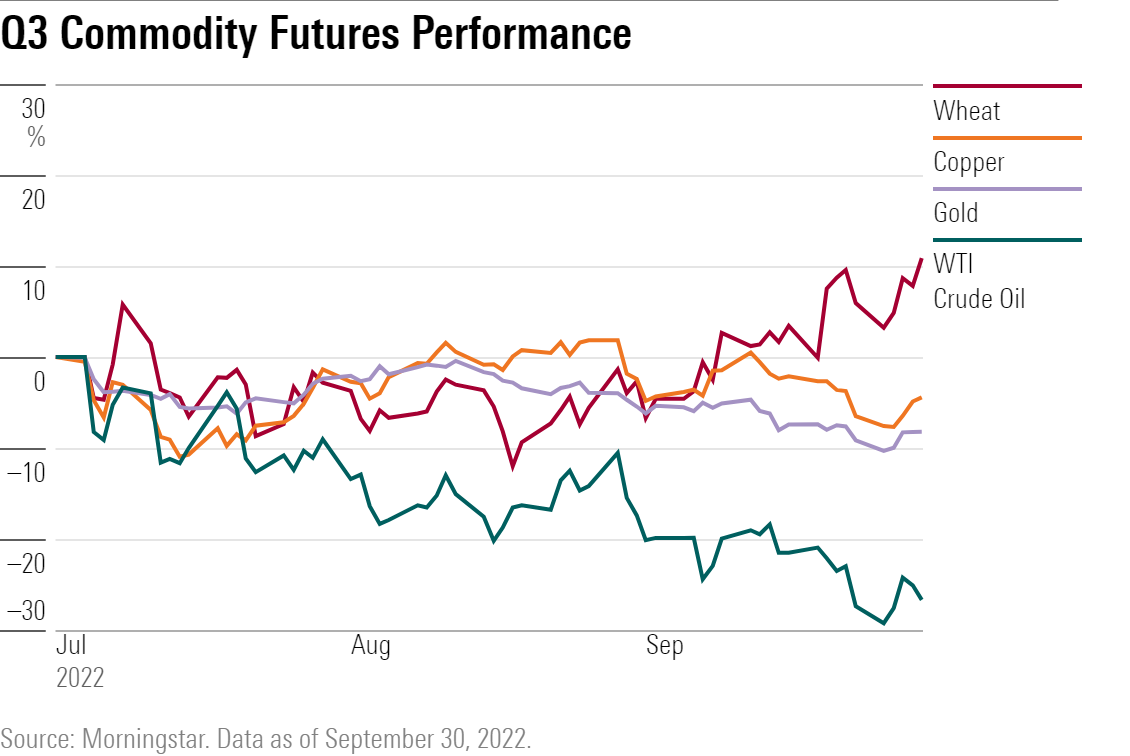
Commodities
Key commodities fell during the third quarter, with the notable exception of wheat prices, which rose 10.9% for the period, as the world’s wheat supply remains affected by Russia’s aggression in Ukraine.
Despite gold’s long history as a safe haven, as Morningstar portfolio strategist Amy Arnott writes, its ability to improve portfolio performance over longer periods has been convincing. This quarter, the asset class sputtered and fell into negative territory with losses of 8.2%.
Copper also ended the third quarter in the red, though its decline was muted compared with the steep second-quarter drop of 21%. The metal is seen as a bellwether for the global economy, as it is used as an input in production and equipment for a wide range of industries.
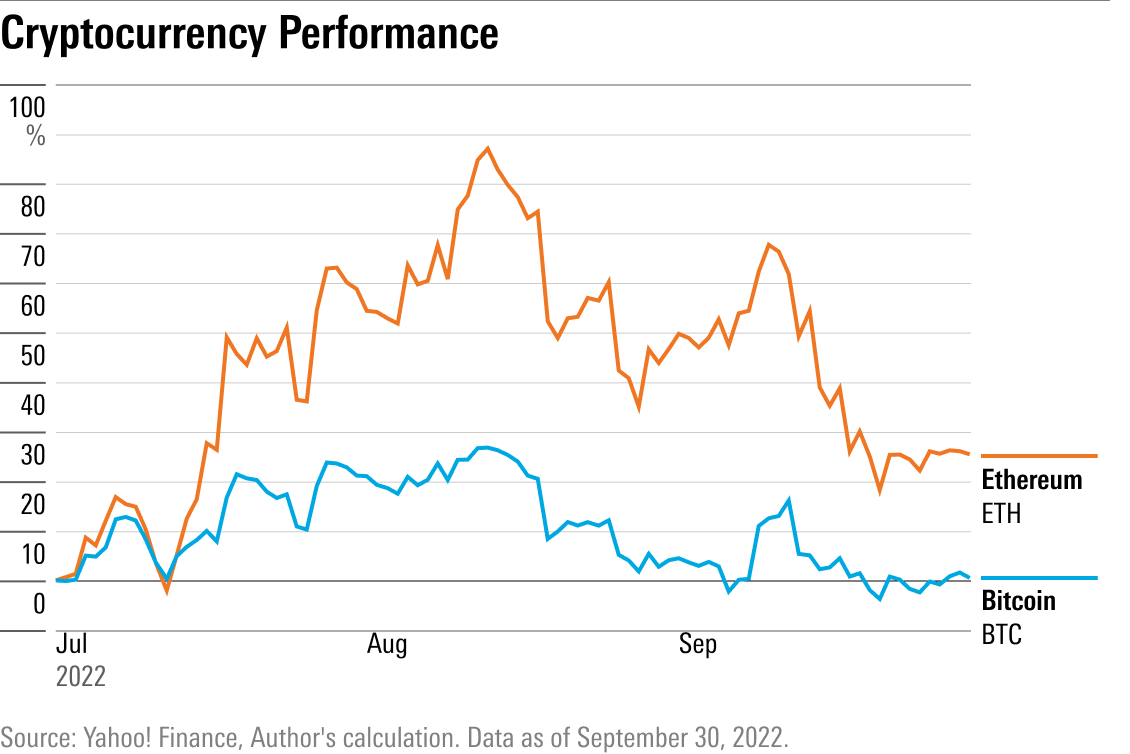
Cryptocurrency
Investors in cryptocurrencies also continued to suffer through volatility. However, for bitcoin—the first cryptocurrency and the largest by market size—swings were much more muted than they’ve been, especially compared with the second quarter when it lost 57% of its value.
Bitcoin began trading July 1 at $19,820 and closed on Sept. 30 at $19,431.
The second-largest cryptocurrency, ether, ended the quarter in positive territory but well off from its best levels of the previous three months.
What’s Next for Stock and Bond Market Performance?
From here, the outlook will hinge almost entirely on the pace at which inflation begins to abate, market strategists and fund managers say.
Unless inflation begins to soften quickly, it’s not likely the pressure on stock and bond markets will ease anytime soon. For now, more signs are pointing to a slowdown in economic growth and the Fed is gearing up for two more interest-rate hikes before the end of 2022.
Against that backdrop, investors need to keep their seat belts buckled and brace for even more volatility and difficult market performance in the coming months.
/cloudfront-us-east-1.images.arcpublishing.com/morningstar/54RIEB5NTVG73FNGCTH6TGQMWU.png)
/cloudfront-us-east-1.images.arcpublishing.com/morningstar/ZYJVMA34ANHZZDT5KOPPUVFLPE.png)
/cloudfront-us-east-1.images.arcpublishing.com/morningstar/MNPB4CP64NCNLA3MTELE3ISLRY.jpg)
:quality(80)/s3.amazonaws.com/arc-authors/morningstar/ba63f047-a5cf-49a2-aa38-61ba5ba0cc9e.jpg)