
Have Stocks Become Cheap?
Well, it depends.
/s3.amazonaws.com/arc-authors/morningstar/1aafbfcc-e9cb-40cc-afaa-43cada43a932.jpg)

Three Possibilities
United States equities have dropped 22.8% for the year to date, as measured by the Morningstar US Market Index. (Other broad stock market benchmarks show similar results.) Their troubles could well continue. Three times during the past 25 years, U.S. equities have lost more than 30%, first from 2000 through 2002, then in 2008, and finally (albeit fleetingly) in spring 2020. Nevertheless, the decline raises the question: Have stocks fallen far enough to become bargains?
Answering that question, of course, is a perilous task. Predicting stock market returns is much easier after the fact than doing so contemporaneously. The problem is that the relevant indicators change. A signal that presaged the previous downturn reappears—and then the stock market surges, leaving those who raised cash ruing their error. One bear market rarely resembles the next.
We can, however, address the topic very generally. Broadly speaking, do U.S. stocks appear to be cheap, expensive, or neither?
The CAPE Ratio
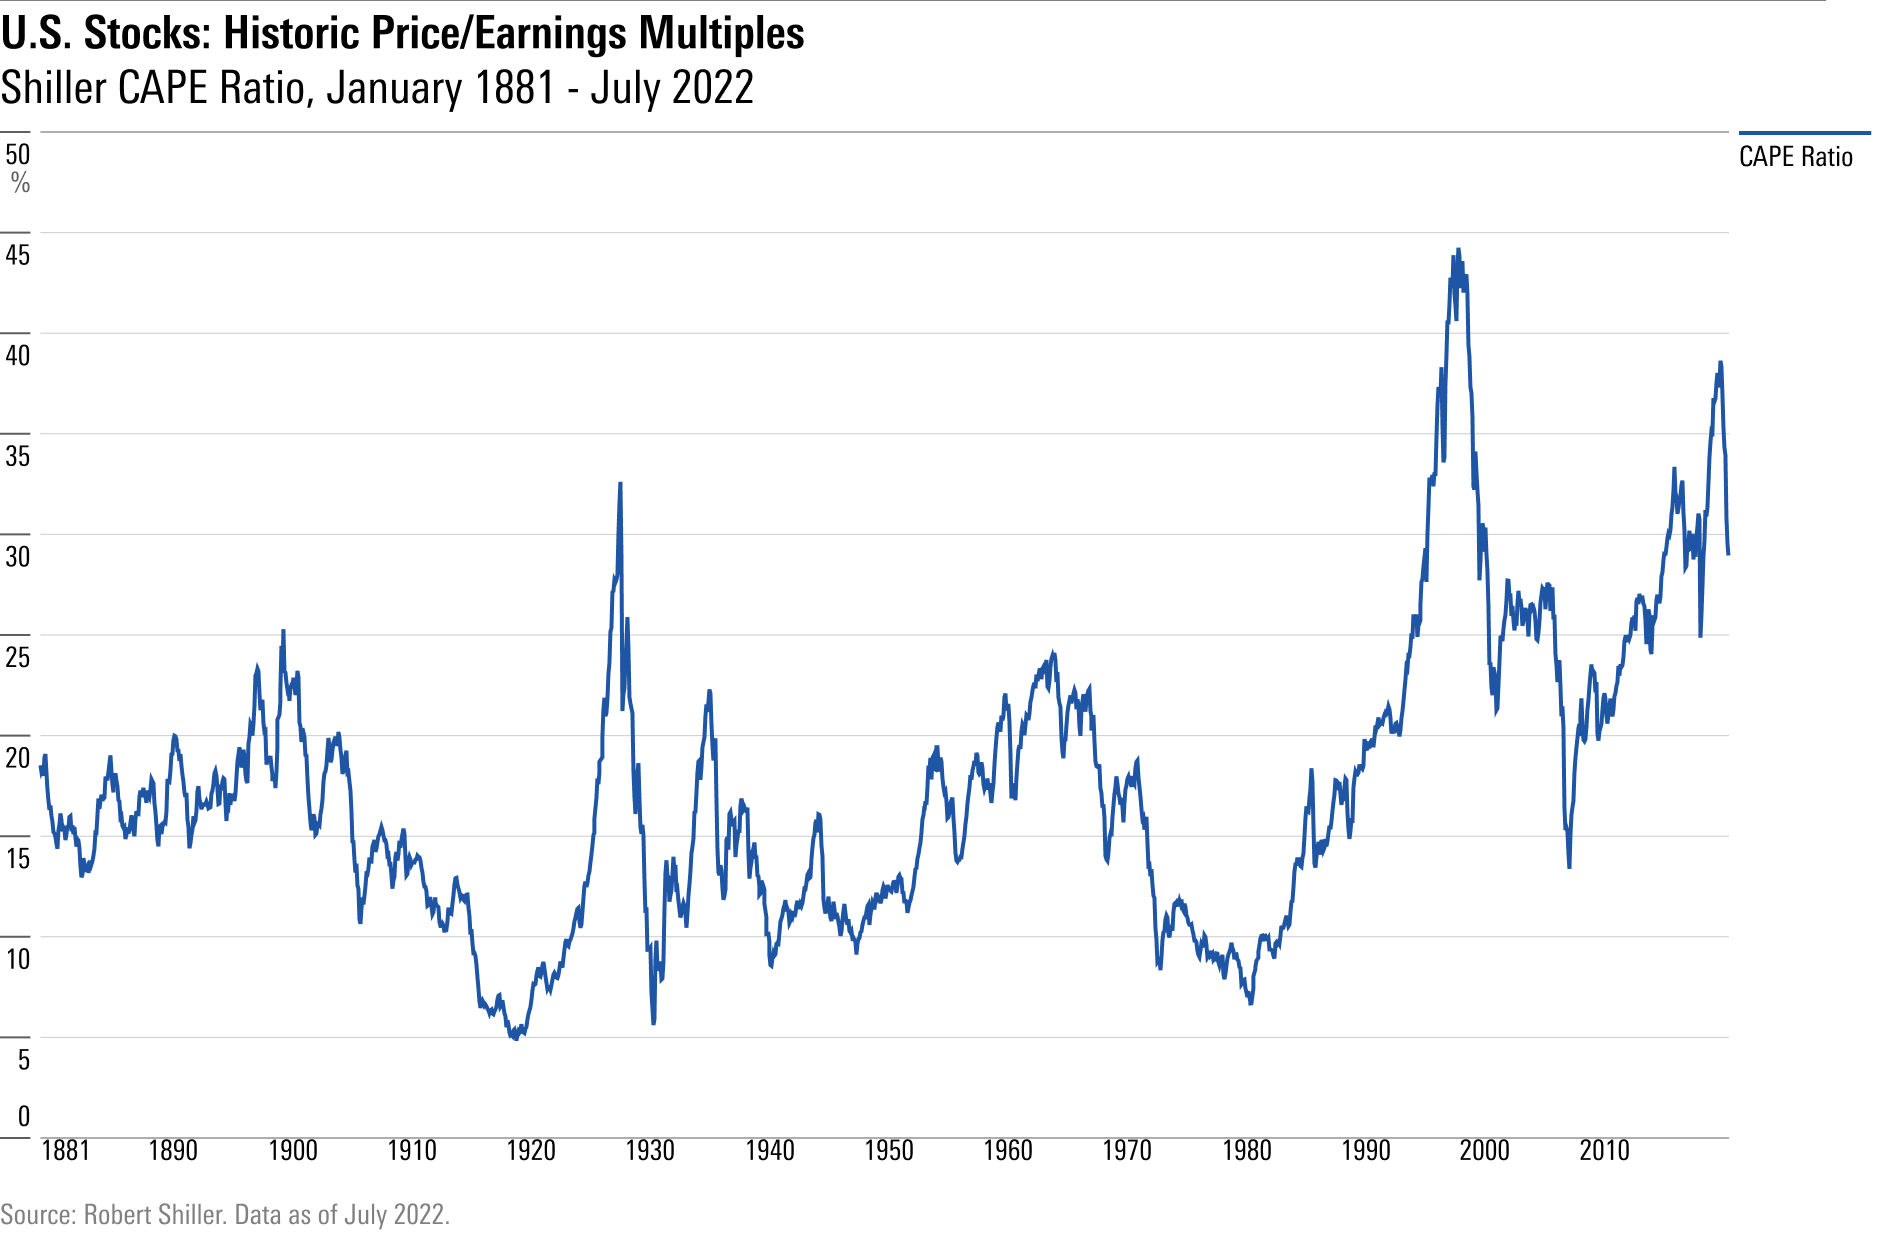
The best starting point for evaluating equity valuations, I believe, is the Shiller CAPE ratio: It computes the market’s price/earnings ratio, but using an average of the past 10 years’ corporate earnings (adjusted for inflation) rather than 12-month results, per the usual custom. Doing so reduces cyclical effects so that P/E ratios are not inevitably high during economic slumps and low at peaks.
(Some researchers prefer using price/book ratios to judge equities’ attractiveness, but that approach is inherently flawed, because sectors with companies that possess relatively high P/B ratios, such as technology, communications, and healthcare, have substantially grown their share of the overall stock market. Thus, today’s P/B values cannot be usefully compared against those of the past, not without adjusting for the shift in industry weights.)
Professor Robert Shiller, the CAPE ratio’s inventor (you may have guessed that), provides the statistic for 150 years of U.S. stock market data.
Modern Times
Broadly speaking, the ratio has had two lives. Before 1990, the CAPE ratio exceeded 25 only briefly, during the 1920s. Over the past three decades, however, the ratio has spent more time than not above that mark. My take is that until 1990 (give or take), U.S. stocks were regarded as riskier than they now are, and therefore commanded lower price multiples. CAPE ratios from before that time are thus unhelpful for assessing current conditions.
But we can potentially learn from more recent history. The next chart discards the first 121 years of the CAPE ratio’s results, retaining instead only the trailing 30-year period. This provides a reasonable backdrop for reviewing the level of current stock prices, after equities have absorbed their year-to-date beating.
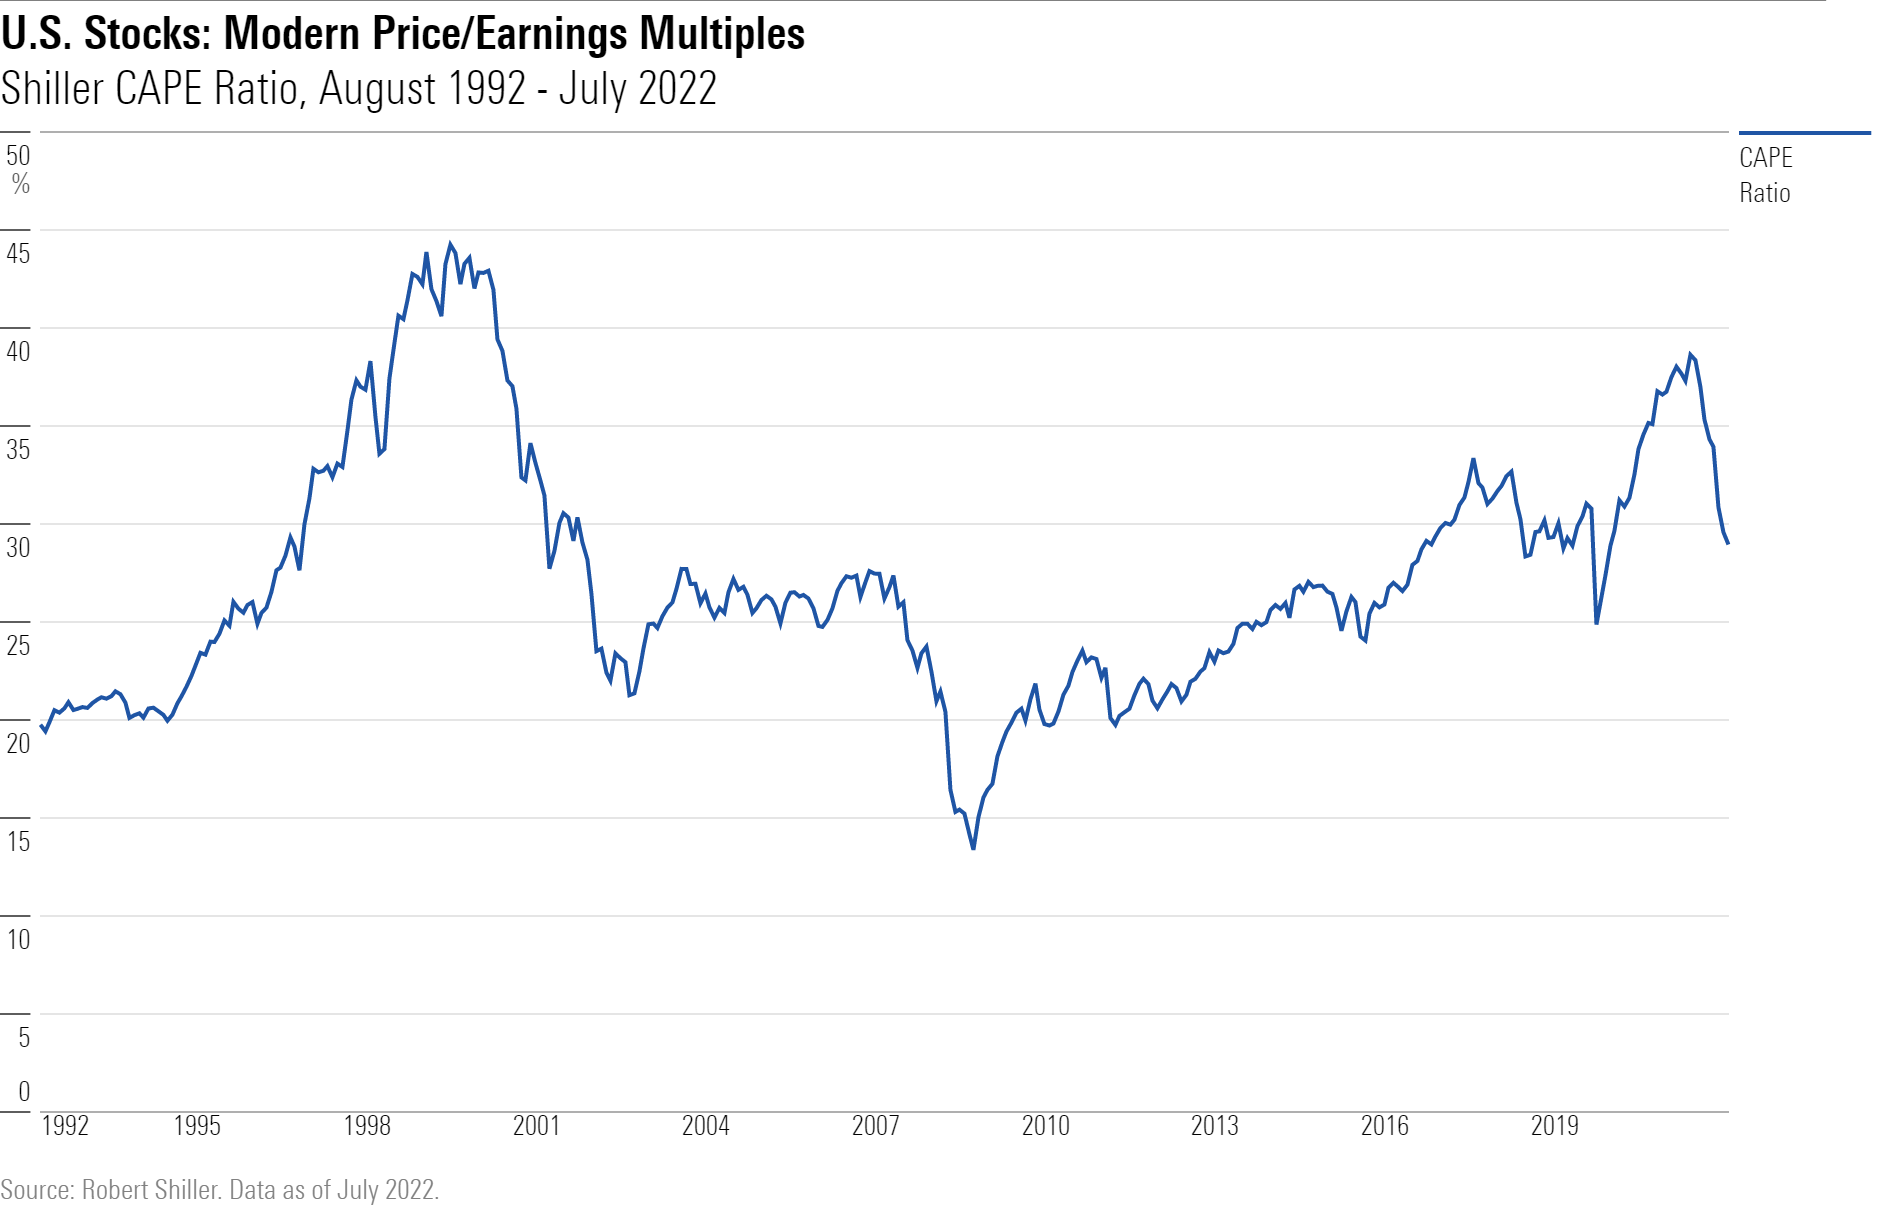
The chart shows equity prices to be moderately steep. They were higher before and after the stock market’s early-2000 crest, slightly lower through the mid-2000s, and roughly at the current level since the Trump administration. Today’s CAPE ratio certainly does not rate as a buy sign, but it is not an outright sell, either.
Considering Interest Rates
This gauge is incomplete, though, because it ignores interest rates. As this year’s marketplace has painfully confirmed, stock prices respond not only to earnings reports—which have been respectable, if not enthralling—but also to the competition from bonds. All things being equal, stocks are worth more when U.S. Treasuries yield 2% than when they yield 5%. In the first case, a slow-growing company that trades at 25 times earnings is acceptably priced. In the second, it is not.
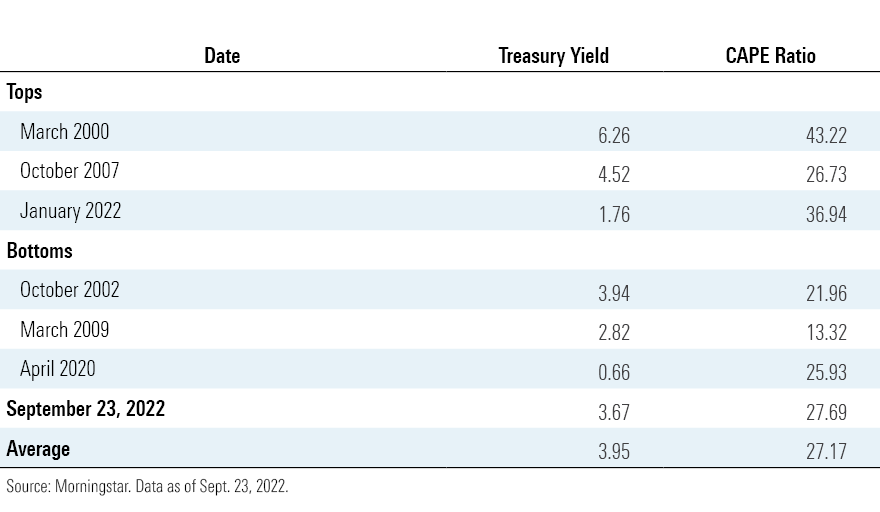
To improve the perspective, therefore, I added the prevailing yields on 10-year Treasuries. The following scatterplot depicts the stock market’s Shiller CAPE ratio and the bond market’s 10-year Treasury yield for six periods, three of which represented stock market tops and three of which proved to be market bottoms. (See the end of this column for the specific dates and values.)
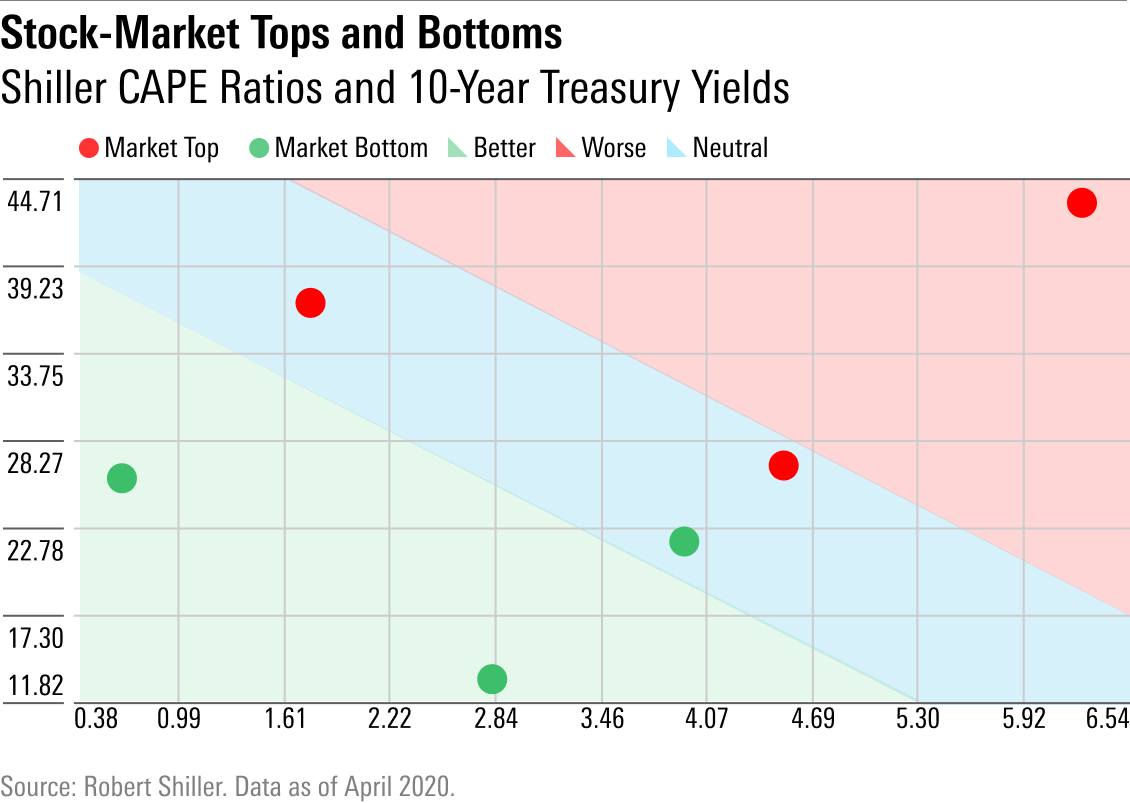
The shading depicts stocks’ relative costs. The red background shows the danger area, where both the CAPE ratios and 10-year Treasury yields are high; the green the safety zone; and the blue neutral territory. Two of the three market bottoms occurred when prices were well within the safety zone, while one of the three tops placed in the danger area. The remaining three dots land near the middle.
In other words, the combination of CAPE ratios and Treasury yields are useful but imperfect guides. They do not mislead: At no time (either with the handful of months that I plotted or the many that I did not) does a dot strongly indicate that stocks are either costly or cheap, and yet the market subsequently heads in the opposite direction over the long term. However, many results are indeterminate. When stock prices occupy neutral ground, the outcome can go either way.
Today’s Values: The Verdict
That, in fact, describes current conditions. This column’s fourth and final exhibit repeats the previous chart, while adding two additional points: 1) the current CAPE ratio and 10-year Treasury yield (as of Friday, Sept. 23), shown in dark blue; and 2) the 30-year averages, depicted in light blue. The two dots land almost atop each other, smack in the middle of the illustration.
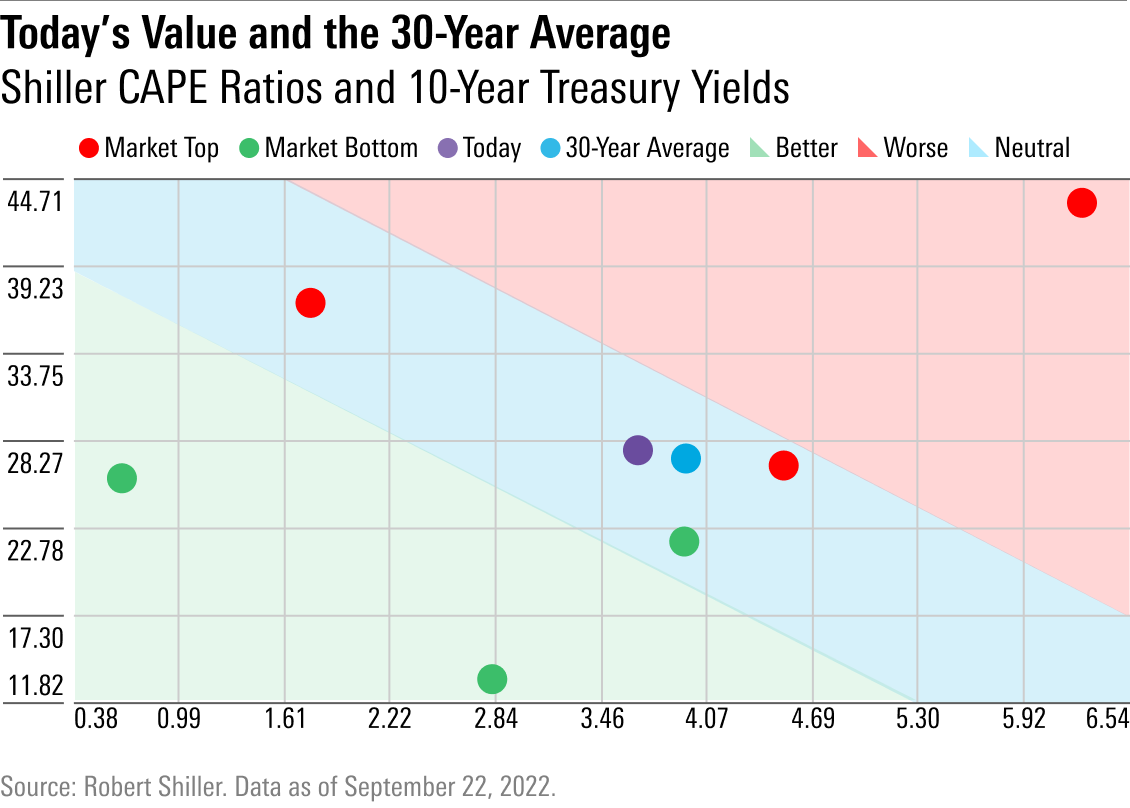
In other words, anything might go. The bright side is that current valuations are close to the 30-year norm, and stocks have performed splendidly over the ensuing three decades. Less happily, today’s prices closely resemble those of the adjoining red dot, representing October 2007, after which stocks shed half their value(!)
My conclusion: Today’s stock prices are nowhere near cheap enough to forestall further losses, should the economic news worsen. If the Federal Reserve is still raising interest rates early into next year, and/or corporate earnings head firmly south, then equities will take a further beating. If, however, the economy avoids those problems, then stocks figure to rally. As the 30-year averages show, equities can profit handsomely at these levels—assuming the economy plays its part.
End Note
Here are the dates and values for each dot.
Correction: Exhibit 4 was reinserted with corrected labels.
The opinions expressed here are the author’s. Morningstar values diversity of thought and publishes a broad range of viewpoints.
The author or authors do not own shares in any securities mentioned in this article. Find out about Morningstar’s editorial policies.
/cloudfront-us-east-1.images.arcpublishing.com/morningstar/F2S5UYTO5JG4FOO3S7LPAAIGO4.jpg)
/cloudfront-us-east-1.images.arcpublishing.com/morningstar/7TFN7NDQ5ZHI3PCISRCSC75K5U.png)
/cloudfront-us-east-1.images.arcpublishing.com/morningstar/QFQHXAHS7NCLFPIIBXZZZWXMXA.jpg)
:quality(80)/s3.amazonaws.com/arc-authors/morningstar/1aafbfcc-e9cb-40cc-afaa-43cada43a932.jpg)