
What's Inside the 4 Largest Clean Energy ETFs
There's much more to these funds than meets the eye.
/s3.amazonaws.com/arc-authors/morningstar/c00554e5-8c4c-4ca5-afc8-d2630eab0b0a.jpg)
A slew of stakeholders from around the globe recently gathered at the COP26 global climate summit with a renewed sense of urgency to advance the transition toward a more climate-friendly economy. In our April 2021 report "Investing in Times of Climate Change", we outlined the different approaches that asset managers have taken to address this issue, which range from decarbonizing portfolios to building ones aimed at investing in green solutions.
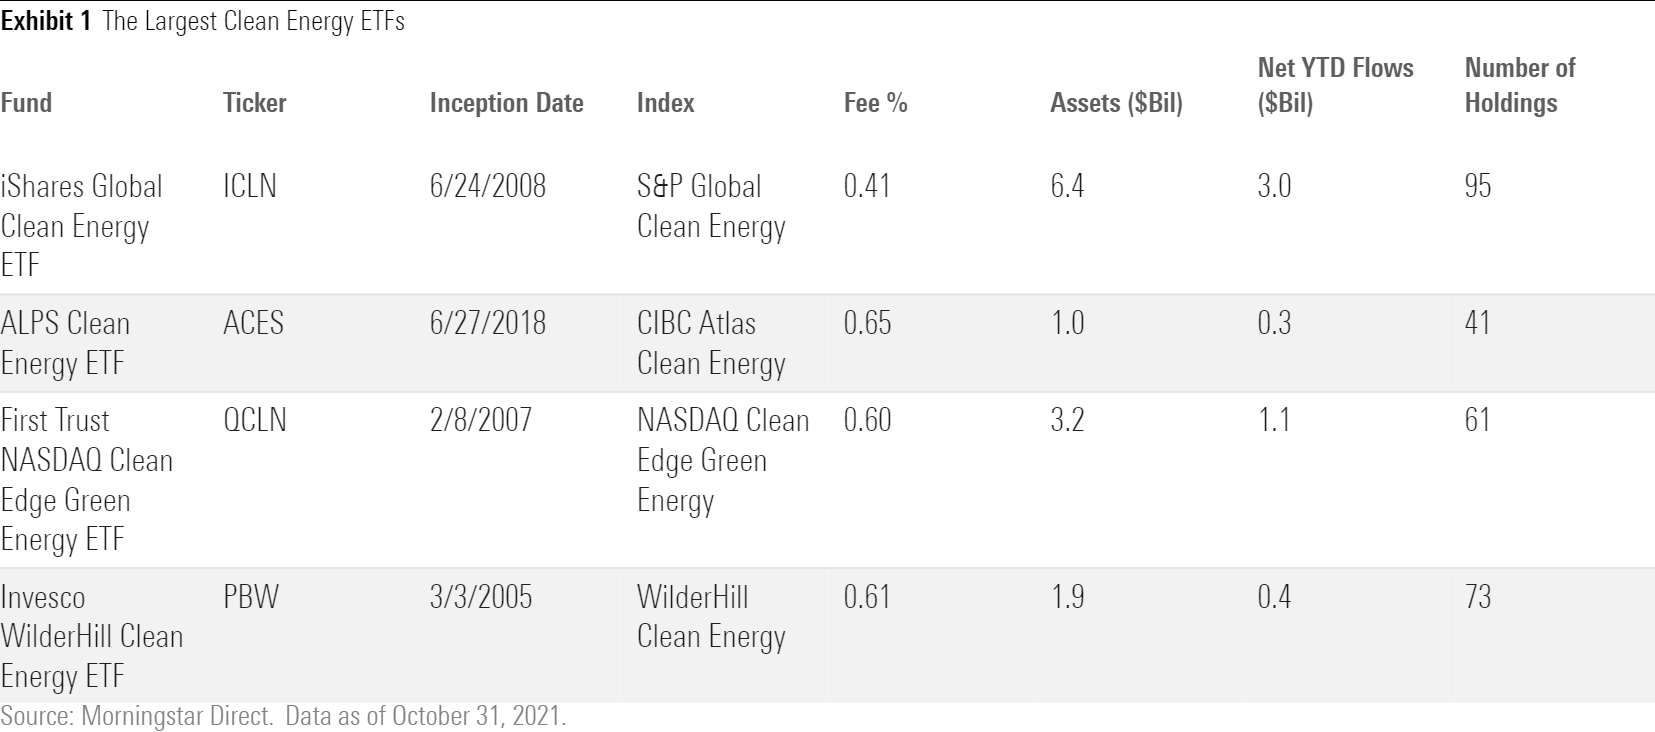
To date, investors appear most interested in investing in green solutions. Specifically, clean energy funds have enjoyed the highest inflows of any subcategory of climate-aware funds over the past two years. They currently claim a major slice of market share in the climate funds space. Here, I will take a close look at the four largest clean energy ETFs available in the United States, featured in Exhibit 1.
Indexing Clean Energy
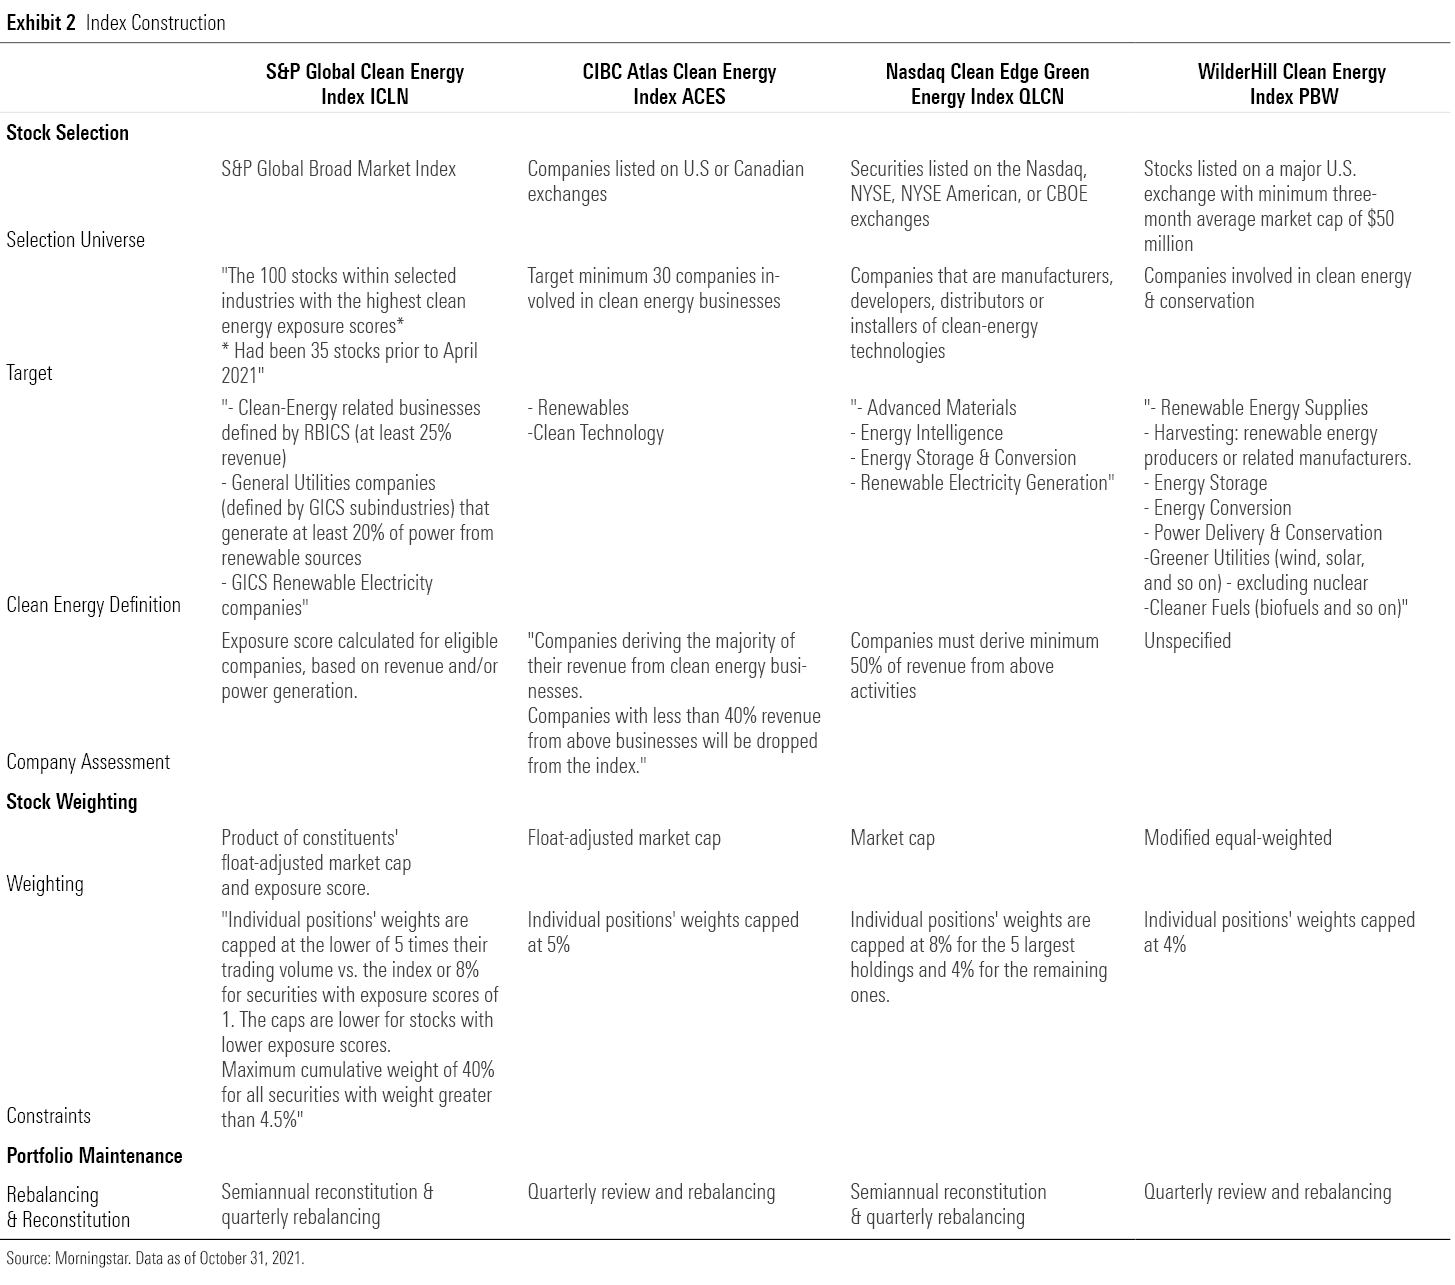
At face value, these four seem awfully similar. But their underlying indexes can have very different approaches to defining clean energy and determining which stocks qualify for inclusion. Exhibit 2 lays out the index construction process for the benchmarks underpinning each fund
What Counts as “Clean Energy”?
There are many different definitions of clean energy. The definitions employed by clean energy indexes can vary widely. Some only include clean energy providers. Some get granular and focus on a single source of renewable energy, such as solar or wind. Others are more expansive and include ancillary businesses that indirectly profit from the clean energy transition.
These definitional divergences become clear when digging into the details of these funds’ indexes’ methodologies. For example, iShares Global Clean Energy ETF’s ICLN index, the S&P Global Clean Energy Index, focuses on renewable energy providers: wholesale power companies or utilities providers that get at least 20% of their power from renewable sources. On the other hand, the Nasdaq Clean Edge Green Energy and WilderHill Clean Energy indexes, which underpin First Trust Nasdaq Clean Edge Green Energy ETF QCLN and Invesco WilderHill Clean Energy ETF PBW, respectively, include ancillary businesses such as energy storage and conversion companies. These firms might not be directly generating clean energy, but their products and services can help deliver clean power to consumers. Meanwhile, ALPS Clean Energy ETF’s ACES bogy, the CIBC Atlas Clean Energy Index, provides a fairly broad, generic definition of its clean energy inclusion criteria. But based on the makeup of its portfolio, it seems to follow a similar approach to PBW and QCLN.
Which Stocks Make the Cut?
The indexes behind ACES, ICLN, and QCLN use a revenue threshold to determine which stocks are sufficiently clean to make the cut. PBW’s index does not disclose specific criteria for what counts as clean energy.
ICLN’s index sweeps in all companies from the initial clean energy universe that generate more than 75% of their revenue from clean energy. It lowers this threshold in 25-percentage-point increments until it reaches its 100 constituent count target, but will not hold any stocks that generate less than 25% of their sales from clean energy. QCLN and ACES both screen for companies deriving a majority of their revenues from clean energy businesses.
ACES and QCLN weight stocks based on their market cap. ICLN assigns weights based on the product of stocks’ market cap and an energy exposure score, which corresponds to the revenue thresholds mentioned above. The more revenue generated from clean energy, the higher stocks’ exposure score and greater weight in ICLN’s portfolio. PBW is the only fund in the group employing equal weighting. To avoid capacity issues, the minority of PBW’s constituents with less than $200 million in market cap receive an equal weight of 0.5%. The rest of the holdings receive an equal share of their respective sector weights, which are determined by the index provider.
While these indexes are all rules-based, it’s difficult to visualize the complexion of their portfolios just by reading these rules, especially in light of their varying definitions of clean energy. Indexing this evolving space means making active decisions regarding definitions and stocks’ clean energy bona fides. A peek at their portfolios can help illuminate how these important definitional decisions shake out.
You’ve Got to Know What They're Holding
Exhibit 3 features each of the four funds’ top 10 holdings. ICLN’s top holdings reflects its pure play-focused construction process. As of October 2021, around 43% of its assets were invested in utilities, many of which are strictly renewable energy providers like Orsted A/S ORSTED and EDP SA EDP. Although it also includes clean technology stocks, the majority of ACES’ top holdings are solar power players or utilities that specialize in renewable energy. ICLN also holds most of the renewable utilities companies on ACES’ list, like Brookfield Renewable Partners BEP and Northland Power NPI. However, its global remit sweeps in and assigns more weight to larger renewable energy providers in Europe, which has a much more advanced green energy market compared with the U.S.
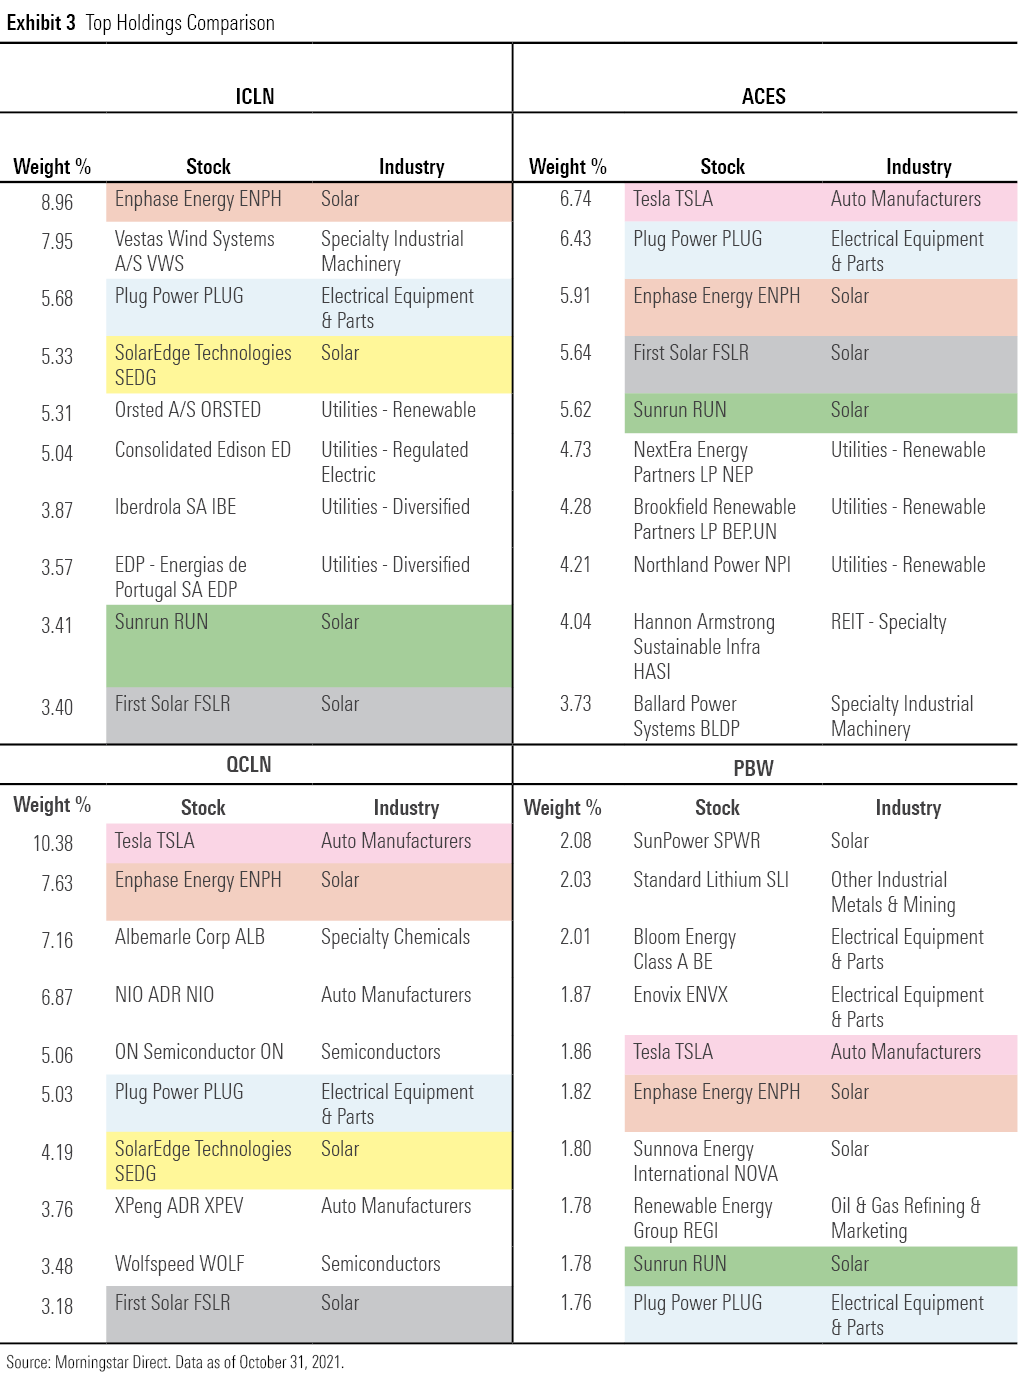
On the other hand, QCLN and PBW’s top holdings feature a more eclectic mix of energy providers and energy solutions companies. Three out of QCLN’s top 10 holdings are electric vehicle manufacturers (Tesla TSLA, NIO Inc NIO, and XPeng XPEV), while four out of PBW’s top 10 directly manufacture batteries and/or fuel cells, or provide raw materials for the process (Standard Lithium SLI, Bloom Energy BE, Enovix ENVX, and Plug Power PLUG). While these firms will benefit significantly from the shift to renewable energy, they aren’t entirely dependent on it. As such, they can offer some diversification benefit compared with holding renewable energy providers exclusively.
Unsurprisingly, Tesla claims a top spot in all three funds that include ancillary clean energy businesses. As Tesla’s share price has soared in recent years, so has the stock’s prominence in their portfolios.
How Clean Is Clean?
One of the more interesting findings from our April analysis of climate-aware funds was that many clean energy funds have significant fossil-fuels exposure. While at first blush this finding might seem counterintuitive, recall that Exhibit 3 showed the prevalence of energy providers in these funds’ portfolios. While many are leading the clean-energy transition, they are still in the process of weaning themselves off fossil fuels and may still generate 10%-50% of their revenues from these sources.
Exhibit 4 shows the percentage of each fund invested in companies with fossil-fuels exposure as well as the portion invested in companies providing carbon solutions. Revenue from fossil fuels (thermal coal or oil & gas) production and power generation will be counted toward the funds’ fossil-fuels exposure. On the other hand, those sales stemming from renewable energy production and ancillary services, energy efficiency, and green infrastructure and transportation will be counted toward carbon solutions exposure. For the sake of comparison, I’ve also included the data for SPDR S&P 500 Fossil Fuel Reserves Free ETF SPYX, which holds only S&P 500 companies without any fossil-fuel reserves. In general, the higher these funds’ exposure to carbon solutions, the higher their exposure to fossil fuels.
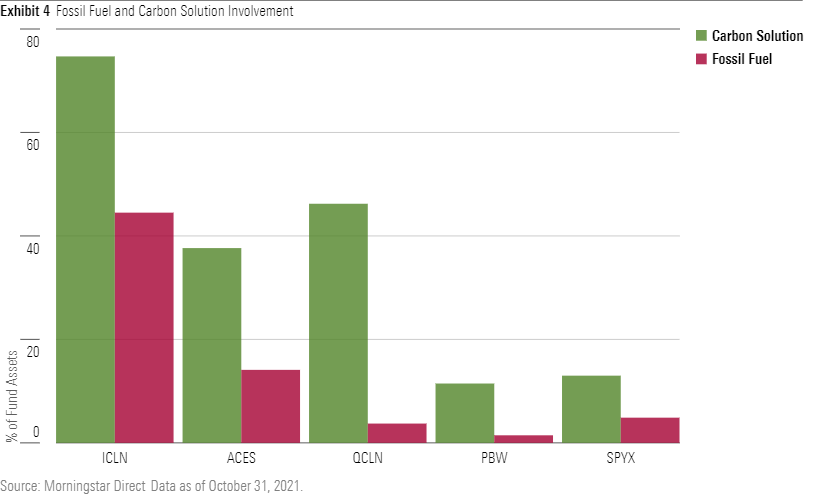
ICLN simultaneously has the highest exposure to companies providing carbon solutions and companies involved in fossil-fuel generation, production, or ancillary services. This can partly be attributed to the changes its index implemented in April 2021. This included expanding the index’s scope and adjusting its ESG screening criteria. The index went from 30 holdings to approximately 100, which also necessitated the inclusion of companies generating less than 75% of their revenue from clean energy businesses. These changes aimed to address concentration and liquidity concerns, especially given that the fund’s assets had mushroomed, growing more than tenfold over the 12 months before its index methodology was modified. But these modifications to its benchmark also left the fund holding bigger positions in more-traditional energy providers such as Iberdrola SA IBE and Consolidated Edison ED.
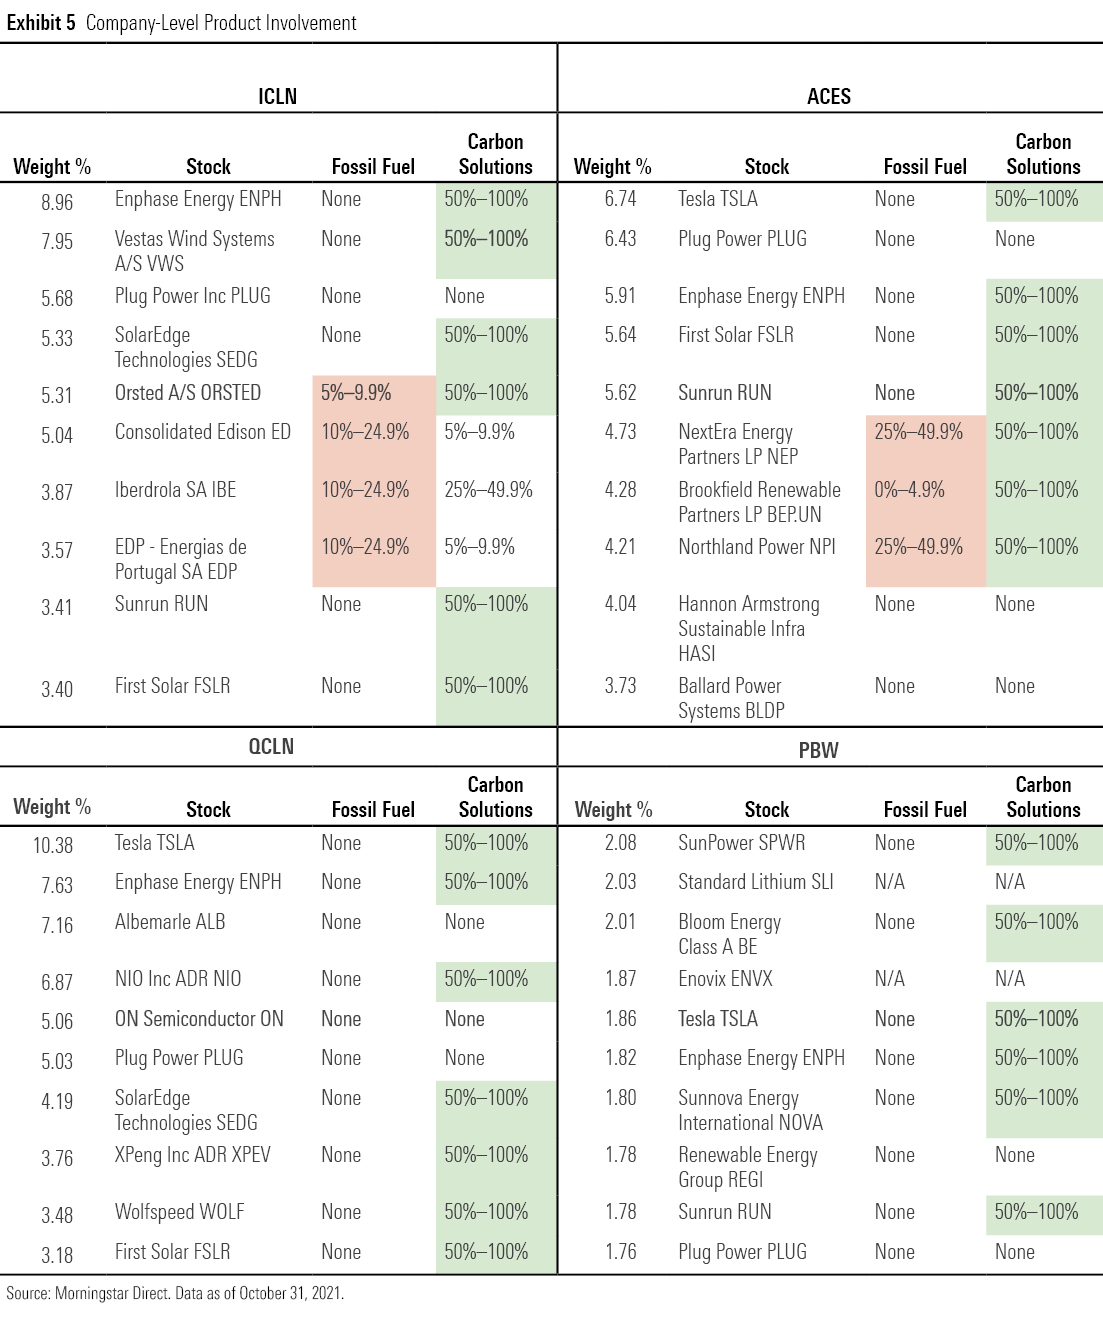
Exhibit 5 shows the company-level product involvement of the top 10 holdings for each fund. ACES runs into a similar issue as ICLN, as some of its top holdings are power producers that are involved in both renewable and traditional energy generation, such as Northland Power and NextEra Energy Partners NEP.
Both QCLN and PBW currently have no fossil-fuels exposure among their top 10 holdings and low exposure overall. This is partly because of their broader scope. Including related clean energy businesses allows them to avoid owning power providers with higher fossil-fuels exposure. QCLN also stands out as it allocates more of its assets to companies providing carbon solutions than PBW, although this might be partly attributable to a lack of data from smaller holdings in PBW’s portfolio.
What Fuels Success?
Unsurprisingly, these funds’ performance does not track closely with a broad energy benchmark. Their correlation to the Morningstar Global Energy and Morningstar U.S. Energy indexes ranged between 0.50 and 0.60 over the trailing three years ending October 2021. These funds all lagged these traditional energy benchmarks as well as the broad U.S. market earlier this year as oil prices spiked and energy stocks rallied.
The funds have actually exhibited higher correlations to the technology sector. Their correlations to the Morningstar Global Technology and Morningstar U.S. Technology indexes ranged between 0.65 and 0.80 over the past three years.
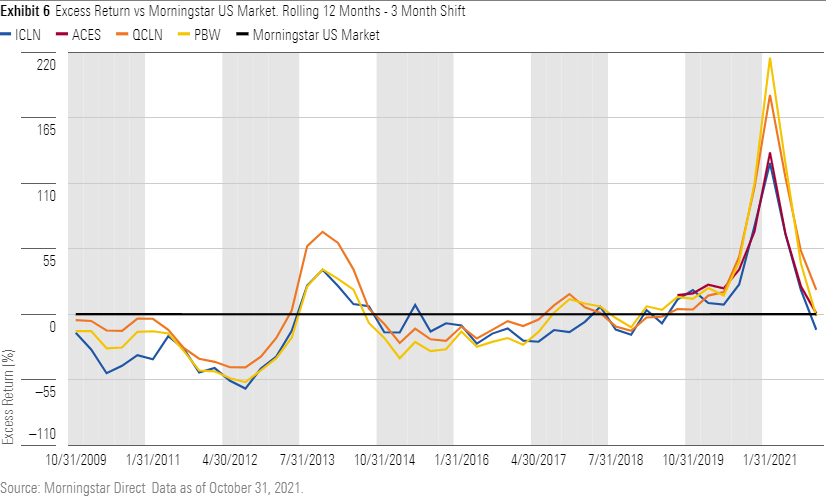
Exhibit 6 shows the funds’ excess returns as measured against the Morningstar U.S. Market Index over rolling 12-month periods. Much of their recent excess returns can be attributed to outperformance from a few names during 2020, most notably Plug Power, NIO, Tesla, and Enphase Energy ENPH. This dependence on stock selection can provide outsize returns--positive and negative. A quick glance at Exhibit 6 makes clear that these funds have been much more volatile than the broader market.
Overall, clean energy funds aren’t necessarily the cleanest, but they do tend to feature the firms that might be best-positioned to benefit from decarbonization. As there is no consensus on what exactly qualifies as clean energy, the many approaches to indexing this space still require deep due diligence on the part of fund investors.
Disclosure: Morningstar, Inc. licenses indexes to financial institutions as the tracking indexes for investable products, such as exchange-traded funds, sponsored by the financial institution. The license fee for such use is paid by the sponsoring financial institution based mainly on the total assets of the investable product. Please click here for a list of investable products that track or have tracked a Morningstar index. Morningstar, Inc. does not market, sell, or make any representations regarding the advisability of investing in any investable product that tracks a Morningstar index.
/cloudfront-us-east-1.images.arcpublishing.com/morningstar/OMVK3XQEVFDRHGPHSQPIBDENQE.jpg)
:quality(80)/s3.amazonaws.com/arc-authors/morningstar/c00554e5-8c4c-4ca5-afc8-d2630eab0b0a.jpg)