
Flows Into ETFs Hold Steady as Markets Wobble in August
ETF investors weren't deterred by another down month for stocks and bonds.
/s3.amazonaws.com/arc-authors/morningstar/30e2fda6-bf21-4e54-9e50-831a2bcccd80.jpg)

After a stellar July offered hope that the worst was in the rearview mirror, stock and bond markets took a step back in August. The Morningstar Global Markets Index, a broad benchmark of global equities, declined 3.53% in August, its sixth down month this calendar year. Both domestic and international stocks retreated. U.S. stocks made a sharp U-turn after Federal Reserve Chairman Jerome Powell reinforced his commitment to rein in inflation, and overseas markets continued to wrestle with persistent inflation of their own. Bonds did not fare much better, as the Morningstar US Core Bond Index shed 2.77% of its value.
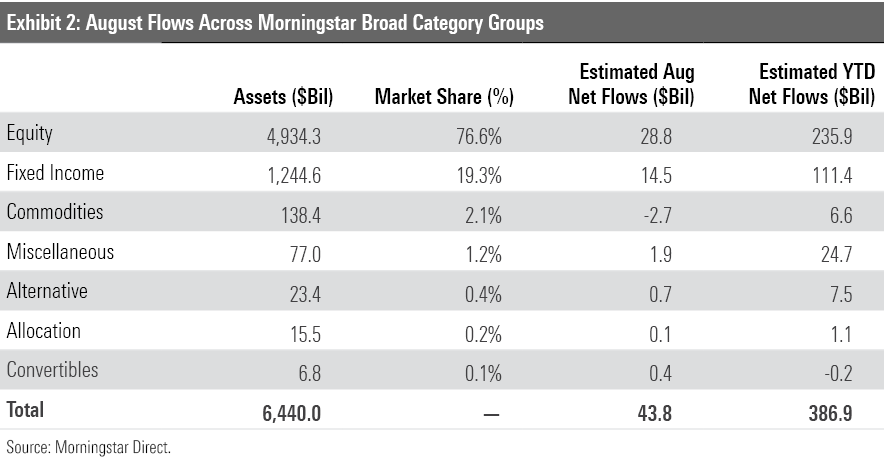
Weak performance did not shake exchange-traded fund investors’ confidence. ETFs hauled in $43.8 billion of new money in August, slightly below their monthly average inflow so far this year. Stock ETFs collected $28.8 billion as investors stuck to U.S.-based, broadly diversified index funds. Bond ETFs continued their steady if not eye-popping year with a $14.5 billion August inflow. Two thirds of the way through 2022, U.S. ETFs have absorbed $386.9 billion of new money.
Here, we’ll take a closer look at how the major asset classes performed last month, where investors put their money, and which corners of the market look rich and undervalued at month’s end—all through the lens of ETFs.
Shades of Red
Exhibit 1 shows August returns for a sample of Morningstar Analyst-rated ETFs that serve as proxies for major asset classes. A blended global portfolio retreated 3.71% last month.
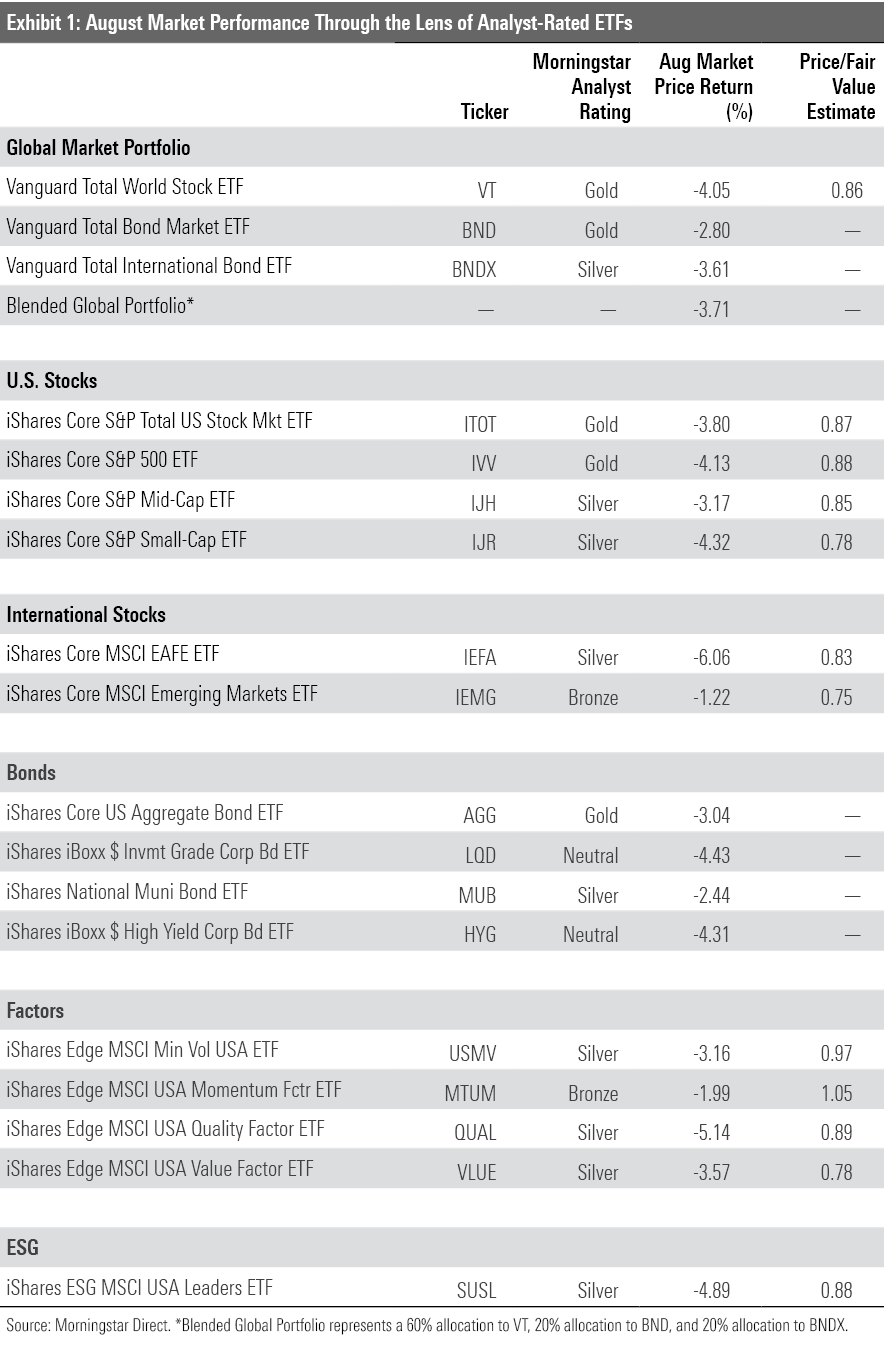
The portfolio's bond sleeve offered little stability. Vanguard Total Bond Market ETF BND and Vanguard Total International Bond ETF BNDX followed strong July returns with declines of 2.8% and 3.61%, respectively. Bond investors that embraced interest-rate risk were too quick on the draw. Inflation in the eurozone reached a fresh record in August, and Powell's hawkish comments diminished investors' confidence that the Fed would reverse course and cut interest rates early in 2023. Renewed interest-rate concerns caused more pain for long-term bond portfolios than shorter-dated ones. Vanguard Long-Term Bond ETF BLV declined 5.29% last month, while Vanguard Short-Term Bond ETF BSV cut its loss to 1.33%.
Vanguard Total World Stock ETF VT—the lone tentpole of the blended portfolio’s stock sleeve—shed 4.05% in August. It has now lost at least 4% in half the months this year. International stocks weighed on returns. Vanguard Total International Stock ETF VXUS retreated 4.49% in August as developed-market equities took a beating. IShares MSCI EAFE ETF EFA wiped out its 5.17% July gain with a 6.12% decline last month. VXUS has European stocks to blame. Morningstar indexes that track markets in the United Kingdom, France, Switzerland, Netherlands, and Germany all pulled back between 5% and 10%. Japanese firms—the fund’s heftiest country allocation—held up better but couldn’t provide ballast for the portfolio, as they too finished in the red.
Emerging-markets stocks held up better than their developed peers in August. Solid contributions from Brazilian and Indian stocks—as well as avoiding most of the eurozone —helped limit iShares Core MSCI Emerging Market ETF’s IEMG August loss to 1.22%.
U.S. stocks—which constitute nearly one-fourth of the blended portfolio—did little to help the cause. July’s positive momentum initially spilled into August; iShares Core S&P Total U.S. Stock Market ETF ITOT was up as much as 4.7% toward the middle of the month. But the Fed’s stern tone swiftly let the air out of the market. ITOT moved in reverse all four trading days since Powell’s Aug. 26 remarks, eventually finishing the month 3.8% lower than where it started. That pulled its year-to-date drawdown to 17.18%, the fund’s worst eight-month stretch since 2008-09.
Some themes that characterized the market in the first half of 2022 returned from an early-summer hiatus in August. For example, energy and utilities stocks, the two best-performing sectors from January through June, were the only sectors to finish August in the black. Energy Select Sector SPDR ETF XLE and Utilities Select Sector SPDR ETF XLU climbed 2.65% and 0.53%, respectively. Crude oil prices wobbled last month, but soaring natural gas prices took up the mantle and pushed XLE ahead. Marathon Petroleum MPC and ConocoPhillips COP, a pair of firms that derive a healthy chunk of their revenue from natural gas operations, both cracked double-digit August returns. After another positive month, XLE has leapt 47.94% for the year to date through August, over 40 percentage points more than the next-closest sector ETF in the SPDR suite, XLU (5.37%).
ETFs that tap another source of energy—uranium—also posted excellent returns last month. Sprott Uranium Miners ETF URNM, a cap-weighted portfolio of firms that derive at least half their revenue from uranium-related operations, advanced 11.33% in August. Uranium stocks surged last month when Japan announced plans to restart idled nuclear reactors and build additional ones. Several European countries followed suit with similar measures shortly after. As economies seek alternatives to fossil fuels and a European power crisis looms, nuclear energy has emerged as a viable option. Time will tell whether uranium stocks continue to benefit.
In the return of another first-half market theme, value stocks held up better than their growthier peers in August. Vanguard Value ETF VTV shed 2.68% last month, while its counterpart Vanguard Growth ETF VUG lost an even 5%. Growth stocks tend to respond more acutely to shifts in interest-rate outlooks because their anticipated cash flows are further in the future. Indeed, VUG tumbled 6.65% in the four trading days that followed the Fed’s remarks. Growth-oriented stocks like Nvidia NVDA, Salesforce CRM, and Zoom Video Communications ZM all shed north of 15% for the month. Stocks in statistically cheaper sectors held up better. Consumer staples stocks’ sturdy nature served them well, and resilient performance from investment banks like Morgan Stanley MS and Goldman Sachs GS kept the financials sector afloat.
Another difficult month in the markets means stock ETFs look undervalued across the board. As measured by the Morningstar price/fair value ratio, ITOT traded at a 13% discount. Using the ETFs in Exhibit 1 as proxies, the best value resided in emerging-markets (25% undervalued), small-cap (22%), and value stocks (22%) and the end of August.
Home Cooking
U.S. ETFs welcomed $43.8 billion of new money in August. Stock ETFs rebounded from a quiet July with a $28.8 billion inflow, and bond ETFs collected $14.5 billion.
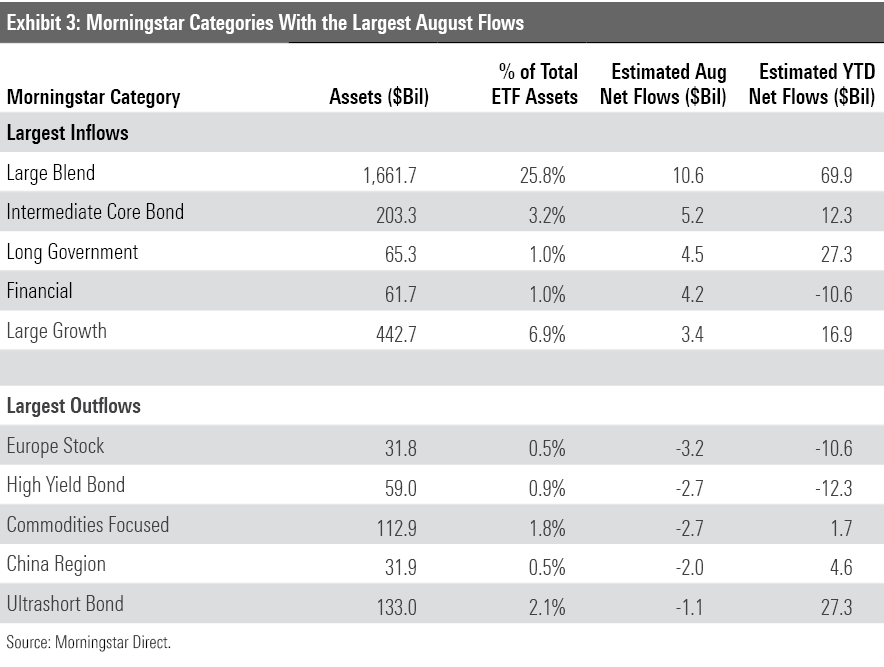
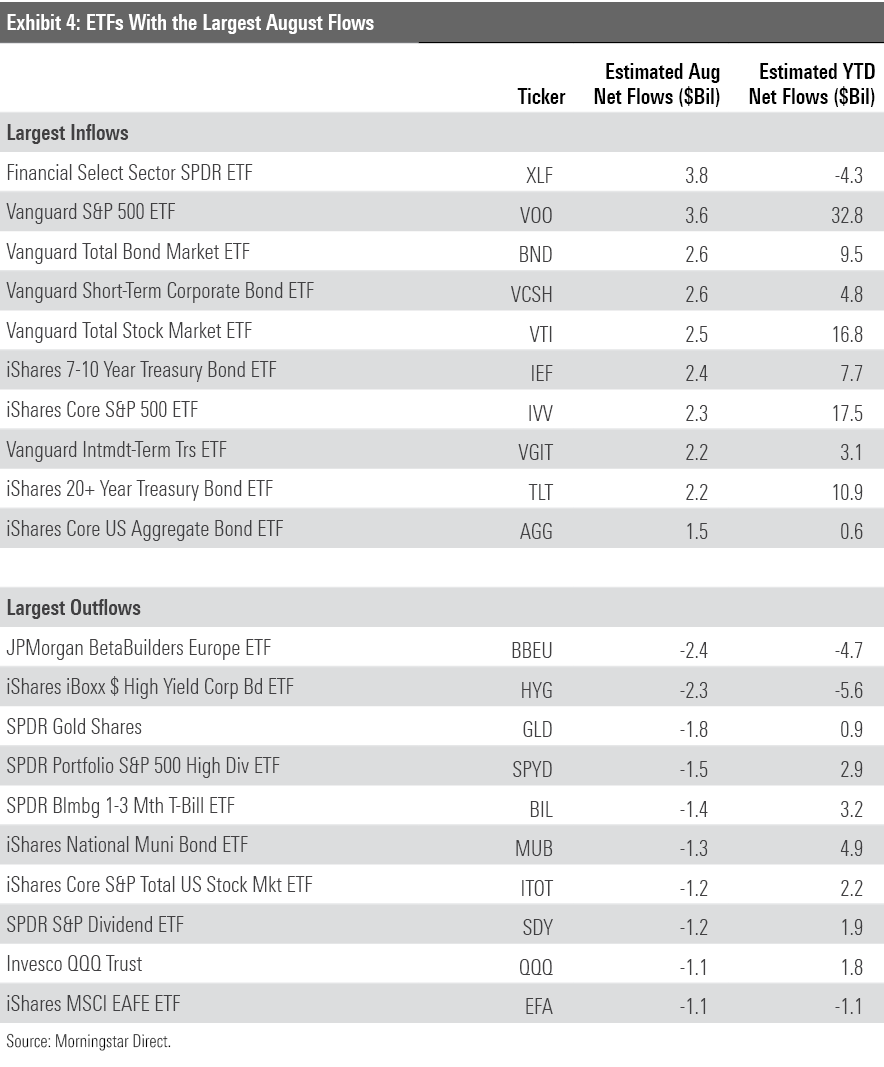
ETF investors dusted off a familiar playbook last month, plowing into the U.S. large blend and intermediate core bond Morningstar Categories, the largest stock and bond categories. The usual suspects led the way in the large-blend space. Cheap, broad-market funds like Vanguard S&P 500 ETF VOO ($3.6 billion inflow), Vanguard Total Stock Market ETF VTI ($2.6 billion), and iShares Core S&P 500 ETF IVV ($2.3 billion) led the charge. Each of these funds has accumulated solid inflows over the year’s first two trimesters, though not all hefty broad-market index funds can say the same. SPDR S&P 500 ETF Trust SPY—the most notorious of the bunch—has bled $20.9 billion for the year to date, even after adding $429 million in August. Differences in investor ethos likely explain the difference. Vanguard clients tend to be strategic, long-term investors, while State Street’s investor base tends to be more tactical.
While the tried-and-true index funds headlined August flows, some investors opted for an unconventional tack. ETFs in the nontraditional equity U.S. category group landed $2.3 billion of new money last month. These funds have collected $13.9 billion on the year, which exceeds the $12.7 billion annual flow record they set in 2021. Nearly all that investment has funneled into the derivative income category, which includes 16 funds that maintain material stock-market risk but use derivatives to drum up income, like covered-call strategies. JPMorgan Equity Premium Income ETF JEPI has been the standout. After it reeled in $1.3 billion in August, the actively managed fund that finished 2021 with $5.9 billion in assets, stood at $12.4 billion. In a low-yield environment that has not rewarded full-blown stock exposure, JEPI and its peers have broken out.
While U.S. and nontraditional stock funds turned in lucrative flows for August, international-stock funds saw about $645 million leave their doors. foreign large blend, international equities' marquee category, continued its solid year with a $2.7 billion inflow last month. But steep outflows from Europe ($3.2 billion) and China stock ETFs ($2 billion) pulled the international-stock category group into negative territory. Investors yanked $2.4 billion from JPMorgan BetaBuilders Europe BBEU, the most among all ETFs in August. Fundholders may have run out of patience; the MSCI Europe Index that underpins the fund has tumbled 21.5% for the year to date. In China, continued pandemic lockdowns, a crumbling housing market, and this autumn's Communist Party Congress collectively paint an uncertain outlook that may have pushed investors to the sidelines. That said, flows into international-stock funds have punched above their weight. These funds represent about 20% of all stock ETF assets but have accounted for 25% of inflows for the year to date.
While intermediate-core bond funds set the pace in absolute fixed-income flows, the long government category took first place in organic growth, at 7.2%. These funds have pulled in $27.3 billion on the year, a gaudy sum for a category that closed 2021 with less than $50 billion in assets. Investors have welcomed term risk and eschewed credit risk, which creates the perfect storm for these high-duration funds that are backed by the U.S. government. The main beneficiary of this investor appetite, iShares 20+ Year Treasury Bond ETF TLT, absorbed $2.2 billion in August and has now reeled in $10.9 billion in 2022, fifth-most among all ETFs.
On the other end of the yield curve, flows into ultrashort bonds have reversed course. After a white-hot first half that saw these funds rake in $33.6 billion—good for a 32.2% organic growth rate—investors have pulled more than $6 billion from these funds over the past two months. Ultrashort bond funds behave a lot like cash. As markets stabilized in July and August, investors may have migrated toward funds that stand to perform better in bull markets. Should July prove to be a short-lived market rally, ultrashort bond funds could see their popularity return.
Commodities ETFs bled $2.7 billion in August. Flows into these funds took a turn for the worse when investors called off the hunt for inflation antidotes earlier this year. Commodity ETFs hauled in $21.1 billion over the first four months of 2022, only to see about $15 billion of it flood out their doors over the next four. If investors continue to bet that the worst inflation is behind us, these funds may face their second consecutive year of outflows after a promising start.
Bonds Boost Vanguard
The ETF provider monthly flows race usually features two horses: Vanguard or iShares has claimed first place in 32 of the past 36 months. Vanguard took the crown in August, as its $24.2 billion inflow nearly quadrupled its most familiar competitor. Its U.S. stock funds led the way, as has been the case all year. After hauling in $10.6 billion in August, year-to-date flows into those funds stood at $89.3 billion. When Vanguard has finished behind iShares, it’s usually because their fixed-income ETFs haven’t added much. That was not the case in August, as Vanguard’s bond lineup absorbed $10.3 billion, their best month since July 2021.
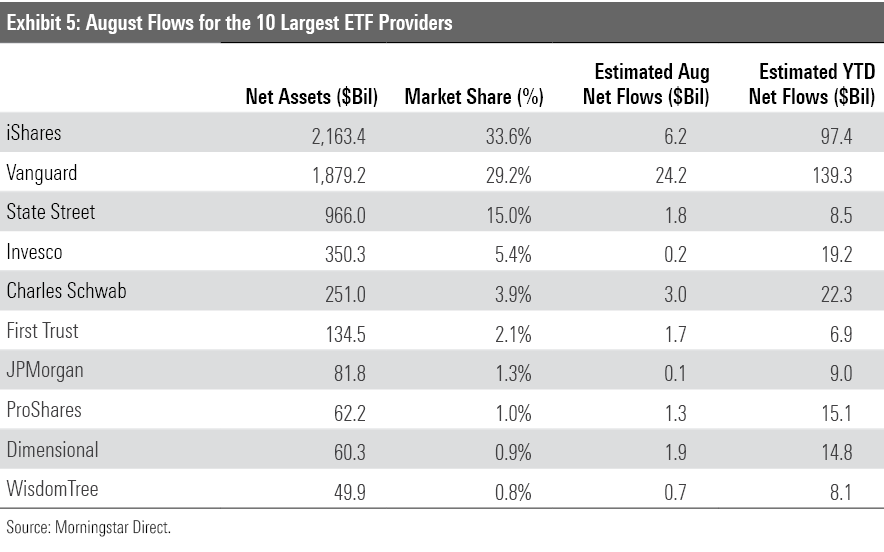
Dimensional continued its solid year with $1.9 billion of inflows in August. Dimensional’s first two thirds of the year has been defined by consistency. None of its 24 ETFs have dominated the marketplace—Dimensional U.S. Core Equity 2 ETF DFAC leads the firm with only a $2.1 billion haul—but none of its ETFs have suffered outflows. This well-rounded effort has offset outflows from Dimensional’s open-end fund lineup and positioned the firm to finish 2022 with annual inflows for the first time since 2019.
JPMorgan had a ho-hum month, pulling in only $51 million in August. It has been an excellent year for the firm, however, and it has its roster of active ETFs to thank. After collecting $2.5 billion in August, those funds have raked in $11.4 billion for the year to date. JEPI has added $7.5 billion over the past eight months to lead the way. Meanwhile, JPMorgan’s passive lineup has endured $2.5 billion of outflows, headlined by the $4.7 billion exodus from BBEU.
Oil and Utilities Don’t Come Cheap
The fair value estimate for ETFs rolls up our equity analysts' fair value estimates for individual stocks and our quantitative fair value estimates for stocks not covered by Morningstar analysts into an aggregate fair value estimate for stock ETF portfolios. Dividing an ETF's market price by this value yields its price/fair value ratio. This ratio can point to potential bargains and areas of the market where valuations are stretched.
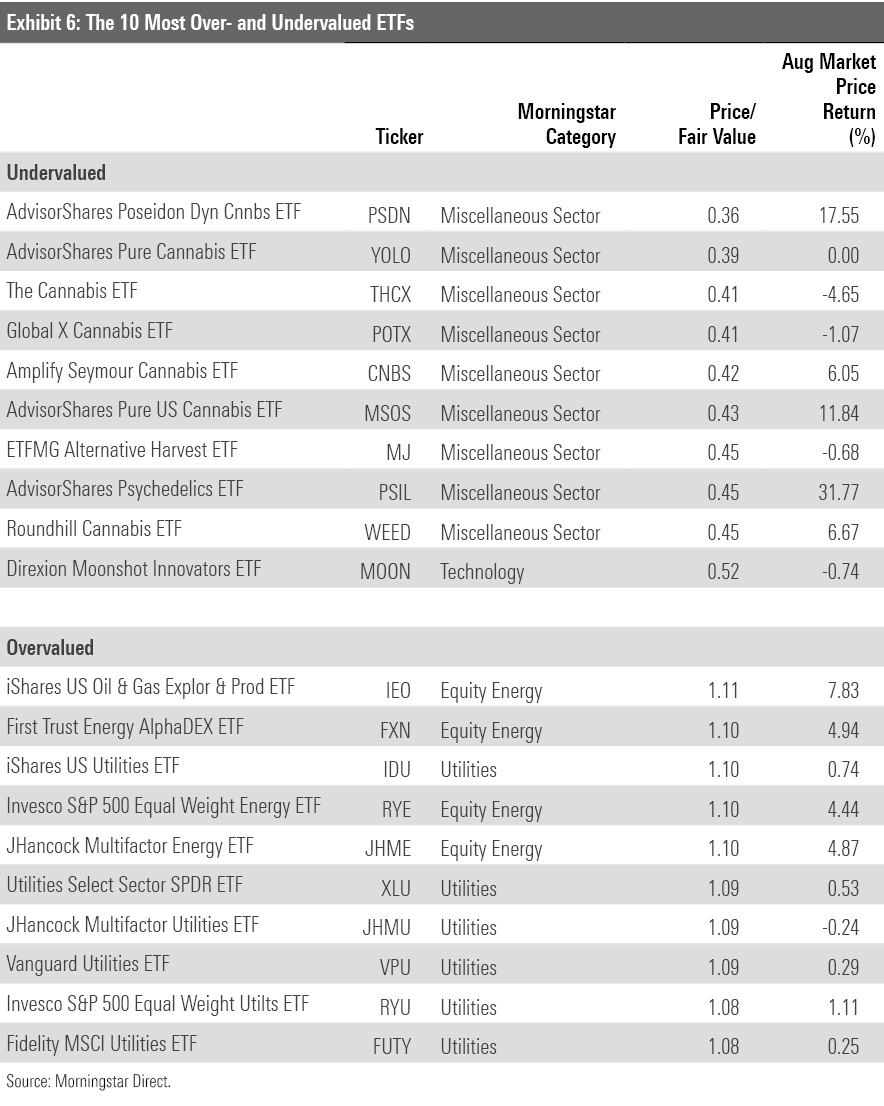
Funds that aim to leverage the legalization of cannabis or other drugs nearly swept the cheaper half of Exhibit 6, claiming nine of the available 10 spots. Each cannabis fund on the list traded at least 50% below their fair value at August’s end. These funds’ pain has been widespread and pronounced for most of the past 12 months, but August brought mixed results. AdvisorShares Pure U.S. Cannabis ETF MSOS advanced 11.84%, for example, as Global X Cannabis POTX retreated 1.07%. The funds’ disparate August returns reveal differences in their construction. MSOS is an actively managed, U.S.-only portfolio that tends to stash a chunk of its portfolio in cash. POTX, on the other hand, fully replicates an index of worldwide cannabis stocks. The divergence between these funds—both of which sport “cannabis” in their name—illustrates how difficult it can be to select the best thematic fund from those with similar objectives.
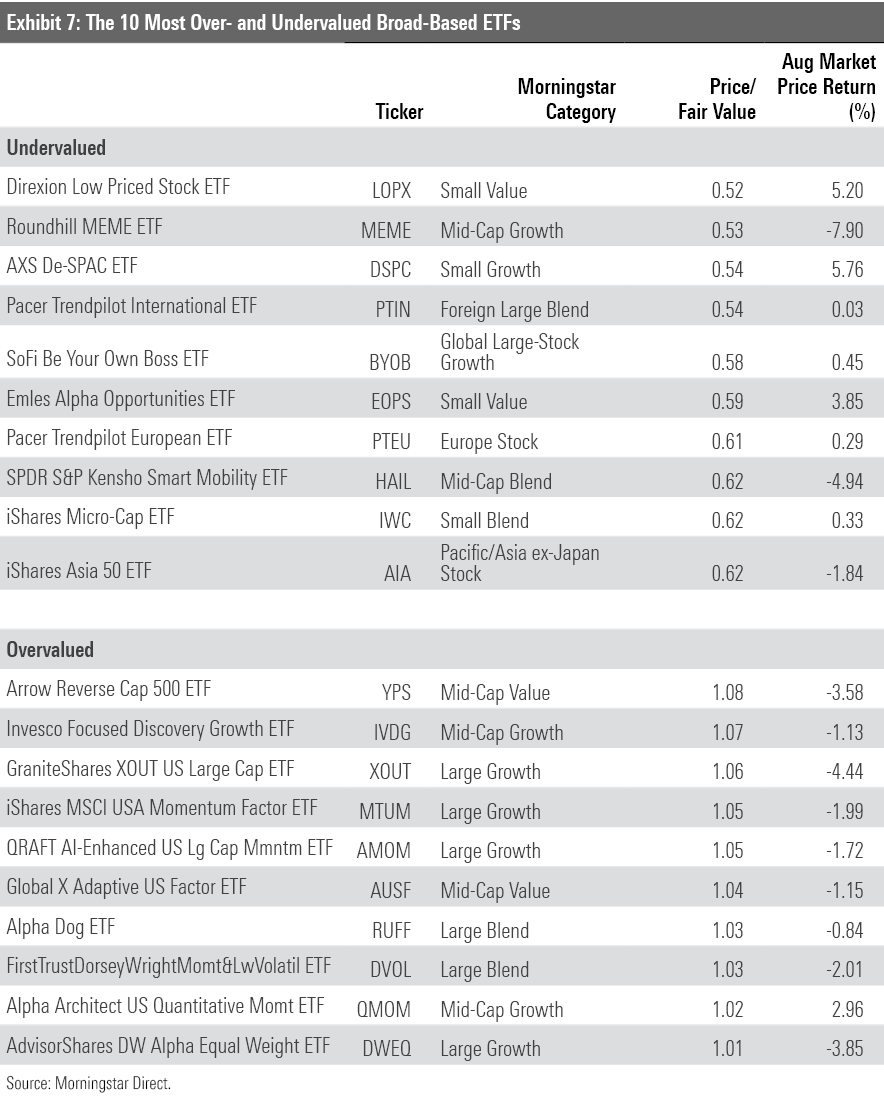
ETFs that track the utilities and energy sectors—the market's two best-performing in August—dominated the pricier half of Exhibit 7. Strive U.S. Energy ETF DRLL is one such fund that narrowly missed the cut. Launched in early August, the "post-ESG" fund aims to "unshackle" energy firms from increased shareholder pressure to improve their environmental status by diversifying away from oil. Backed by a pair of notorious billionaire investors, Peter Thiel and Bill Ackman, the fund accumulated more than $300 million in its first three weeks on the market. Time will tell whether the fund has captured the long-term interest of an underserved investor base, or if its hot start is a mere flash in the pan.
Of the 10 ETFs that compose the more richly valued half of Exhibit 7, only one garners a Morningstar Analyst Rating: iShares MSCI USA Momentum Factor ETF MTUM earns a Morningstar Analyst Rating of Bronze. This fund selects and weights 125 U.S. stocks by their exposure to momentum, a well-vetted risk factor that has historically been tied to outperformance. Market momentum can shift on a dime, which can make this fund look quite different from one semiannual rebalance to the next. When the fund reshuffled in May, it prioritized recent winners in sectors both defensive (utilities, healthcare, consumer staples) and statistically cheap (energy, financials). That sector shuffle led to a roller-coaster summer. The fund ranked within the bottom decile of the large-growth category when faster-growing, more-cyclical stocks came to life in July. But the fund landed in the category’s top decile during August’s market pullback, when cheaper, safer stocks fared best. Whichever corners of the market this fund holds, investors should expect its price/fair value ratio to look steep.
/d10o6nnig0wrdw.cloudfront.net/09-25-2023/t_f3a19a3382db4855b642d8e3207aba10_name_file_960x540_1600_v4_.jpg)
/d10o6nnig0wrdw.cloudfront.net/04-09-2024/t_e87d9a06e6904d6f97765a0784117913_name_file_960x540_1600_v4_.jpg)
/cloudfront-us-east-1.images.arcpublishing.com/morningstar/T2LGZCEHBZBJJPPKHO7Y4EEKSM.png)
:quality(80)/s3.amazonaws.com/arc-authors/morningstar/30e2fda6-bf21-4e54-9e50-831a2bcccd80.jpg)