
EE Bonds Vs. I Bonds
Which is the better deal?
/s3.amazonaws.com/arc-authors/morningstar/1aafbfcc-e9cb-40cc-afaa-43cada43a932.jpg)

Round Three
This is the third and final installment in my series on that most fashionable of investments, Series I Savings Bonds, commonly known as I Bonds.
The first article discussed how, because of the lag in determining their payout schedules, I Bonds bought today will pay spring/summer 2022 inflation rates well into next year. That feature enables them to easily outyield bank CDs. Investors seeking a one-year investment can buy an I Bond now, sell it in August 2023, pay the three-month yield penalty that is levied on I Bonds that are not held for at least five years, and still beat bank deposits. As a short-term asset, I Bonds cannot miss.
The second article compared the performance of I Bonds against that of Treasury bills, short Treasury notes, and five-year Treasury Inflation-Protected Securities. Under its original selling term, which included a 3.4% annual fixed-rate payment in addition to its inflation-rate payout, the I Bond was a runaway winner. That fixed-rate payment has since vanished. Consequently, the contest between the four investments has tightened. There remains an argument for owning I Bonds for the long run, as part of a strategic portfolio, but the point can be debated.
Today’s article assesses how I Bonds compare with their fixed-rate sibling, Series EE Savings Bonds. The two investments are closely related. Each version of savings bond is sold and administered solely by the U.S. Treasury, has limited availability (for individuals only, cannot be held in tax-sheltered accounts, and carries a $10,000 annual purchase limit, extended to $15,000 if bought with an IRS refund). Each bond also matures after 30 years, although investors may redeem earlier if they desire. Finally, each investment accrues interest, instead of making ongoing payments, which permits their owners to defer taxes until the redemption date.
The Old Rules
My first study is for historical purposes only. Since the Treasury launched its first I Bond series in September 1998, it has changed the rules for EE Bonds. In 1998, the construction for EE Bonds resembled that of I Bonds. Both securities paid variable interest rates, which were recalculated every six months. EE Bond yields were pegged to the payout on five-year Treasury notes, while those of I Bonds fluctuated with the CPI-U inflation index, but the mechanism was akin.
The big difference between the two securities was that the early versions of I Bonds boasted a second, permanent component of yield: its fixed-rate payment. Specifically, an I Bond bought in September 1998 would pay 3.4% annually in addition to its variable payment. For this reason, even though an EE Bond issued in September 1998 boasted a higher initial yield than did its new I Bond rival, its future return was much worse. (As the chart shows, the EE Bond and I Bond would have performed similarly had the latter not possessed its fixed-rate bonus.)
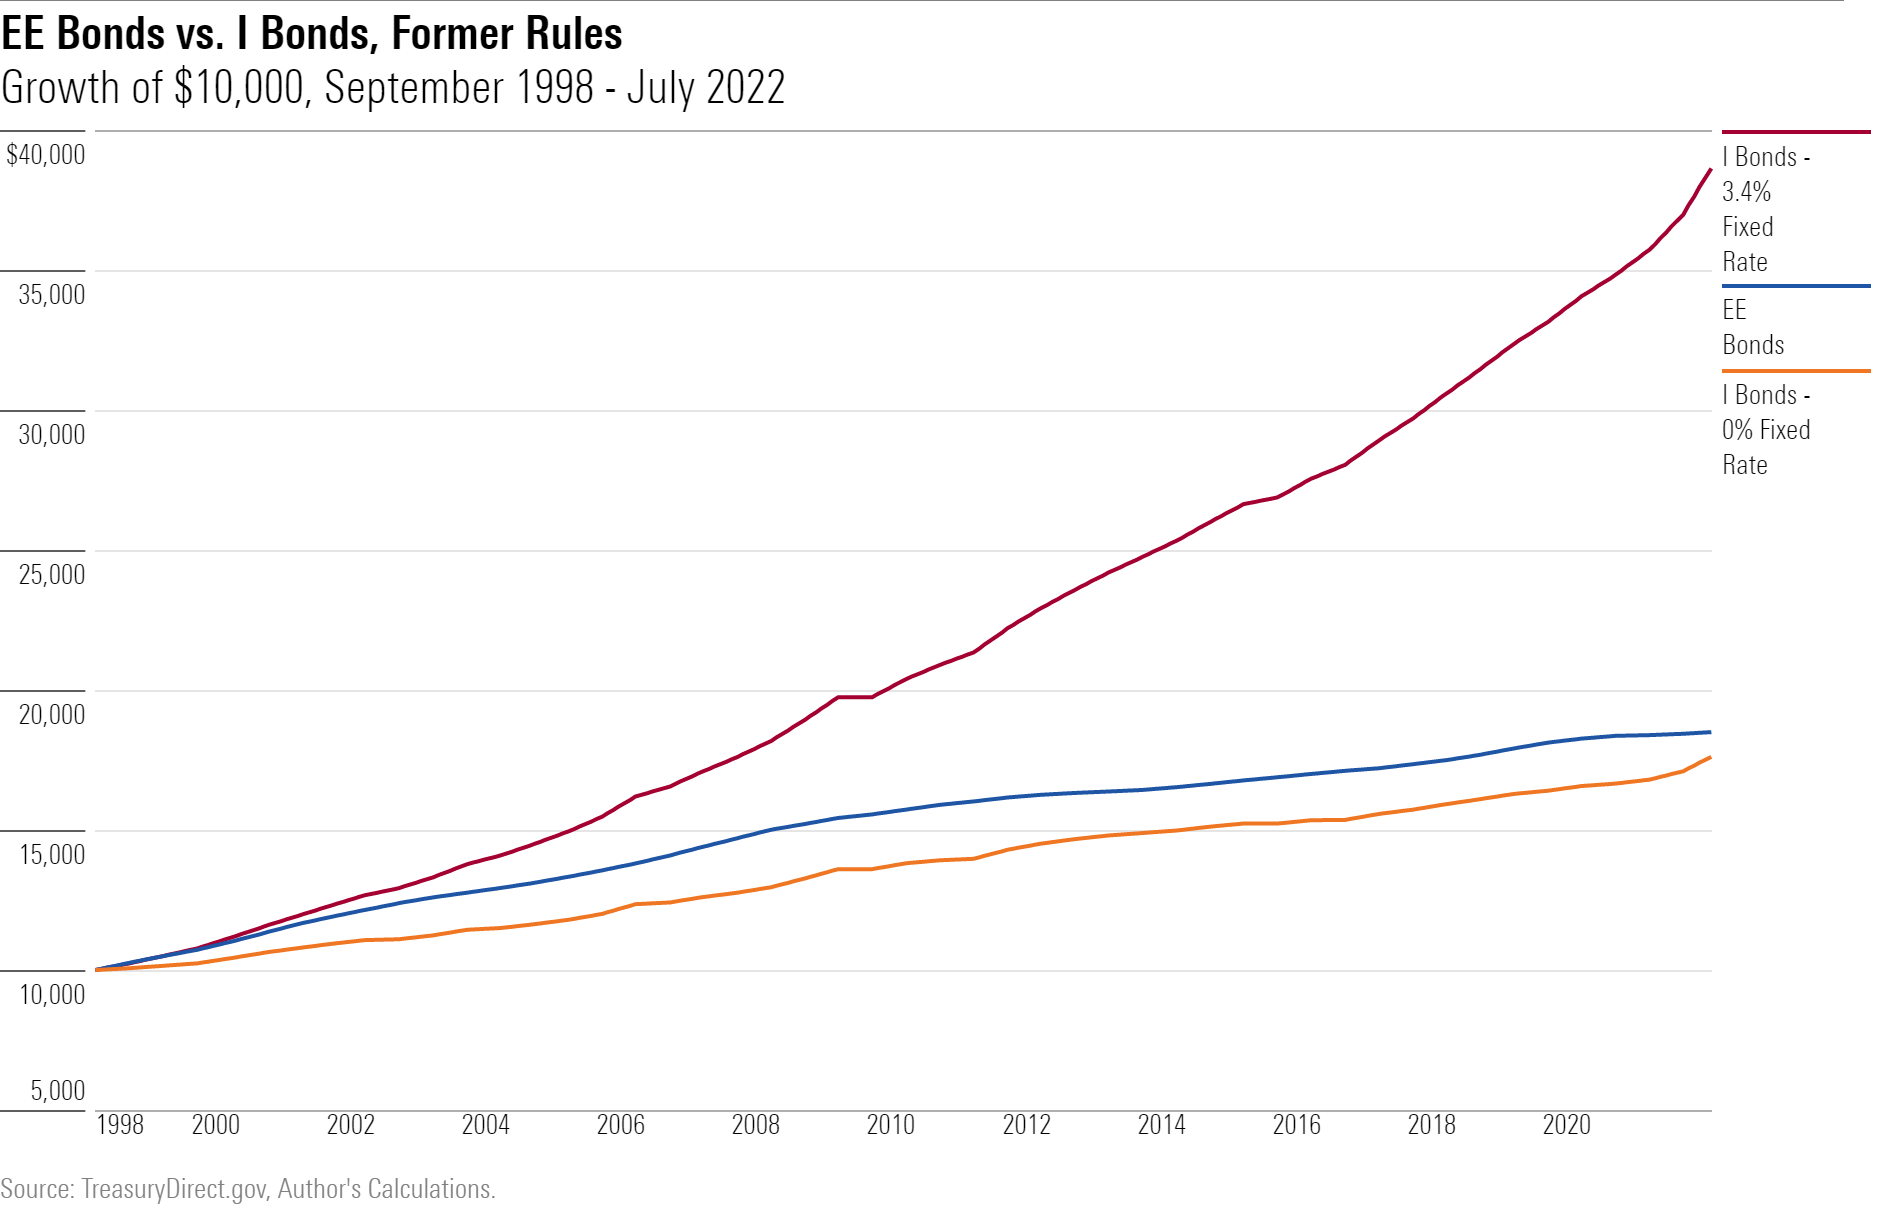
The upshot: Although EE Bonds were a sound investment, paying 90% of the prevailing yield on five-year Treasuries, while providing their owners the additional benefits of a put option and a tax shelter, I Bonds were far superior. At the time, though, investors preferred EE Bonds. During the first four full years of I Bonds’ existence, from 1999 through 2002, savings-bond customers bought $19.3 billion of EE bonds, but only $9 billion of I Bonds. Their mistake.
The New System
In 2005, the Treasury amended its EE Bond terms. By that date the department had already scrapped most of I Bonds’ fixed-rate payment, which has been inconsequential since 2008, and which currently rests at zero. It then decided that the terms on EE Bonds were too generous. It removed its promise of paying 90% of the five-year Treasury yield, replacing that figure with a lower amount. In addition, the new yields on EE Bonds were permanent. They would not change with the market. Investors would receive exactly what they bought.
Initially, the Treasury’s EE offering looked acceptable. The May 2005 yield on EE Bonds was 3.5%, which not only exceeded the then-current inflation rate, but which has subsequently surpassed Treasury payouts. Over the past decade, no Treasury security, of any maturity, has yielded that much. However, the Treasury quickly amended its conditions. By 2008, the annual yield delivered by a new EE bond had dropped to 1.4%. Since 2011, it has never reached even 1%.
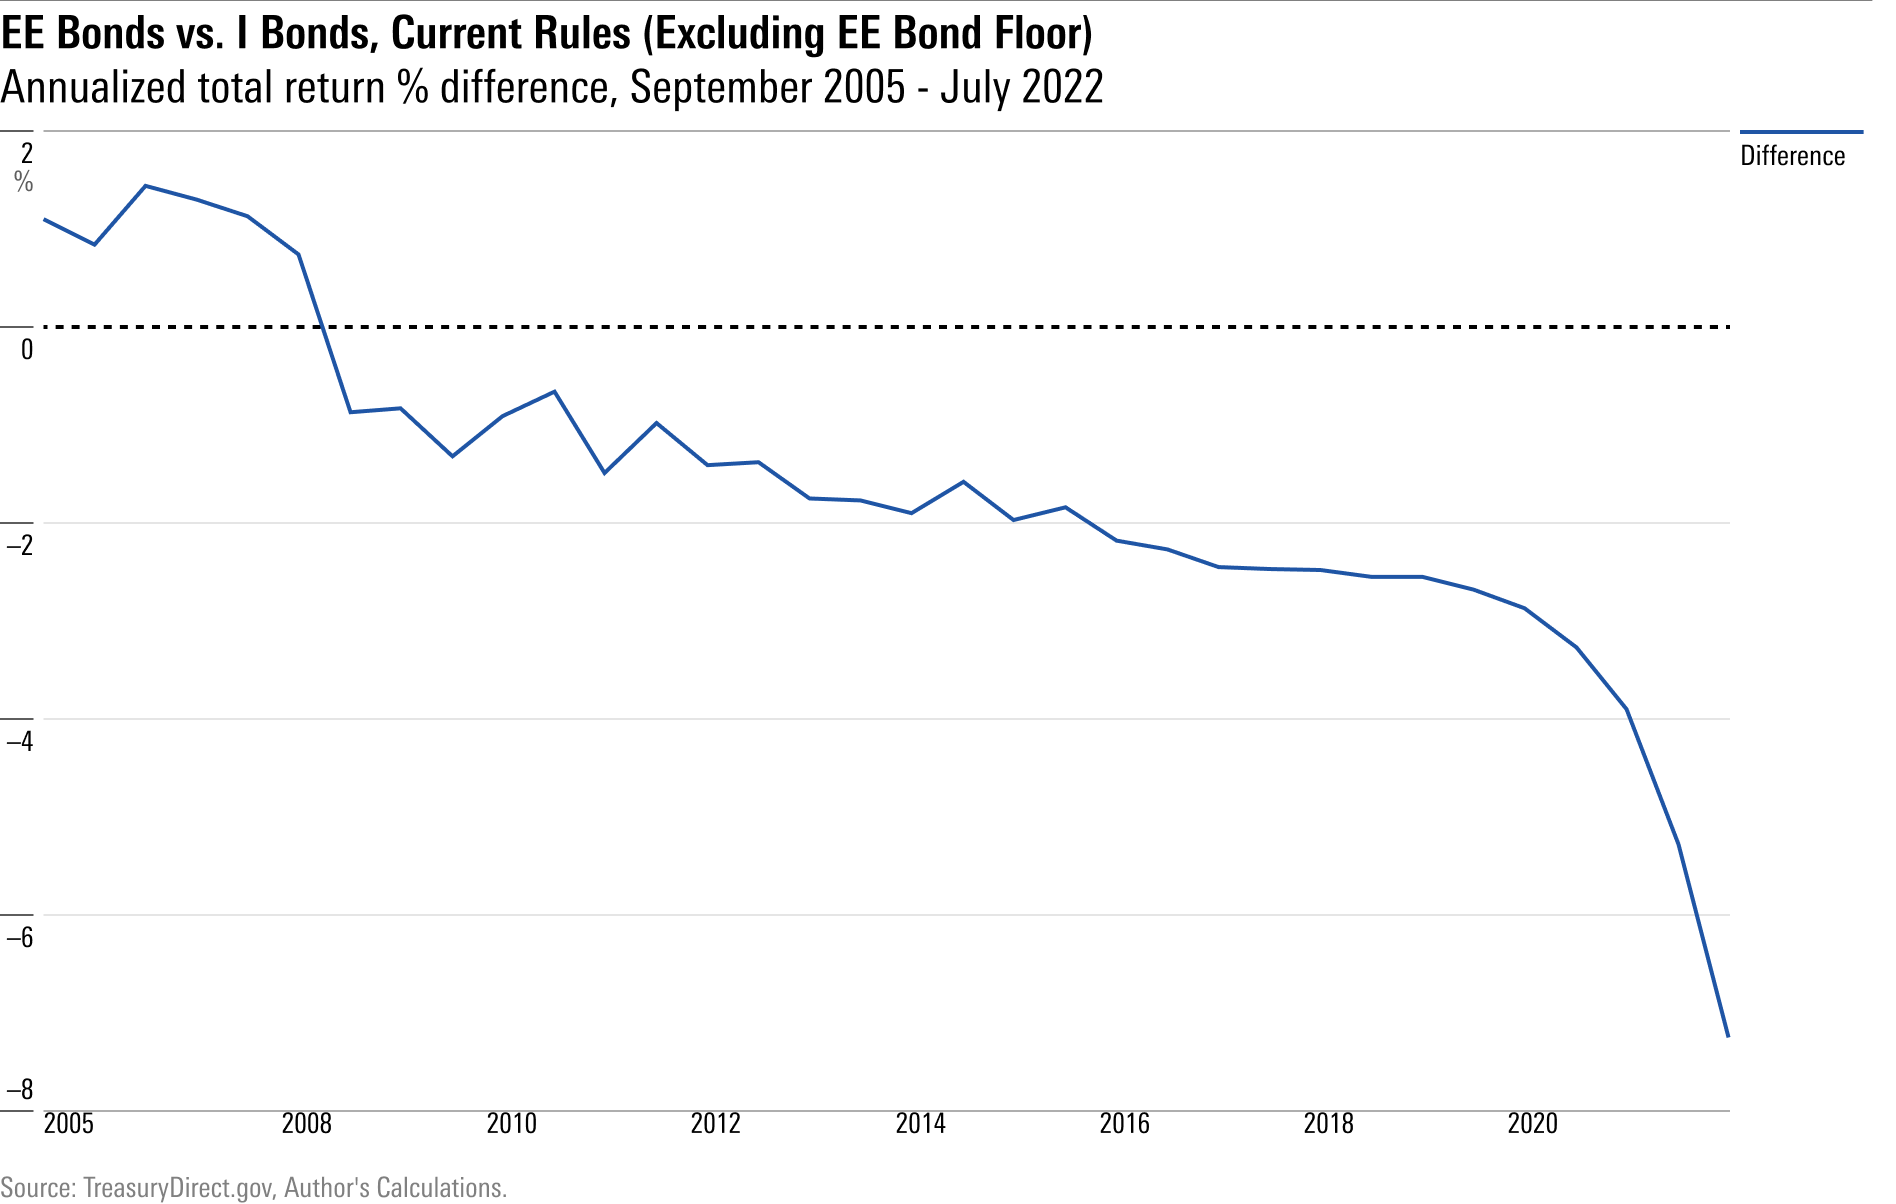
As a result, I Bonds have been the much better deal. The next illustration depicts the difference in annualized total returns for each six-month tranche of savings bond, starting in September 2005, and ending in July 2022. A positive figure shows that the EE Bond outgained the I Bond, while a negative amount indicates the opposite. (Although some of the I Bond tranches had fixed-rate payments, I omitted them for this presentation, as I wish to show the terms that are available to current savings-bond investors. The Treasury has not offered fixed-rate payments on I bonds for several years now; I suspect that trend will continue.)
Considering the Floor
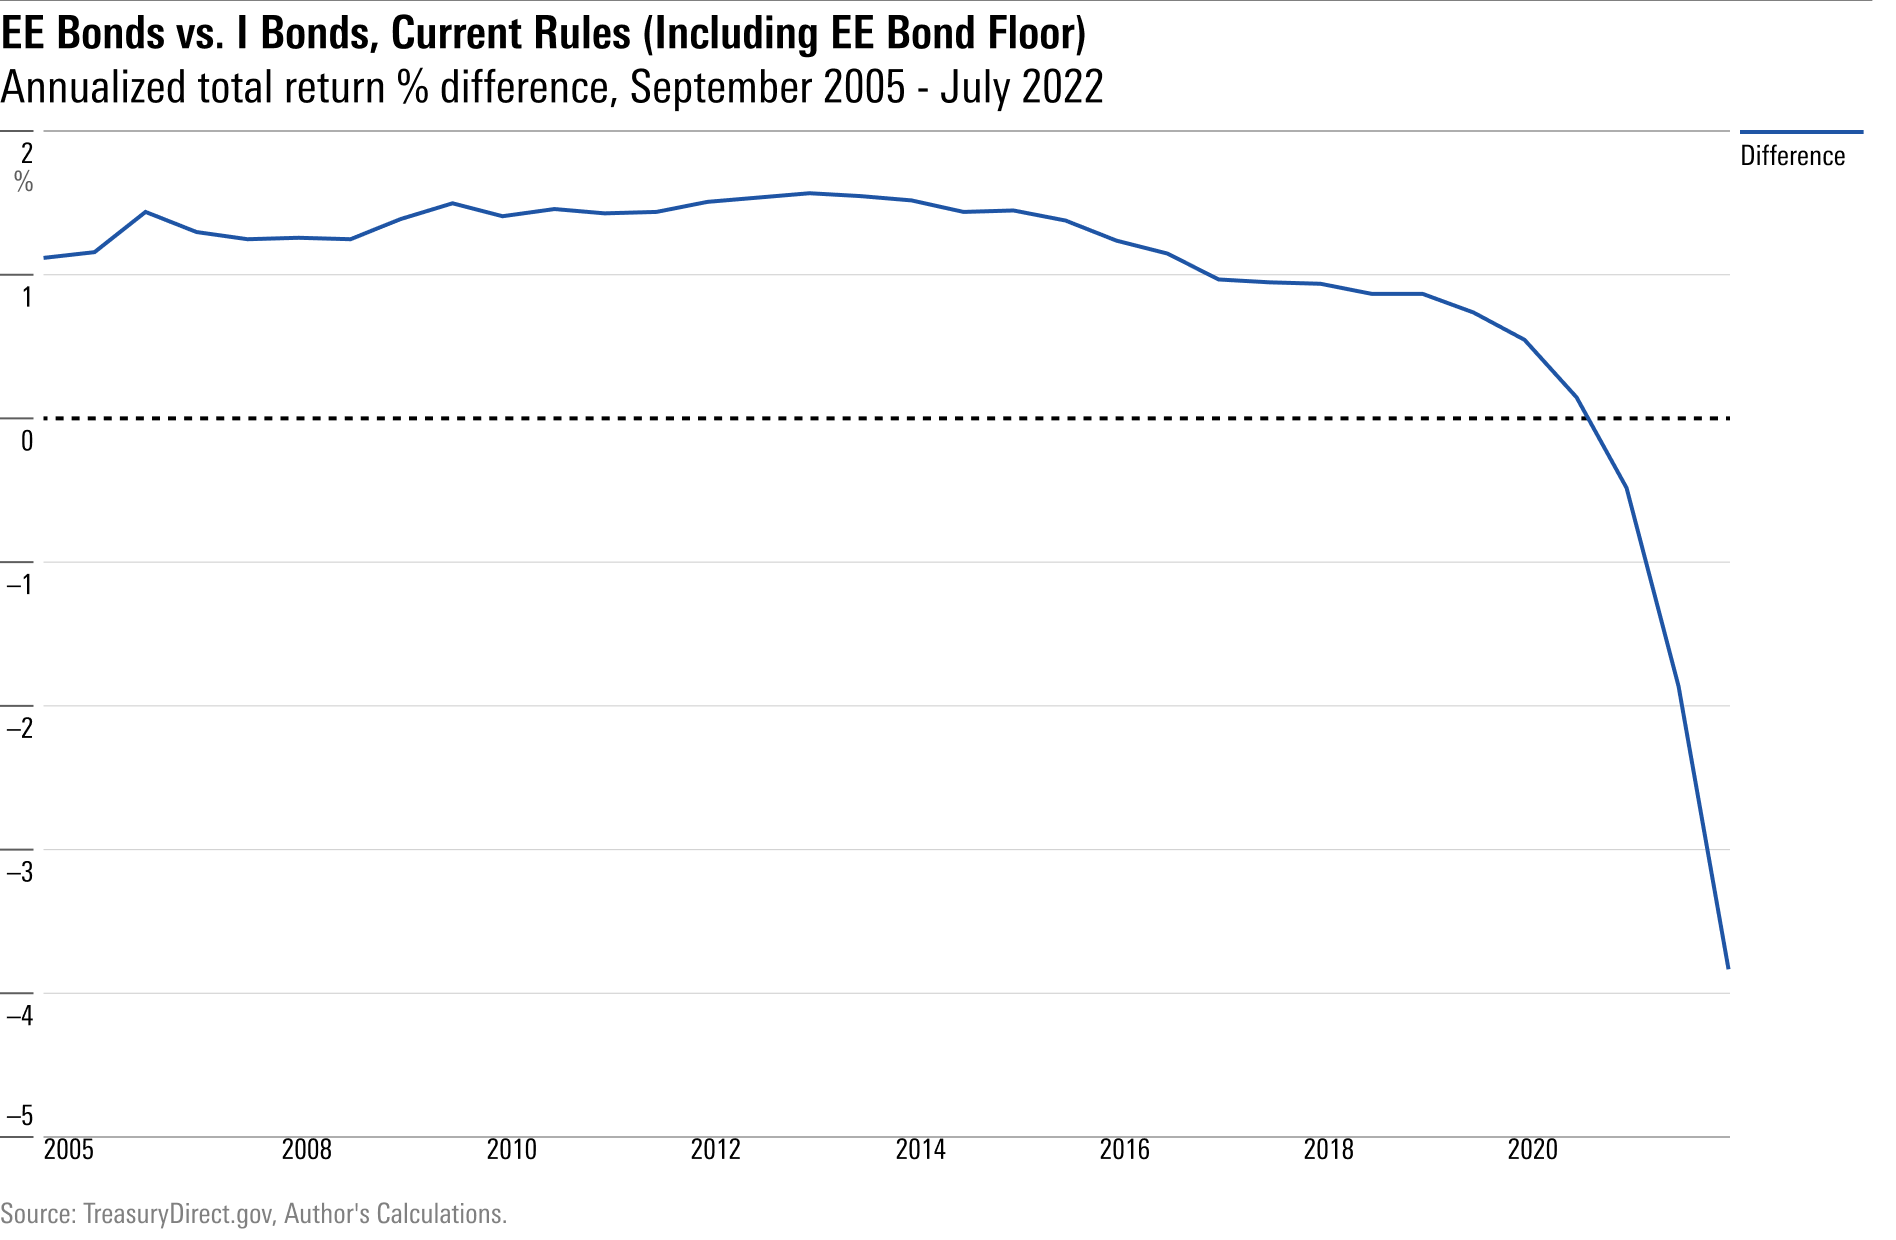
A thrashing! The chart leaves one wondering what the Treasury was thinking. Who would ever buy EE Bonds? As it turns out, there is a catch. (For a supposedly simple investment, saving bonds require a surprising number of asterisks.) If EE Bond owners retain their security for 20 years, the Treasury promises that it will double the amount of their original investment, should they choose to redeem it.
As a 100% cumulative gain over 20 years equates to a 3.53% annual gain, this guarantee means in practice that despite the EE Bonds’ apparently miniscule yields, they will provide a respectable nominal return for very long-term owners. (Whether their after-inflation return will appeal is another question.) Plugging in this 3.53% floor reverses the verdict of the previous chart. Only I Bonds bought during the past two years have outgained the guaranteed rate that has been promised to EE Bonds. (Again, this chart discards fixed-rate payments.)
Wrapping Up
But of course, the situations are far from identical! Subject to the regulations that savings bonds may not be sold within 12 months of their purchase (and must forfeit three months’ worth of interest if redeemed before their fifth birthday), I Bond investors enjoy great flexibility. If inflation remains high, they can retain their bonds and profit. If inflation plummets, they can swap their securities for higher-paying conventional notes. Meanwhile, those who own EE Bonds are stuck. Unless they hold their investments for a full 20 years—a potentially disastrous decision, should inflation persist—they will receive almost nothing. After all, the current official yield on EE Bonds is … 0.10%. Might as well make it zero.
Rarely do my columns arrive at such an obvious conclusion. I Bonds are highly attractive for the near term, and possibly so for the longer haul. EE Bonds, on the other hand, are best avoided.
The opinions expressed here are the author’s. Morningstar values diversity of thought and publishes a broad range of viewpoints.
The author or authors do not own shares in any securities mentioned in this article. Find out about Morningstar’s editorial policies.
/cloudfront-us-east-1.images.arcpublishing.com/morningstar/G3DCA6SF2FAR5PKHPEXOIB6CWQ.jpg)
/cloudfront-us-east-1.images.arcpublishing.com/morningstar/VUWQI723Q5E43P5QRTRHGLJ7TI.png)
/cloudfront-us-east-1.images.arcpublishing.com/morningstar/XLSY65MOPVF3FIKU6E2FHF4GXE.png)
:quality(80)/s3.amazonaws.com/arc-authors/morningstar/1aafbfcc-e9cb-40cc-afaa-43cada43a932.jpg)