
How Do You Tell a Bear-Market Rally in Stocks From a New Bull Run?
Bear traps can be short, swift, and end as quickly as they started.
/s3.amazonaws.com/arc-authors/morningstar/ed88495a-f0ba-4a6a-9a05-52796711ffb1.jpg)
Could it be that the bear market that began the year and was officially confirmed in June is already headed for the history books? Or are investors being suckered by a bear-market rally?
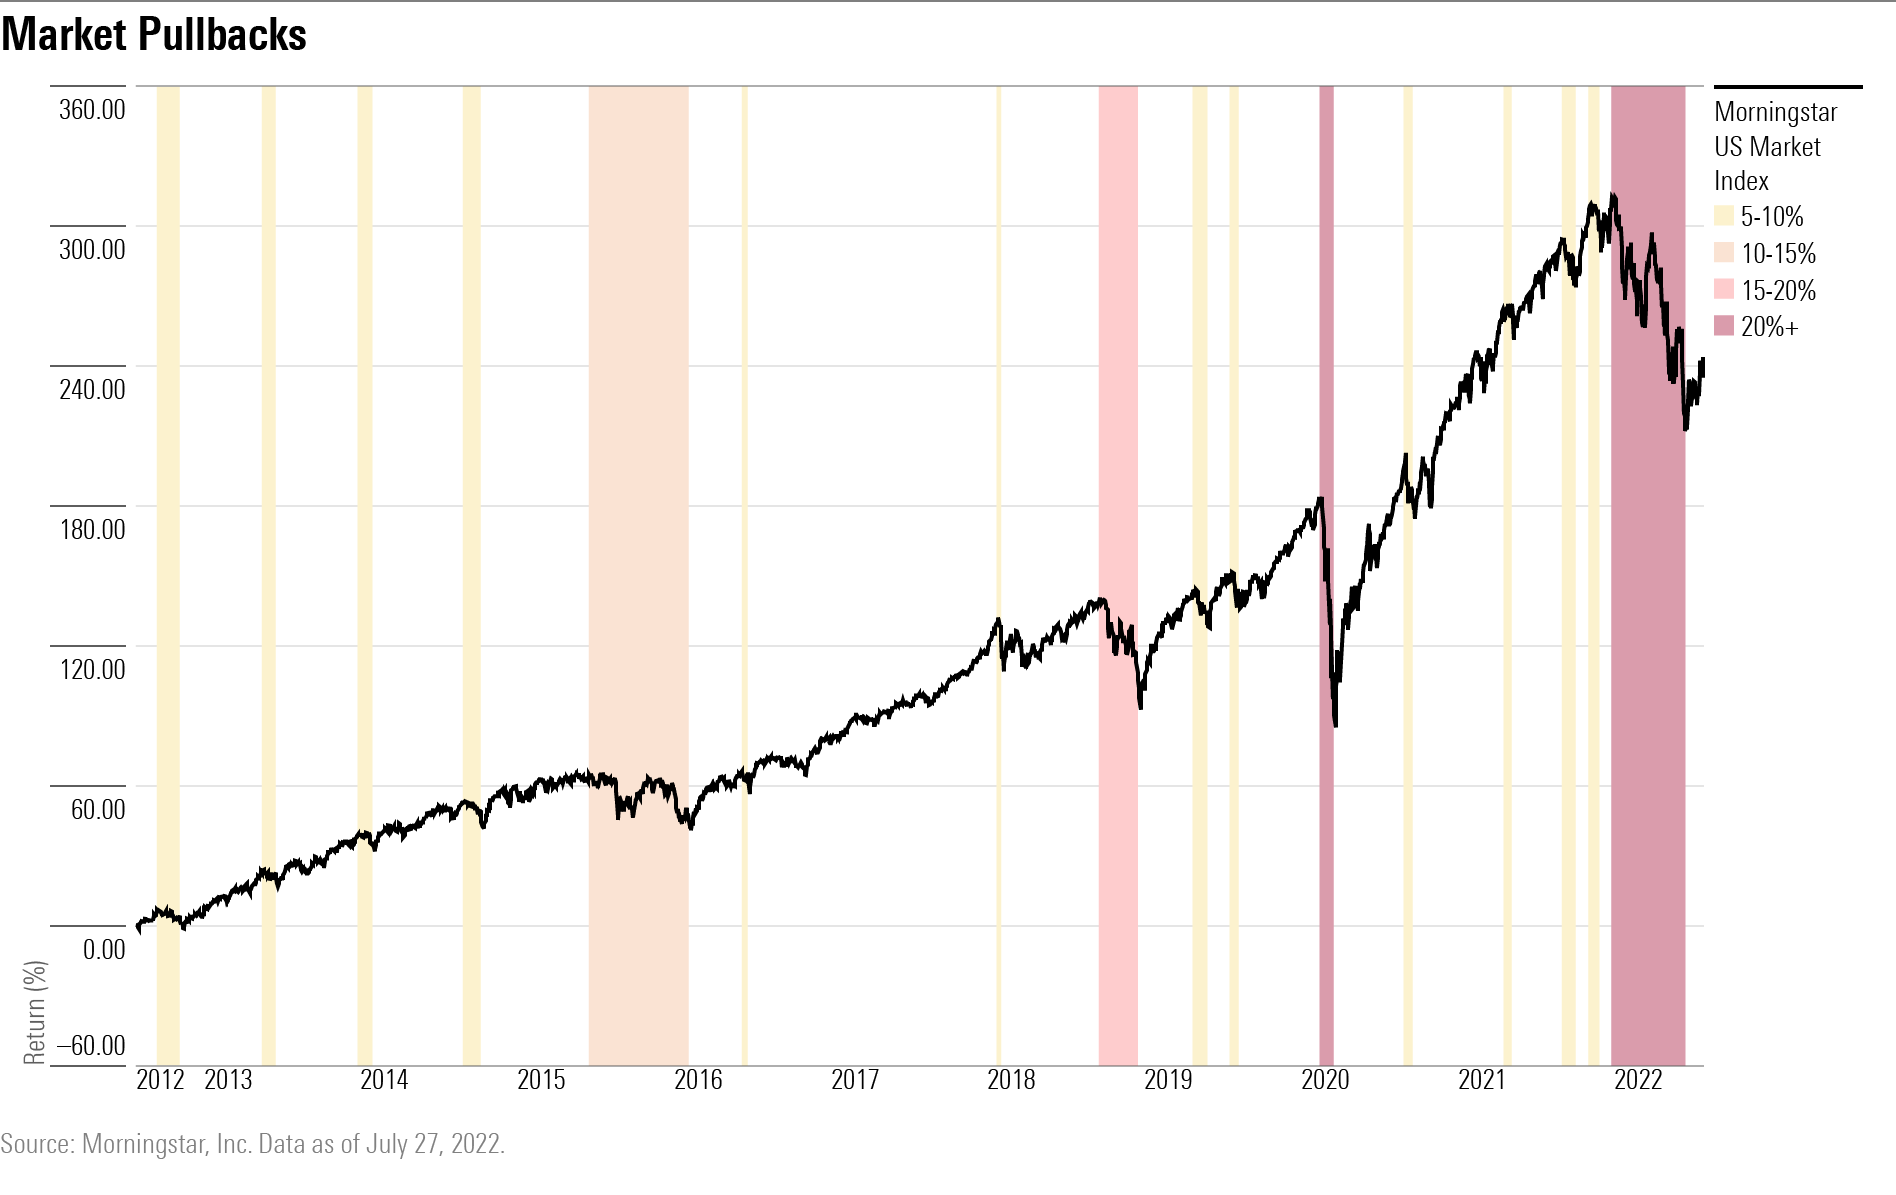
The broad market has recovered in recent weeks as the Morningstar US Market Index is now up nearly 12% from its 52-week low on June 16, a day after the Federal Reserve raised rates by three fourths of a percentage point, the most since 1994, as it battles to contain soaring inflation. It raised rates again by 0.75% Wednesday, as was expected.
In the past six weeks, investors have piled into stocks as if the stage were set for a new phase of expansion. This follows a five-month slide. The Morningstar US Market Index peaked at 11,941.5 on Jan. 3 before declining 23% as of June 13, placing it in official bear-market status. The index hit a low of 8,977.9 before then advancing 11.3% to close at 10,000 on July 28.
The Morningstar US Technology Index approached bear-market territory on March 14 when it closed down 19.8% from its peak on Nov. 22. The index then zipped higher, gaining 17.3% as of March 29 before resuming its downward trend. The index lost 27% between its March 29 close and its June 16 low. Since then, it has risen from low and is up 11.5% as of July 28.
A common rule of thumb: a new bull market is marked by a 20% gain from the low for a sustained period of time. Ned Davis Research, an independent provider of global investment research based in Nokomis, Florida, uses the Dow Jones Industrial Average to track bulls and bears because there is more history associated with the index. They maintain that a 30% rise in stocks for more than 50 days, or a 13% gain for more than 155 days, heralds the start of a new bull market.
What’s a Bear Trap?
Beware the bear-market rally, also known as a bear trap, the sucker’s rally, and a dead cat bounce. A phenomenon characterized by a swift and powerful rise in stocks, is typically triggered by short sellers covering bets and value investors snapping up the most beaten-down shares, assuming the worst is over only to see the market fall again. Bear-market rallies tend to be narrowly based, short-lived, and end as swiftly as they started, often leaving investors worse off.
“Bear-market rallies are wrapped in days and weeks, not months and quarters,” says Ed Clissold, chief U.S. strategist for Ned Davis Research.
A case in point: After falling to a new low of 12,581.2 on March 14 the Nasdaq rallied for the next two weeks hitting 14,619.6 on March 29, a 16% gain. The tech-heavy index began another descent that would drag it down 23% to 11,264.4 by May 24. It ultimately slid to a 52-week low of 10,646.10 on June 16, for a loss of 33.44% from its all-time high on Nov. 19. By yesterday's close the index had risen to 12,162.6 for a gain of 15% from its June low.
The median gain of the largest rallies that have occurred within bear markets is 11.5% over 39 days, according to Ned Davis Research.
Outliers include the rally that occurred during the bear market of April 1930 that ran through July 1932. Between Oct. 5, 1931, and Nov. 9, 1931, stocks gained 30.6%. In modern times, during the bear market of September 1978 through April 1980, stocks rallied 28.1% between Nov. 14, 1978, and Feb. 13, 1980, a period of 456 days.
Bear-Market Rally or New Bull?
How do investors tell the difference between a bear-market rally and the birth of a new bull market?
Investment professionals look for certain technical signals to be in place before confirming a reversal is underway. What’s key is the number of stocks participating in a move, which is why these sorts of indicators are referred to in the parlance of market technicians as “breadth thrust” signals. The duration of the move and the price gains associated with it are also important. The indicators that most reliably confirm that there is a shift into a new bull market are:
- On the New York Stock Exchange, the NYSE American, and Nasdaq, 90% of the common stocks trade above their 10-day moving averages.
- Stocks advancing on the NYSE outpace those declining by nearly a 2-to-1 margin for at least 10 days.
- More than 55% of the stocks on the NYSE set new highs over a 20-day period.
These events only happen at bullish turns, says NDR’s Clissold. He highlights the end of the pandemic-induced bear market in March 2020, the shortest in history. That lasted 33 or 40 days, depending on whether you’re looking at the S&P 500 or the Dow Jones Industrial Average, where there were a series of powerful rallies that occurred through March and early April signaling a new upward move.
Faced with the worst first half for stocks and bonds in 50 years, the highest inflation in 40 years, and an endless barrage of bad economic data, investors might be excused for searching for bargains amid the rubble and assuming most of the damage is done.
Wall Street pros are at odds as to whether we are at an inflection point in the markets. Some see indications that we have likely hit the lows for stocks, while others warn of more pain ahead.
Representing the more bullish camp is James Paulsen, chief investment strategist at Leuthold Group in Minneapolis. He notes that the bottom may have already been made as the Fed is nearing the end of its tightening cycle, growth is slowing, and inflation is beginning to roll over. Moreover, he believes most of “the sellers are long gone.”
“Are there any nervous Nellies left?” he asks.
Taking the opposite view is David Kotok, co-founder and chief investment officer of Cumberland Advisors, a registered investment advisory firm in Sarasota, Florida, with $3.5 billion under management.
“We haven’t reached extreme levels of fear yet,” Kotok says. “We haven’t made a bottom because we haven’t seen extreme selling.” He expects interest rates will continue to go higher as inflation proves harder to subdue, geopolitical tensions worsen, and “shocks” emerge. He’s also concerned about “contagion risk” emanating from slowdowns in global economies.
What the Bear-Market Data Tells Us
A peek at the data associated with bear markets suggests that the pessimists are on the right side history. In the 30 bear markets that have occurred since 1929, the stock market registered an average decline of 29.7%, and the downturn lasted for an average of 341 days, according to Ned Davis Research.
To get a better handle on how long this bear market could last, consider their relationship to recessions. The stock market tends to peak at a median of 5.3 months before the start of recessions, according to Clissold at NDR. And the stock market bottoms four months before the end of a recession.
Right now, on a technical basis, the U.S. could well be in a recession.
The Commerce Department reported Wednesday that gross domestic product shrank by 0.9% in the second quarter, after contracting 1.6% in the first quarter. Two straight quarters of contracting economic growth defines a recession.
Still, economists and government officials have been refraining from ringing the recession bell, noting that the job market remains strong and consumer spending is holding up. Federal Reserve Chair Jerome Powell maintained this week after the central bank lifted rates again that he doesn’t believe the economy is in a recession.
In its “three bears” scenario, NDR lays out possibilities for how the bear market plays out if a recession occurs this year, next year, or not at all.
- If a recession occurs sometime in the second half of 2022, the stock market could drop another 10% or more. Bear markets that coincide with recessions tend to decline nearly 35% on average and last for 15.3 months. If this were to be the case, the sooner it would start, the sooner it would be over given that a bear market bottoms four months before a recession, setting the stage for a "shorter than average" recessionary bear market.
- If a recession occurs in 2023 that would make the current bear market twice as long as average, and likely lead to numerous bear-market rallies that eventually fail as they have in past instances. Clissold cites 1973, 1978, and 2000 as past bear markets that saw numerous rallies between their start and finish with a maximum gain of 15.9%, 14.3%, and 15.5%, respectively.
- The last and best scenario is if there is no recession at all. Stocks decline on average by 25% in a nonrecessionary bear market over 9.1 months. In the past 50 years, the average decline has been 18% over 6.8 months.
If the Fed can achieve the delicate balance of taming inflation by slowing the economy without tipping the country into a recession, Clissold says, “the cyclical bear is likely close to being over.”
/cloudfront-us-east-1.images.arcpublishing.com/morningstar/T5MECJUE65CADONYJ7GARN2A3E.jpeg)
/cloudfront-us-east-1.images.arcpublishing.com/morningstar/VUWQI723Q5E43P5QRTRHGLJ7TI.png)
/d10o6nnig0wrdw.cloudfront.net/04-22-2024/t_ffc6e675543a4913a5312be02f5c571a_name_file_960x540_1600_v4_.jpg)
:quality(80)/s3.amazonaws.com/arc-authors/morningstar/ed88495a-f0ba-4a6a-9a05-52796711ffb1.jpg)