
14 Charts on the Market’s Second-Quarter Performance
For just the second time in 40 years, bonds and stocks both posted losses for two consecutive quarters.
/s3.amazonaws.com/arc-authors/morningstar/ba63f047-a5cf-49a2-aa38-61ba5ba0cc9e.jpg)

There’s no use sugar-coating how badly the second quarter played out for most investors.
Heading into midyear, stocks are in their second bear market in just over two years, with year-to-date losses for the broad market of more than 20%, and even steeper declines for formerly top-performing shares of growth-companies, such as Amazon AMZN and Tesla TSLA.
The primary driver of the damage was rising interest rates. Thanks to stubbornly high inflation, the Federal Reserve was forced to take increasingly aggressive moves with hike rates. That was capped by June’s three-quarters of a percentage point increase in the federal-funds rate, the first tightening of that magnitude since 1994.
As a result, bonds spent the second quarter the way they started the year, continuing one of the worst selloffs in the market’s history.
The result was that for only the second time in more than four decades stocks and bonds both posted losses for two consecutive quarters. The last time investors saw back-to-back down quarters for stocks and bonds was in 2008, and before that, 1981. With the unusual combination of losses in both markets, just about the only safe harbors from the storm have been cash, commodities-focused strategies and, to a lesser extent, high-dividend stocks. Meanwhile, investors who thought they were diversifying by loading up on crytpocurrencies have gotten shellacked as Bitcoin and Ethereum both plunged over the last three months.
As the second half of the year begins, attention is shifting somewhat from the inflation threat to the potential for an economic recession triggered by rising interest rates. While slower economic growth may help bond portfolios, uncertainty about the economy promises both continued headwinds and volatility for the stock market.
Here are some key stats on the rough second quarter for investors.
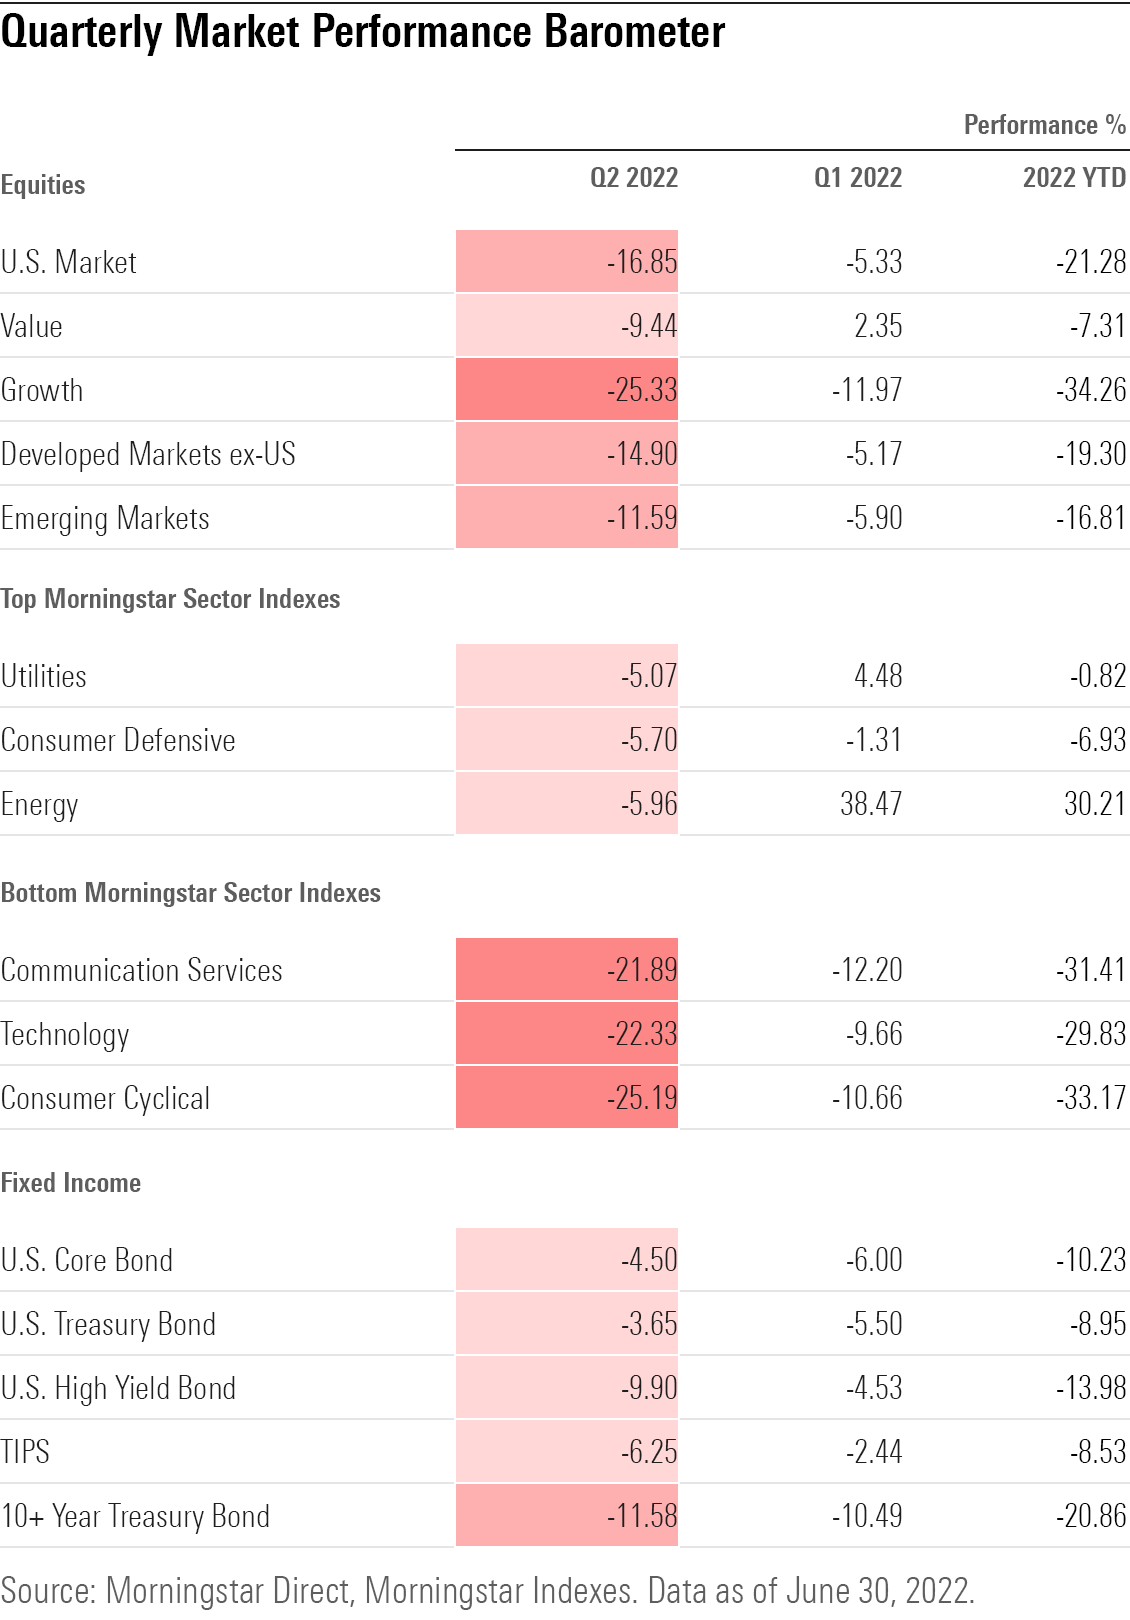
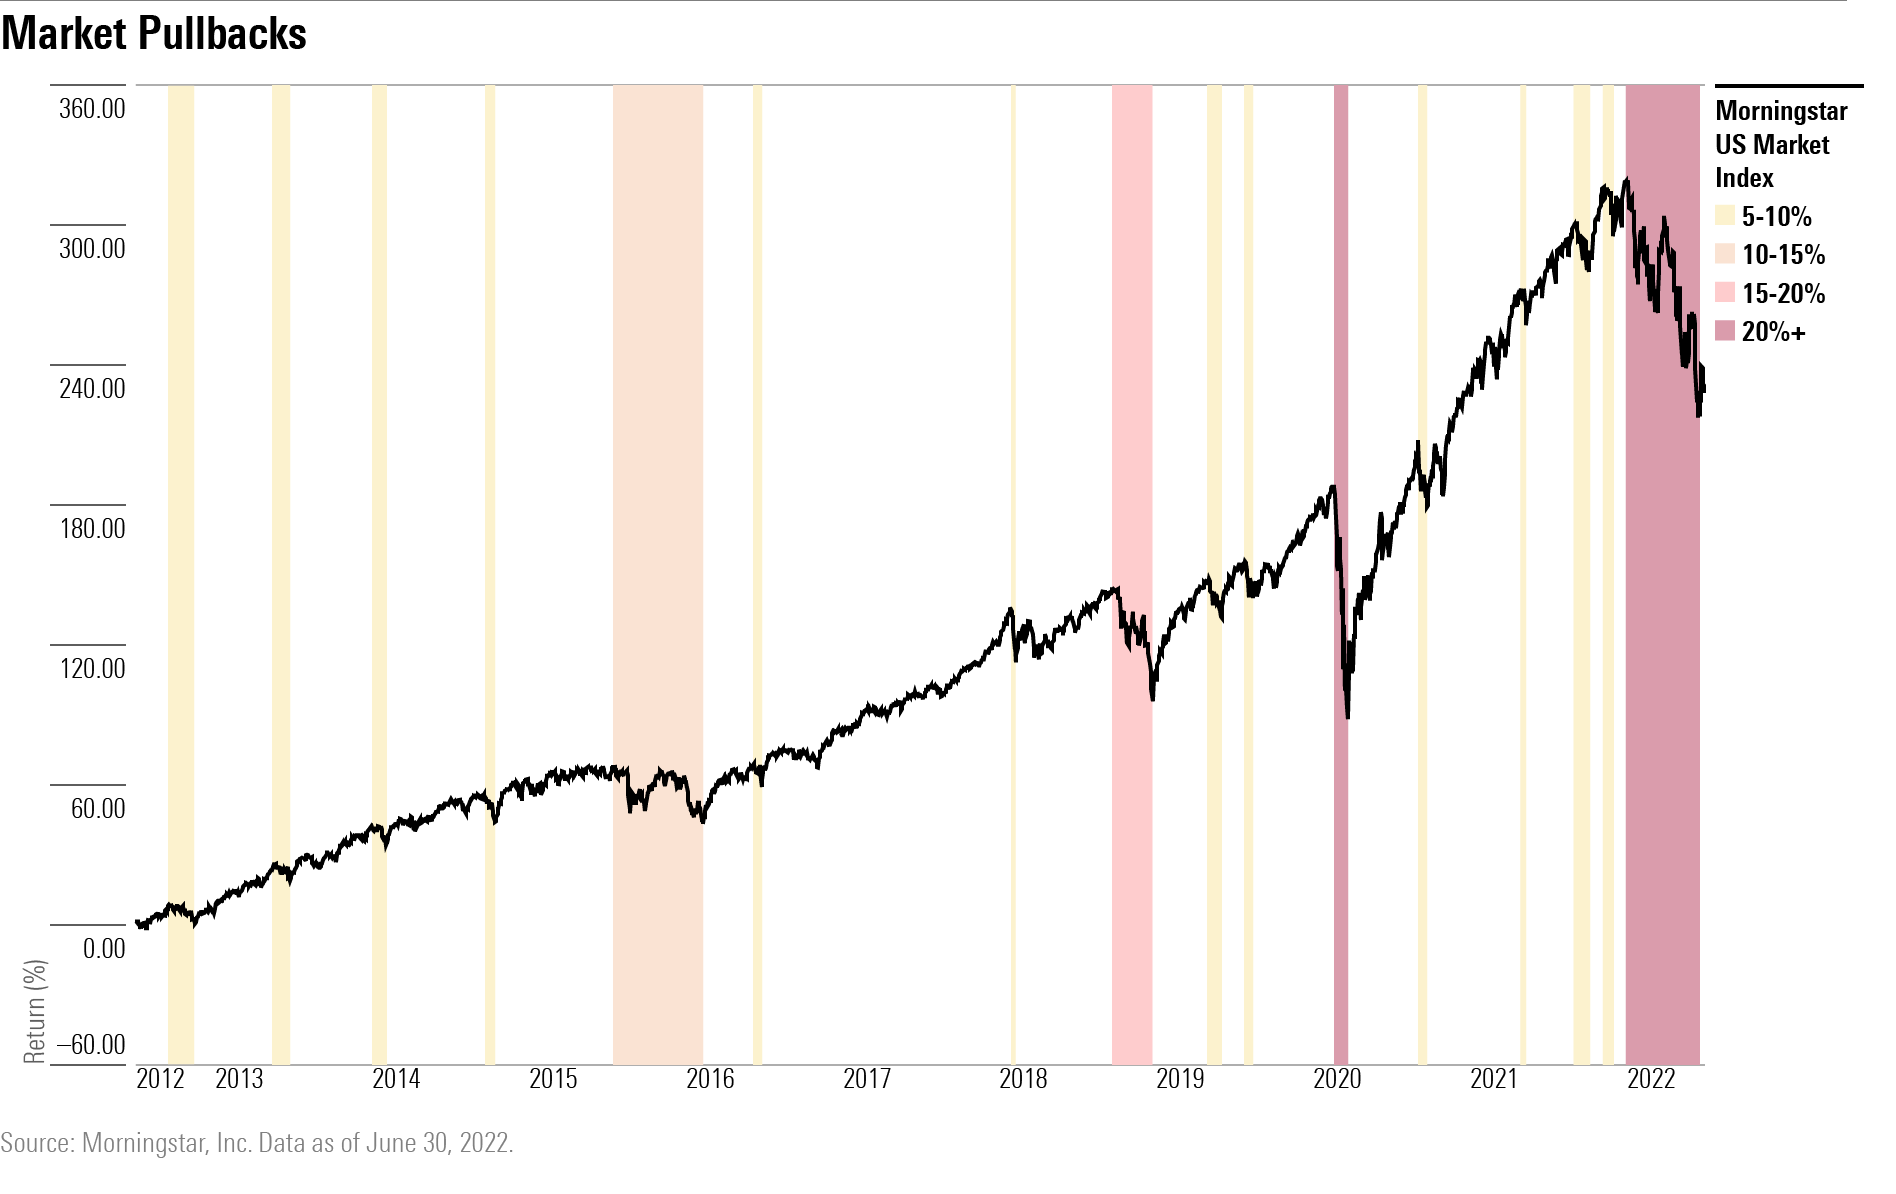
- The Morningstar US Market Index lost 16.9% in the second quarter, heading into mid-year with a 21.3% loss in 2022. This made for the biggest quarterly decline since Q1 2020 and the worst start to a year for the entire index's performance history starting in 1997.
- Despite the losses, stocks are still up an average of 9.7% per year over the last three years.
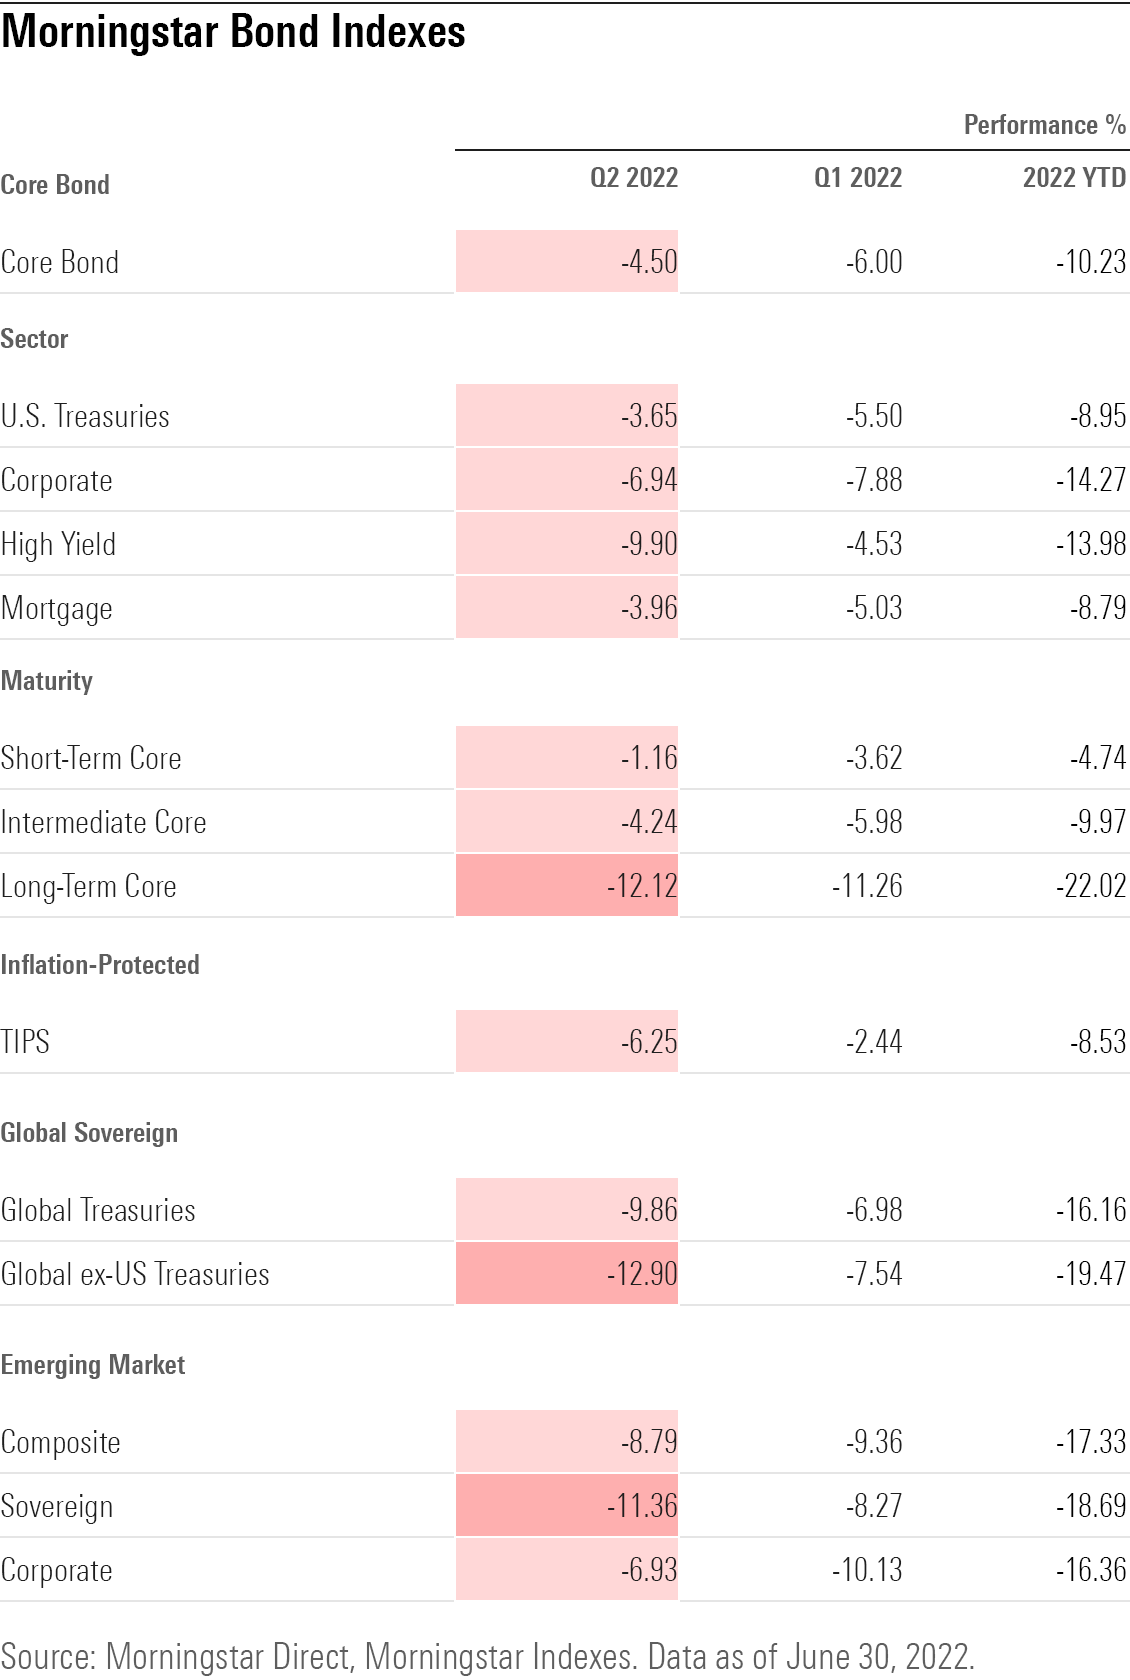
- Bonds extended the significant losses chalked up in first quarter, with the Morningstar Core Bond Index losing 4.5% in the second quarter. For the year to date, core bonds are down 10.2% and long-term treasury bonds are down 20.9%.
- Growth stocks got clobbered. The Morningstar US Large Value Index outperformed the US Large Growth Index by more than 20 percentage points this quarter. That's the greatest gap in favor of value since 2000.
- Bitcoin posted its largest quarterly drop in its history, losing 56.6% amid a widespread rout in the cryptocurrency market.
Best and Worst Performing Markets
Many of the trends that drove financial markets around the world to start the year continued into the second quarter. Chief among them were lingering pandemic-sparked supply chain snarls that were only compounded by fresh lockdowns in China. Russia's attack on Ukraine fueled a continued jump in energy prices.
In a difficult market one standout performer was the Morningstar Broad Hedge Fund Index, meant to capture the performance and behavior of hedge funds. One potential source of gains for these strategies has been their ability to bet on declines in the market through what's known as selling short. The index rose 4.3% during the quarter, ahead of the Morningstar US Market Index by 21.1 percentage points, its strongest relative performance since the inception of the hedge fund index in 2003.
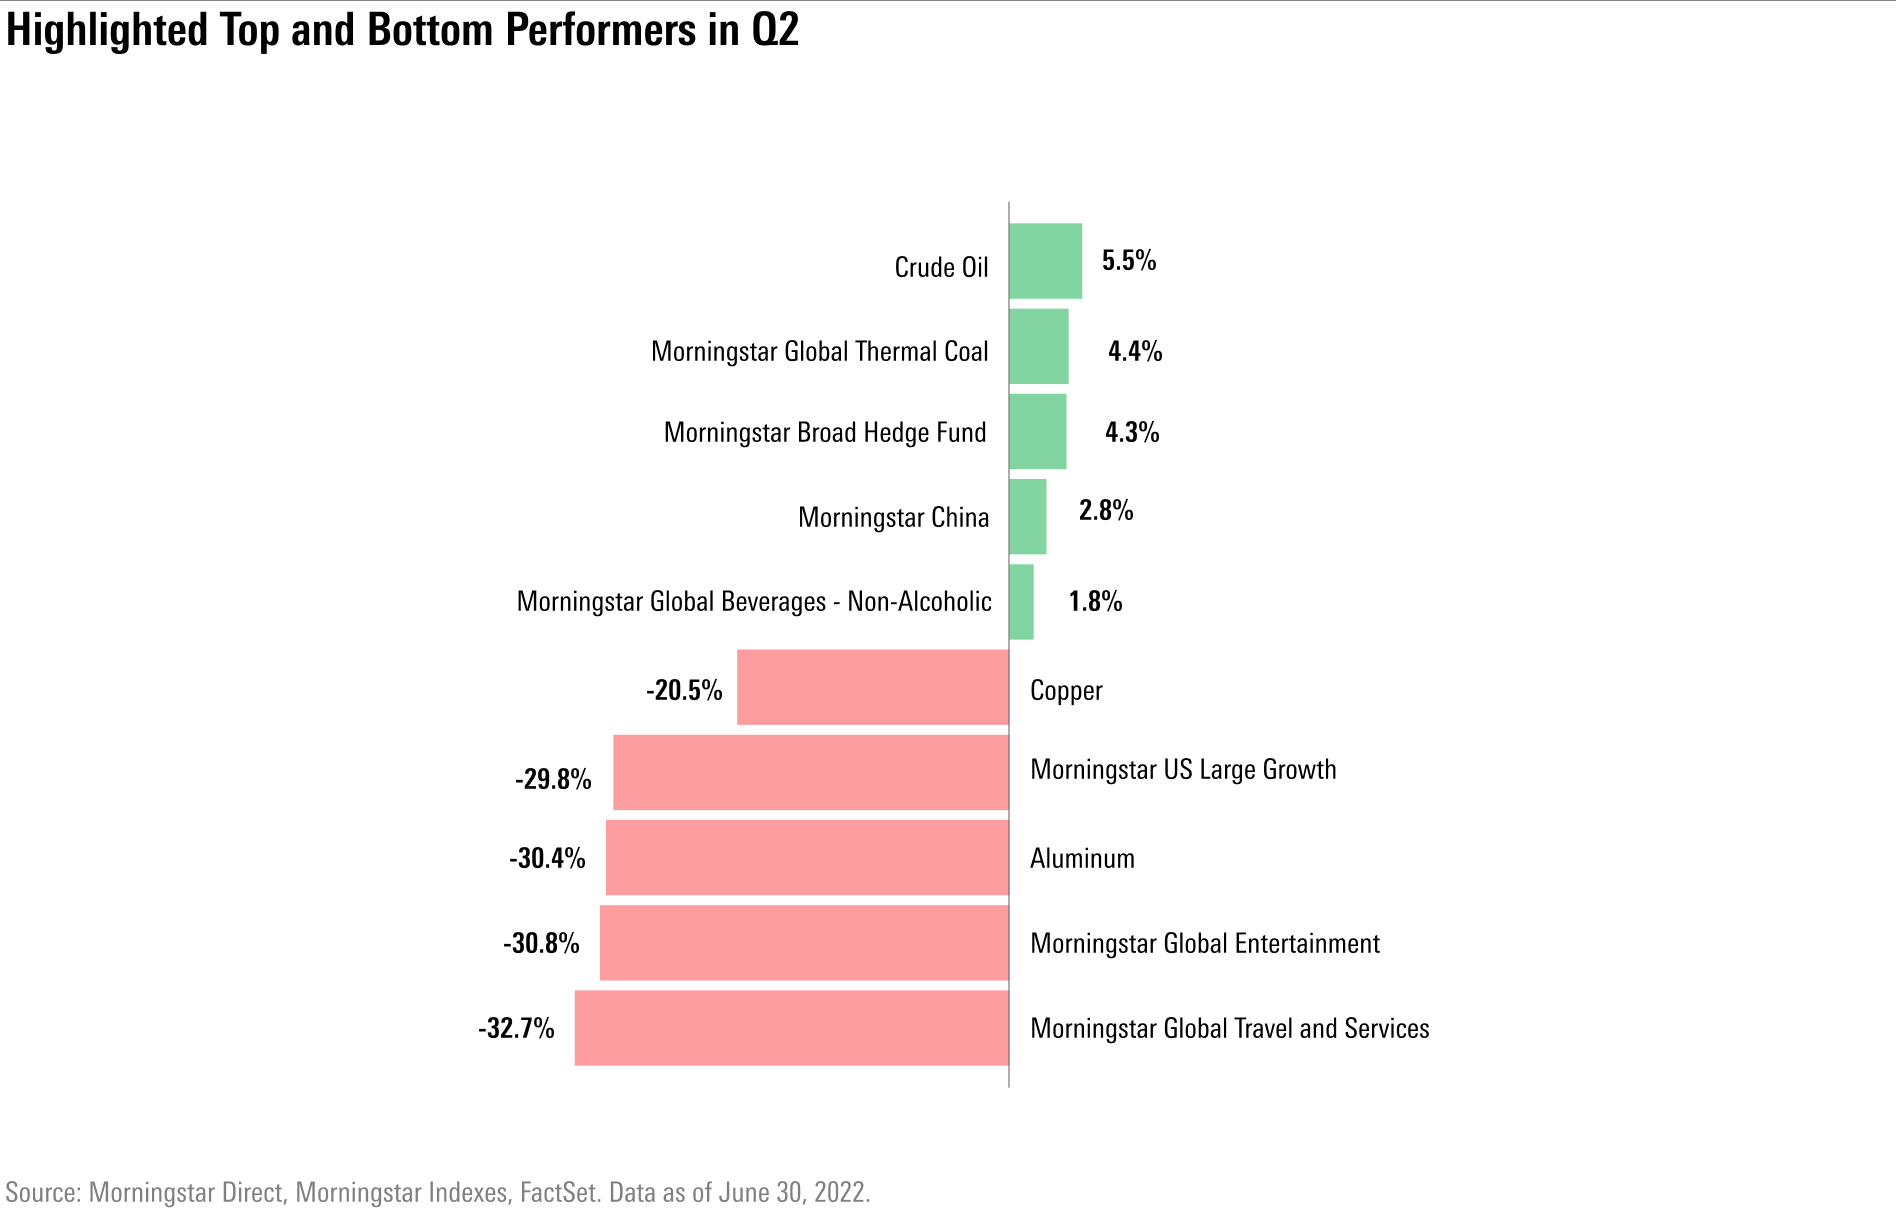
One shift in the market could be seen in the performance of industrial metals. With concerns growing over the course of the quarter about the potential for the U.S. economy to slide into recession as a result of the Fed’s rate increases, these commodities took a hit. That included copper, sometimes seen as a bellwether for economic activity, down 20.5%, and aluminum, down 30.4%.
Rounding out the worst performers were U.S. large company growth stocks. A decline of 29.8% for the Morningstar Large Growth Index was its biggest drop since falling 28.7% in the fourth quarter of 2000.
Also taking a hit was the Morningstar Global Entertainment Index, which contains companies in the movie, television, media, and movie theater businesses. Losses there were led by declines in shares of Walt Disney DIS and Netflix NFLX.
Stocks
While stocks closed out the first half of the year in a bear market, equities started off the quarter extending gains from a late-first quarter bounce. However, with economic data showing continued strong job and wage gains, and inflation at a 40-year high, expectations for more aggressive interest rate increases from the Fed sent the market tumbling again.
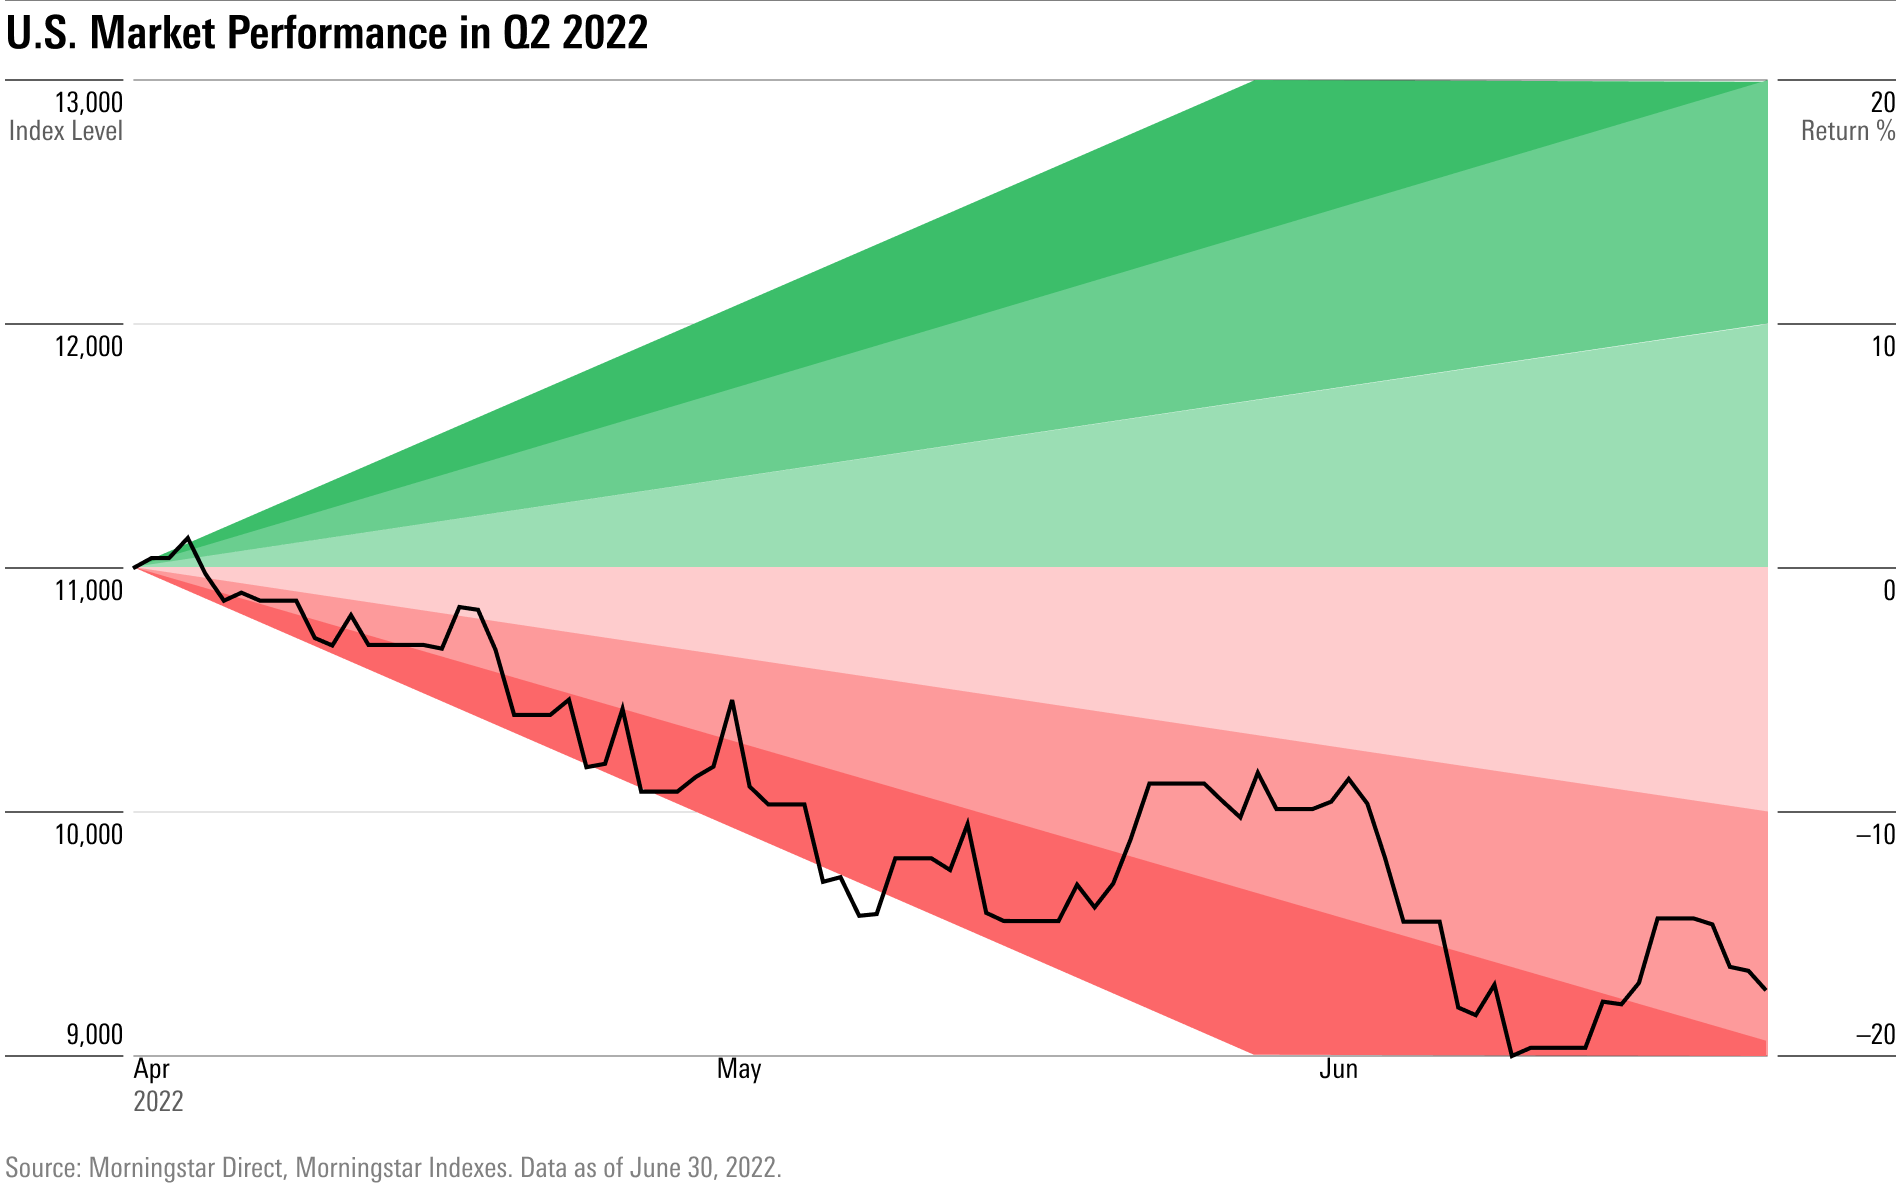
While stocks flirted for some time with breaking into an “official” bear market, the tipping point came amid growing concerns that the Fed would have to raise interest rates so aggressively that it would push the U.S. into a recession.
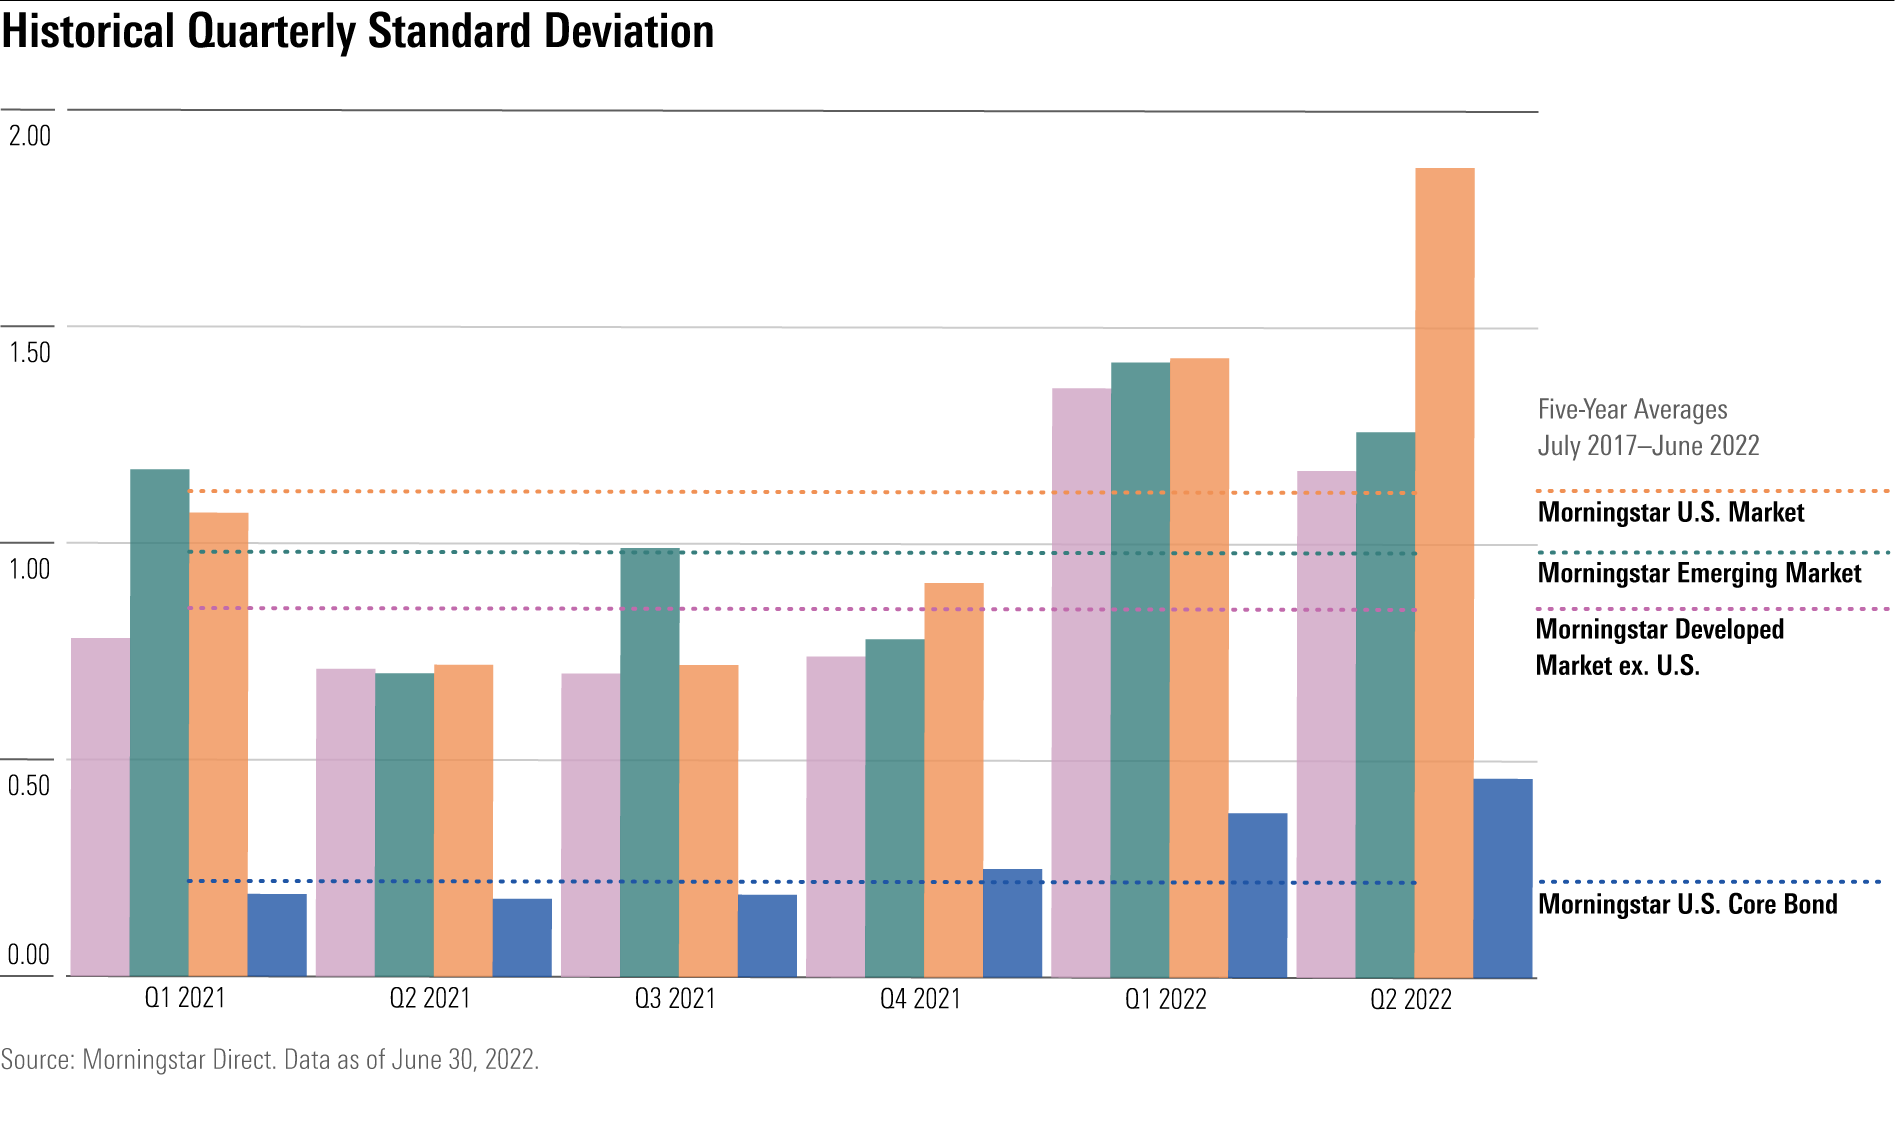
With the selloff came continued high levels of volatility in the stock market. The quarter had 10 days where the market moved 2% or more compared to a median of two days between 2019 and 2021. Much of the volatility has come as investors have had to repeatedly reset expectations for how fast and how high the Fed will raise rates and as investors have begun to fear the risk of recession.

When it came to volatility, the uncertainty around the Fed and interest rates meant the bond market was also much more volatile than usual.
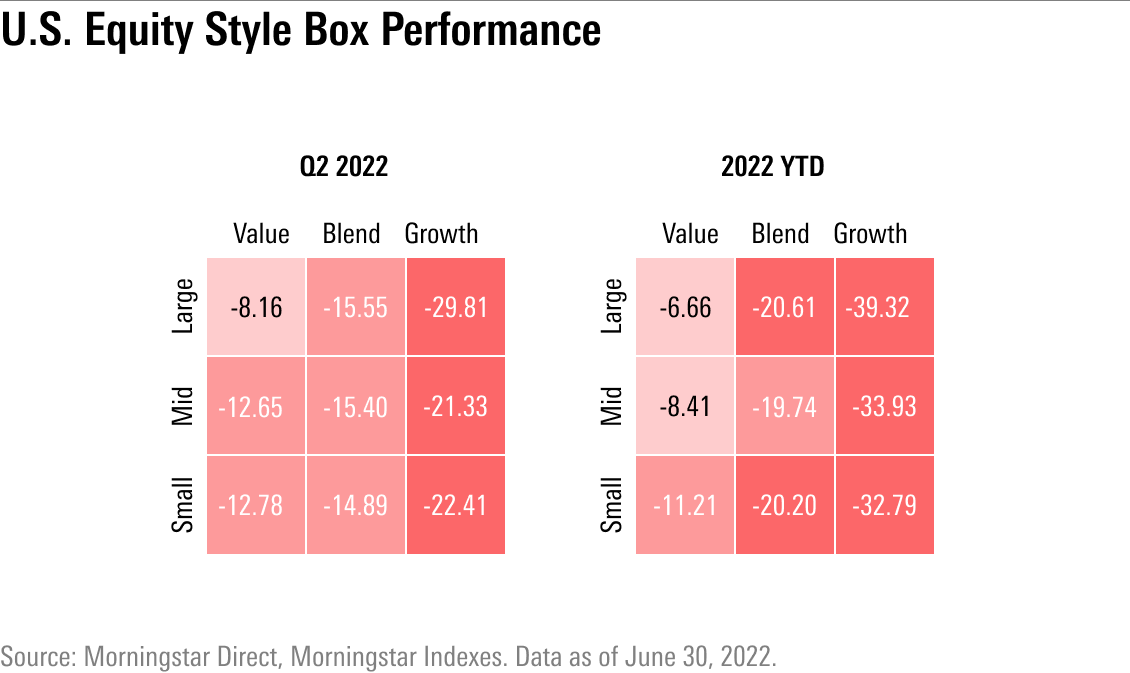
In Stocks, Value Trumps Growth
Within the stock market, the dominant trend continued to be the fall of growth stocks and the relatively buoyancy of value stocks. The Morningstar US Growth Index lost 25.3% in the quarter, its worst performance since the financial crisis in 2008. Meanwhile, Morningstar's US Value Index fell 9.4%.
Large-value stocks, as measured by the Morningstar US Value Index, declined 8.2%. The large value index was bolstered by healthcare companies such as Pfizer PFE, which rose 2.1%, and Bristol-Myers Squibb BMY, up 6.2%. American multinational oil and gas company ExxonMobil XOM also led large value gains with returns of 4.8%.
Large-growth stocks dragged the rest of the style box down, as tech giants Amazon and Tesla each lost about 35%. Nvidia NVDA, which makes up 3.0% of the Morningstar US Large Growth Index, fell 44.4% for the quarter.
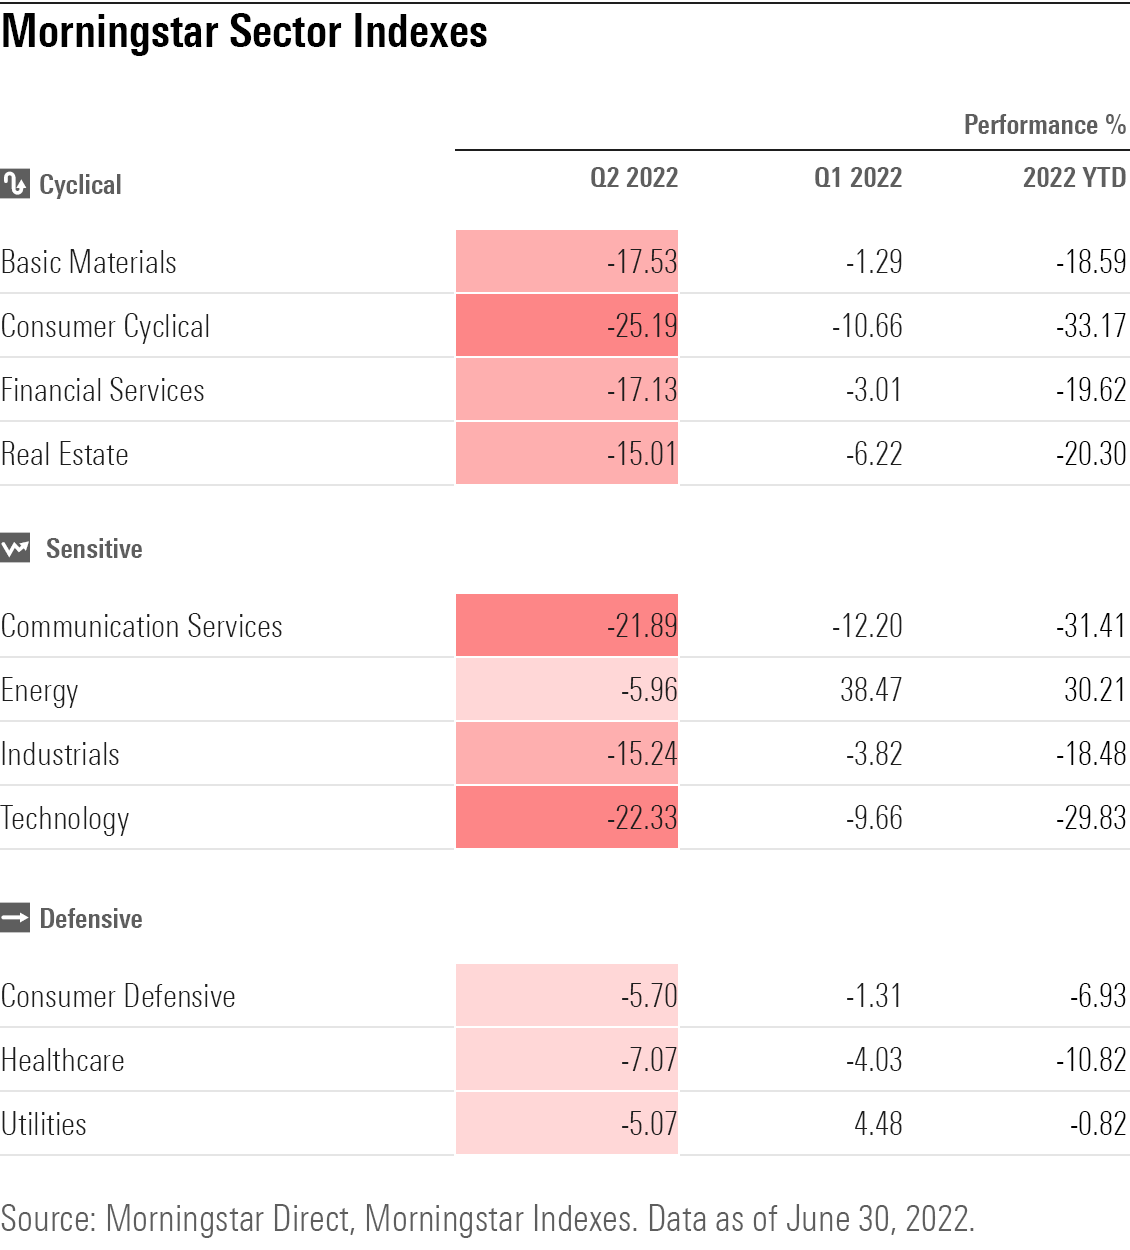
Sector Performance
At the sector level, defensive areas of the market lived up to their reputation and held up best during the downdraft. Sectors include healthcare, utilities, and consumer defensive, all of which provide services that are required in both good and bad times. Generally, stocks in these categories are considered less volatile and less affected by the ups and downs of long-term market cycles.
Among defensive stocks that posted gains in the quarter were pharmaceutical giants Eli Lilly LLY, up 13.6%, and Merck MRK, which gained 12.0%. Consumer staples stocks Dollar General DG and Monster Beverage MNST also made the list of leading market contributors.
High-growth market sectors, including consumer cyclical and technology, took the hardest hits as former market leaders including Amazon and Tesla each lost over 35% for the quarter. This year the Morningstar US Technology Index has dropped 29.8% and the Morningstar Consumer Cyclical Index is down 33.2%.
The energy is the only U.S. market sector in positive territory for the year, up 30.2% despite losses of 6.0% in the quarter.
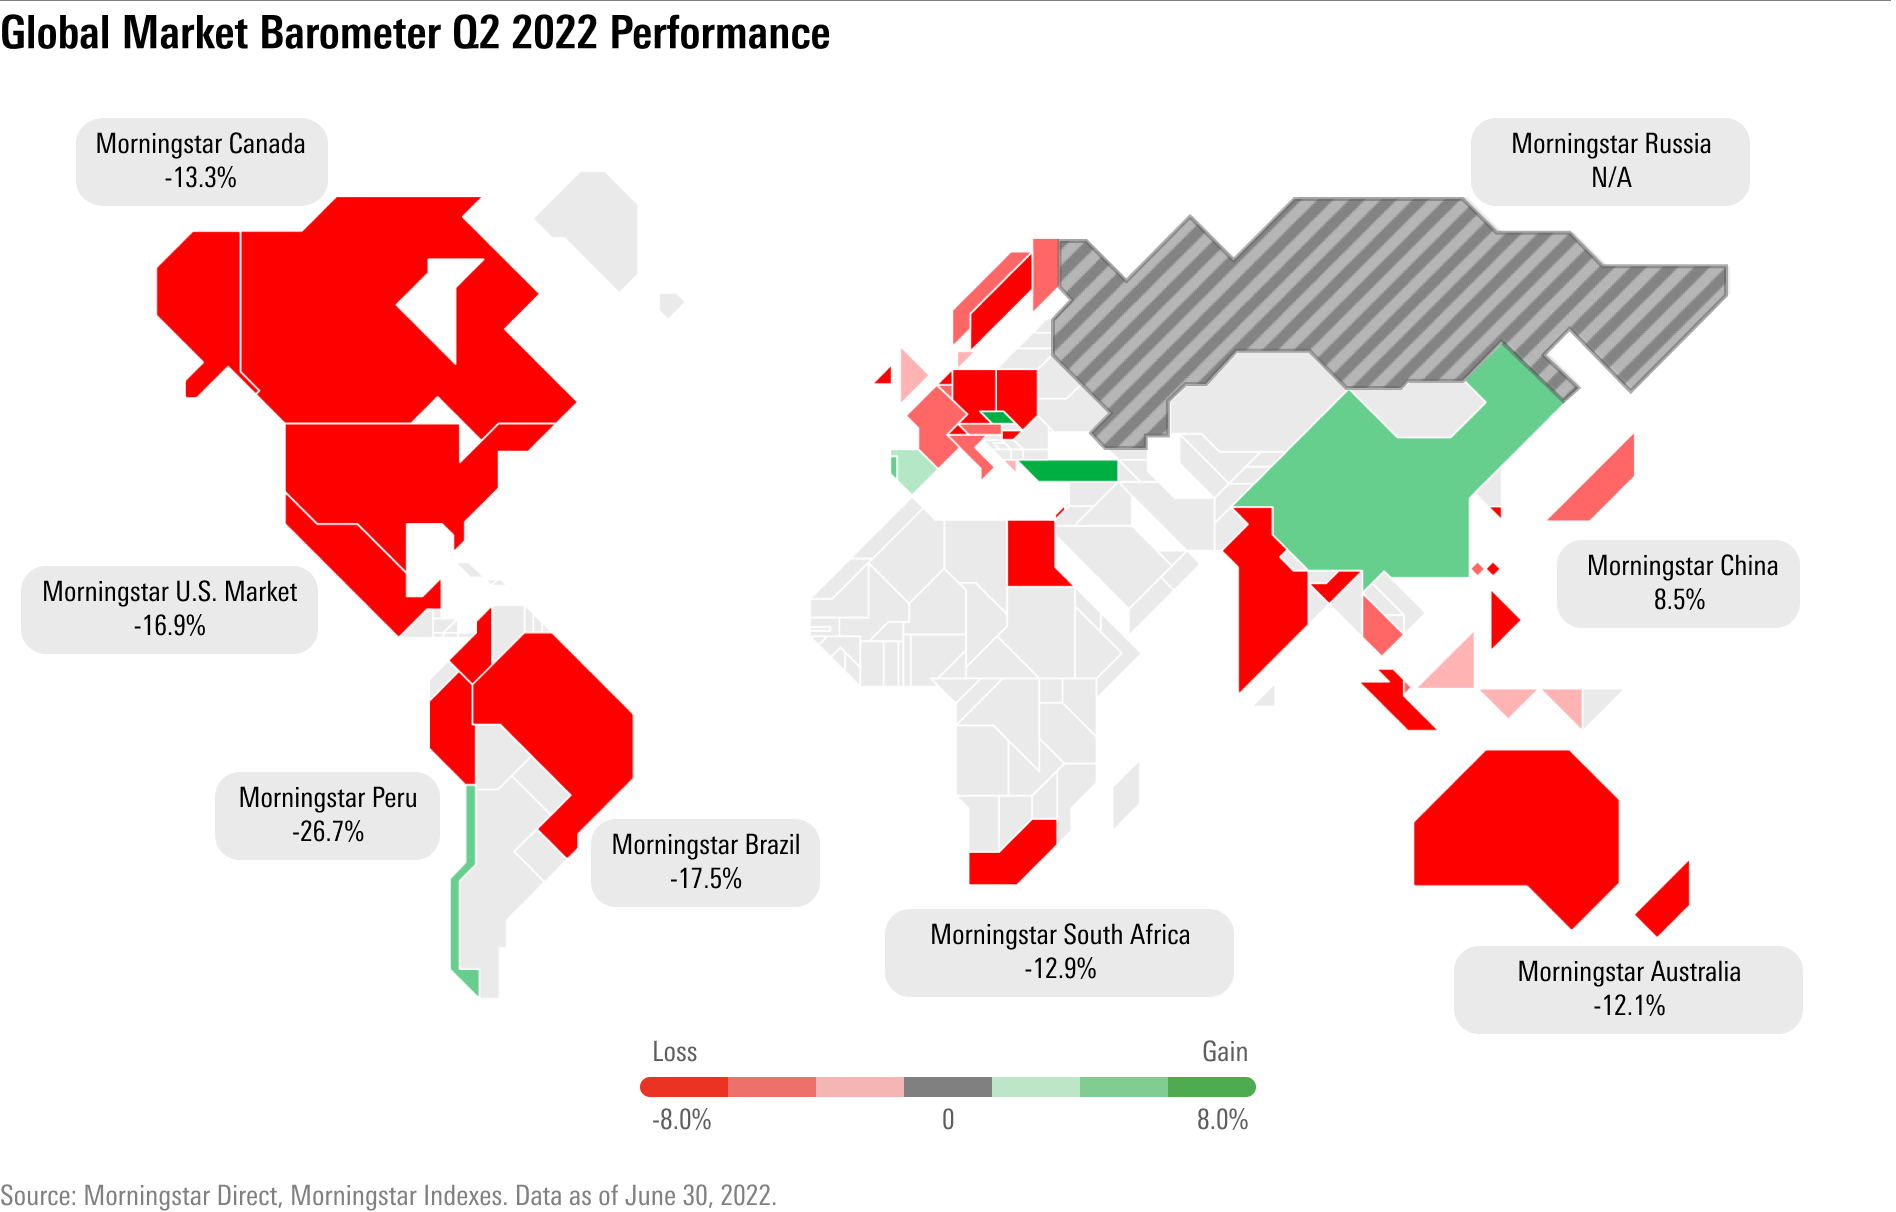
Emerging Markets
Markets across the globe fared poorly in the quarter, with one notable exception.
China began the quarter with its markets under pressure from continued regulatory actions against on key internet and consumer companies, the specter of delisting of U.S.-traded shares for some firms, and Covid lockdowns in major cities.
However, by quarter’s end, Chinese authorities released a set of measures to jumpstart the economy and eased some Covid restrictions. The Morningstar China Index ended the quarter up 8.5%, which followed a decline of 13% in the first quarter. Retail giant Meituan MPNGY, up 31.6% and agricultural sales platform Pinduoduo PDD, up 54.1%, helped lead the country’s strong performance.
Second Quarter Bond Market Performance
Bonds of all kinds ended the quarter in the red, as the rise in yields and decline in prices seen during the first quarter rolled on. Only at the tail end of the second quarter did the selloff abate as investors responded to economic data showing hints of a slowing in growth and an easing of inflationary pressures.
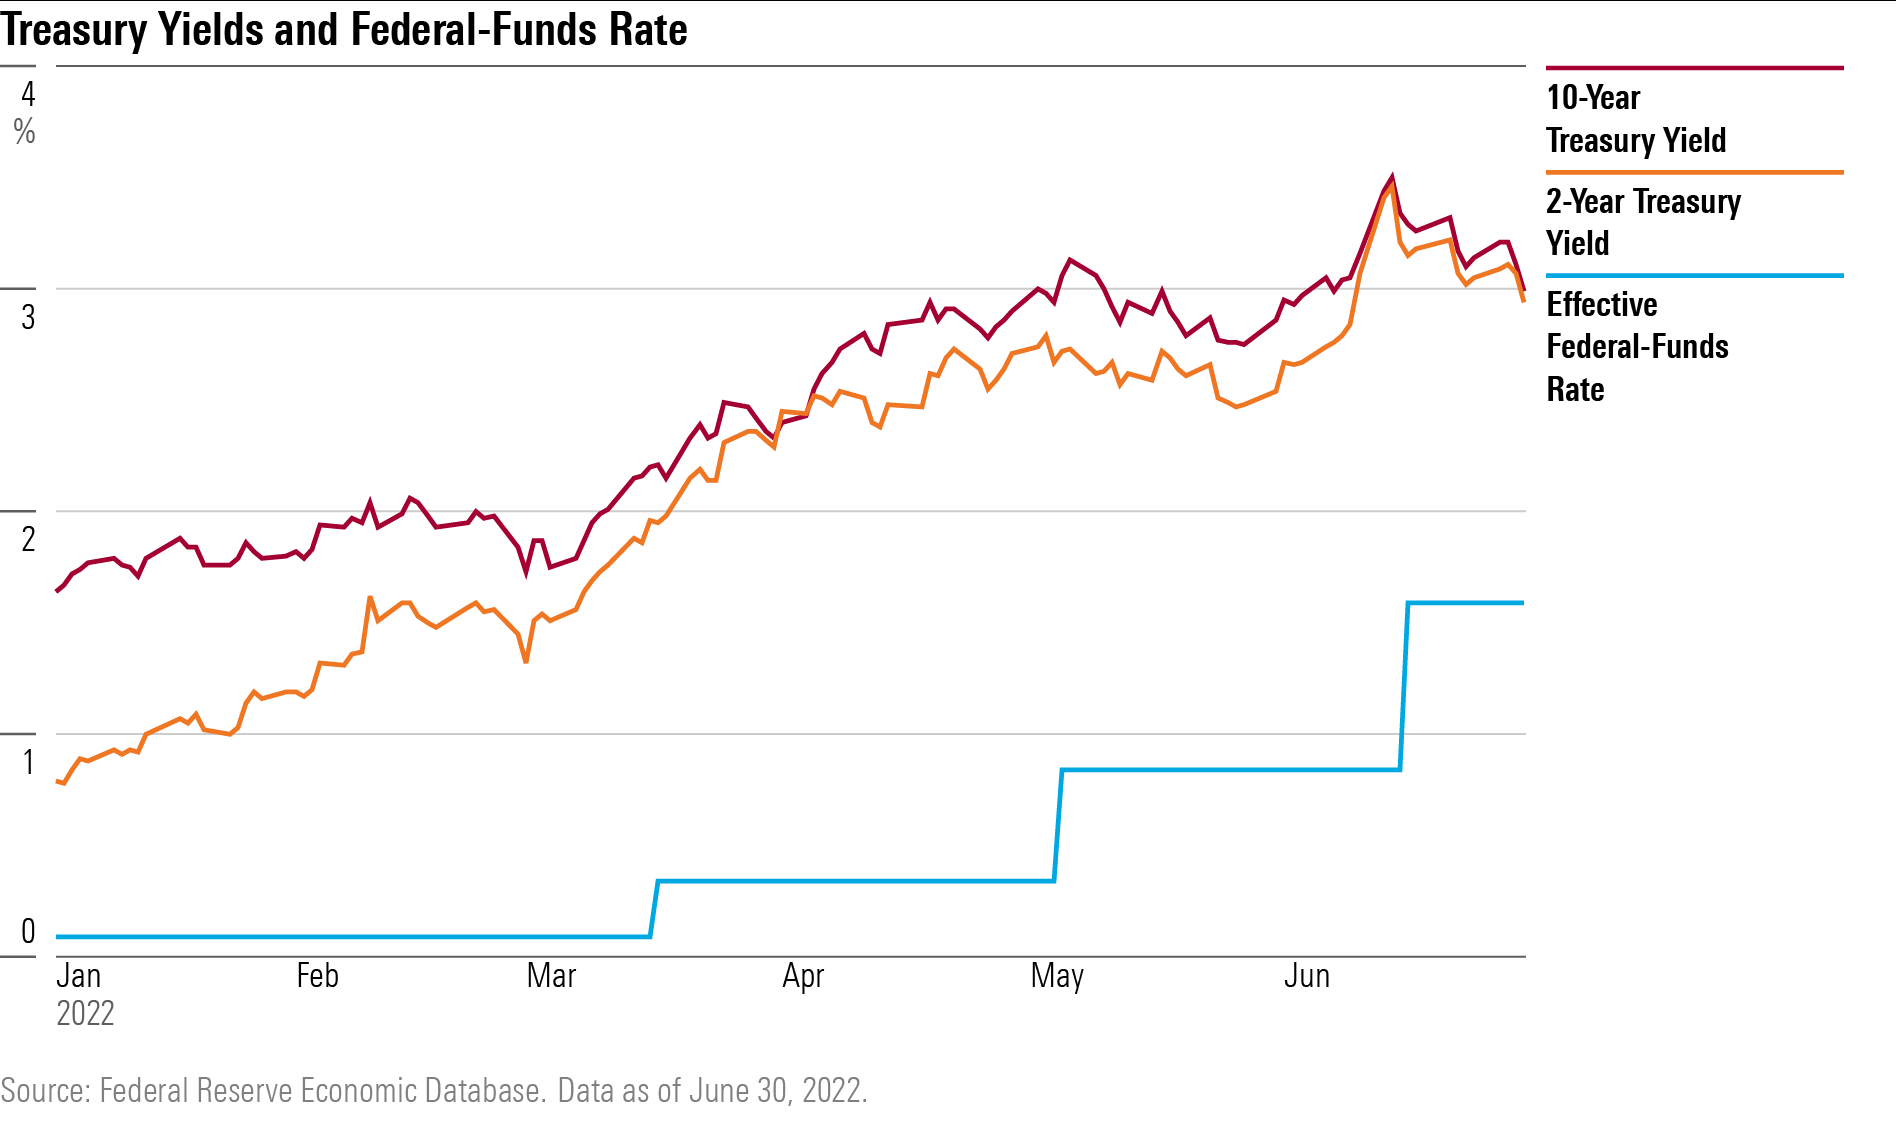
Yields rose across the bond market. The U.S. Treasury 10-year note climbed to a high of just shy of 3.5% in mid-June and finished the quarter at 3.2%. That was up from 2.3% at the start of the quarter and 1.5% at the end of 2021. Meanwhile, the yield on the U.S. Treasury 2-year note finished within shouting distance of the 10-year at 3.1%, up from 2.28% at the end of March and 0.73% at the end of December.
Driving the selloff was the Fed’s aggressive interest rate increases. The central bank raised rates twice during the quarter, in both cases ramping up the size of the moves in the federal-funds rate. After raising the rate by a quarter of a percentage point in March, the Fed amped up its effort with a half-point boost to the funds rate in May, and a three-quarters of a percentage point increase in June.
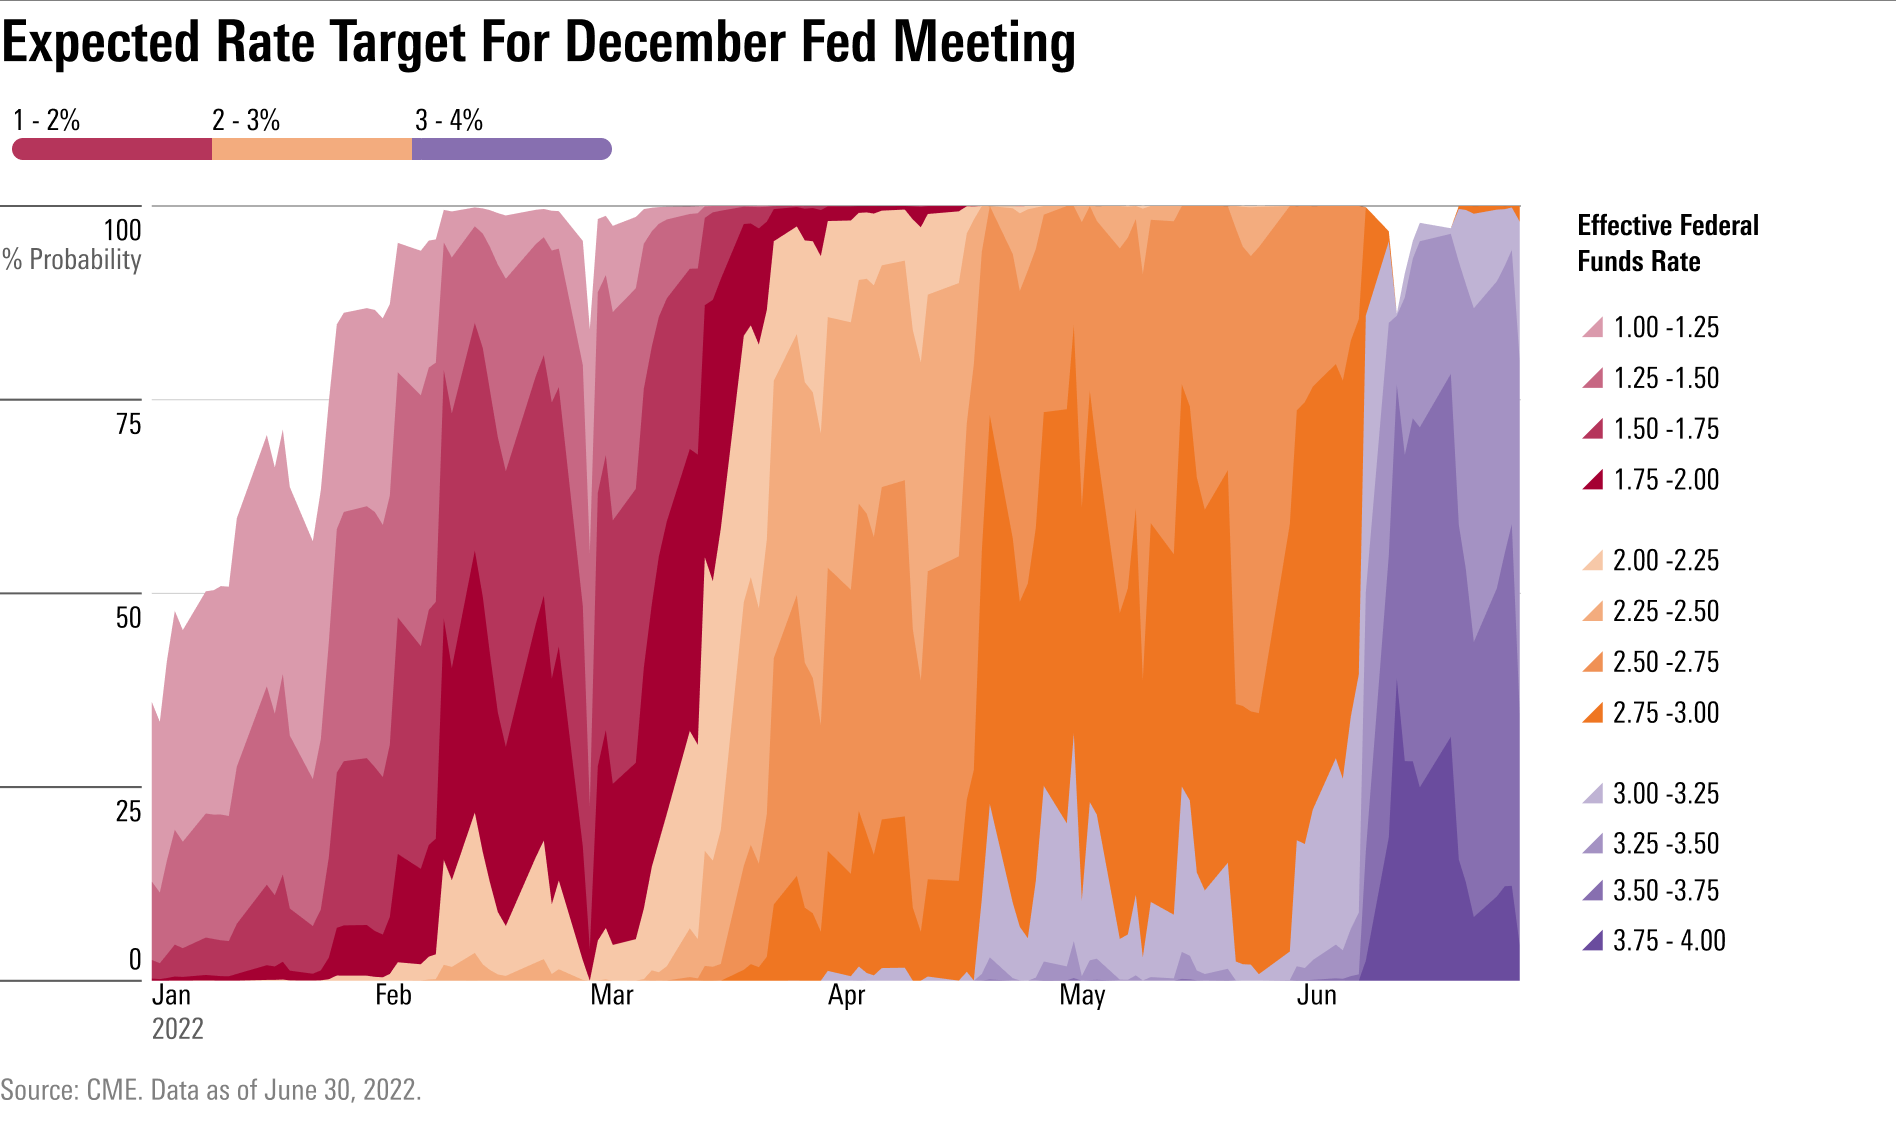
Underlying the rise in yields were big changes in expectations for Fed policy. To start the year, investors had only expected moderate interest rate hikes from the Fed. For most of the first quarter, the Fed was only seen raising the federal-funds rate to around 2% by year end, according to the CME Fedwatch tool.
During the second quarter those expectations changed rapidly. In response to higher-than-expected readings in inflation, and comments from Fed officials suggesting a more aggressive response, investors took expectations for the year-end funds rate toward 3% in May, and then far above 3% by the end of the quarter.
These rising yields and expectations for a Fed moving faster and higher translated into losses across the bond market.
Long-term bonds took a heavy punch thanks to their vulnerability to rising interest rates. The Morningstar US 10+ Year Core Bond Index fell 12.1% and the Morningstar US 10+ Year Treasury Bond index lost 11.6%. At the same time, government bonds saw losses across the globe, as the Morningstar Emerging Markets Sovereign Bond Index dropped 11.4%, and the Morningstar Global ex-US Treasuries Index fell 12.9%.
Bonds with less sensitivity to changes in interest rates held up relatively well. For example, the Morningstar US 1-5 Year Core Bond Index lost 1.2%.
What Happened to Crypto in the Second Quarter?
As bad as the quarter was for stock and bond investors, it was much worse in the cryptocurrency market.
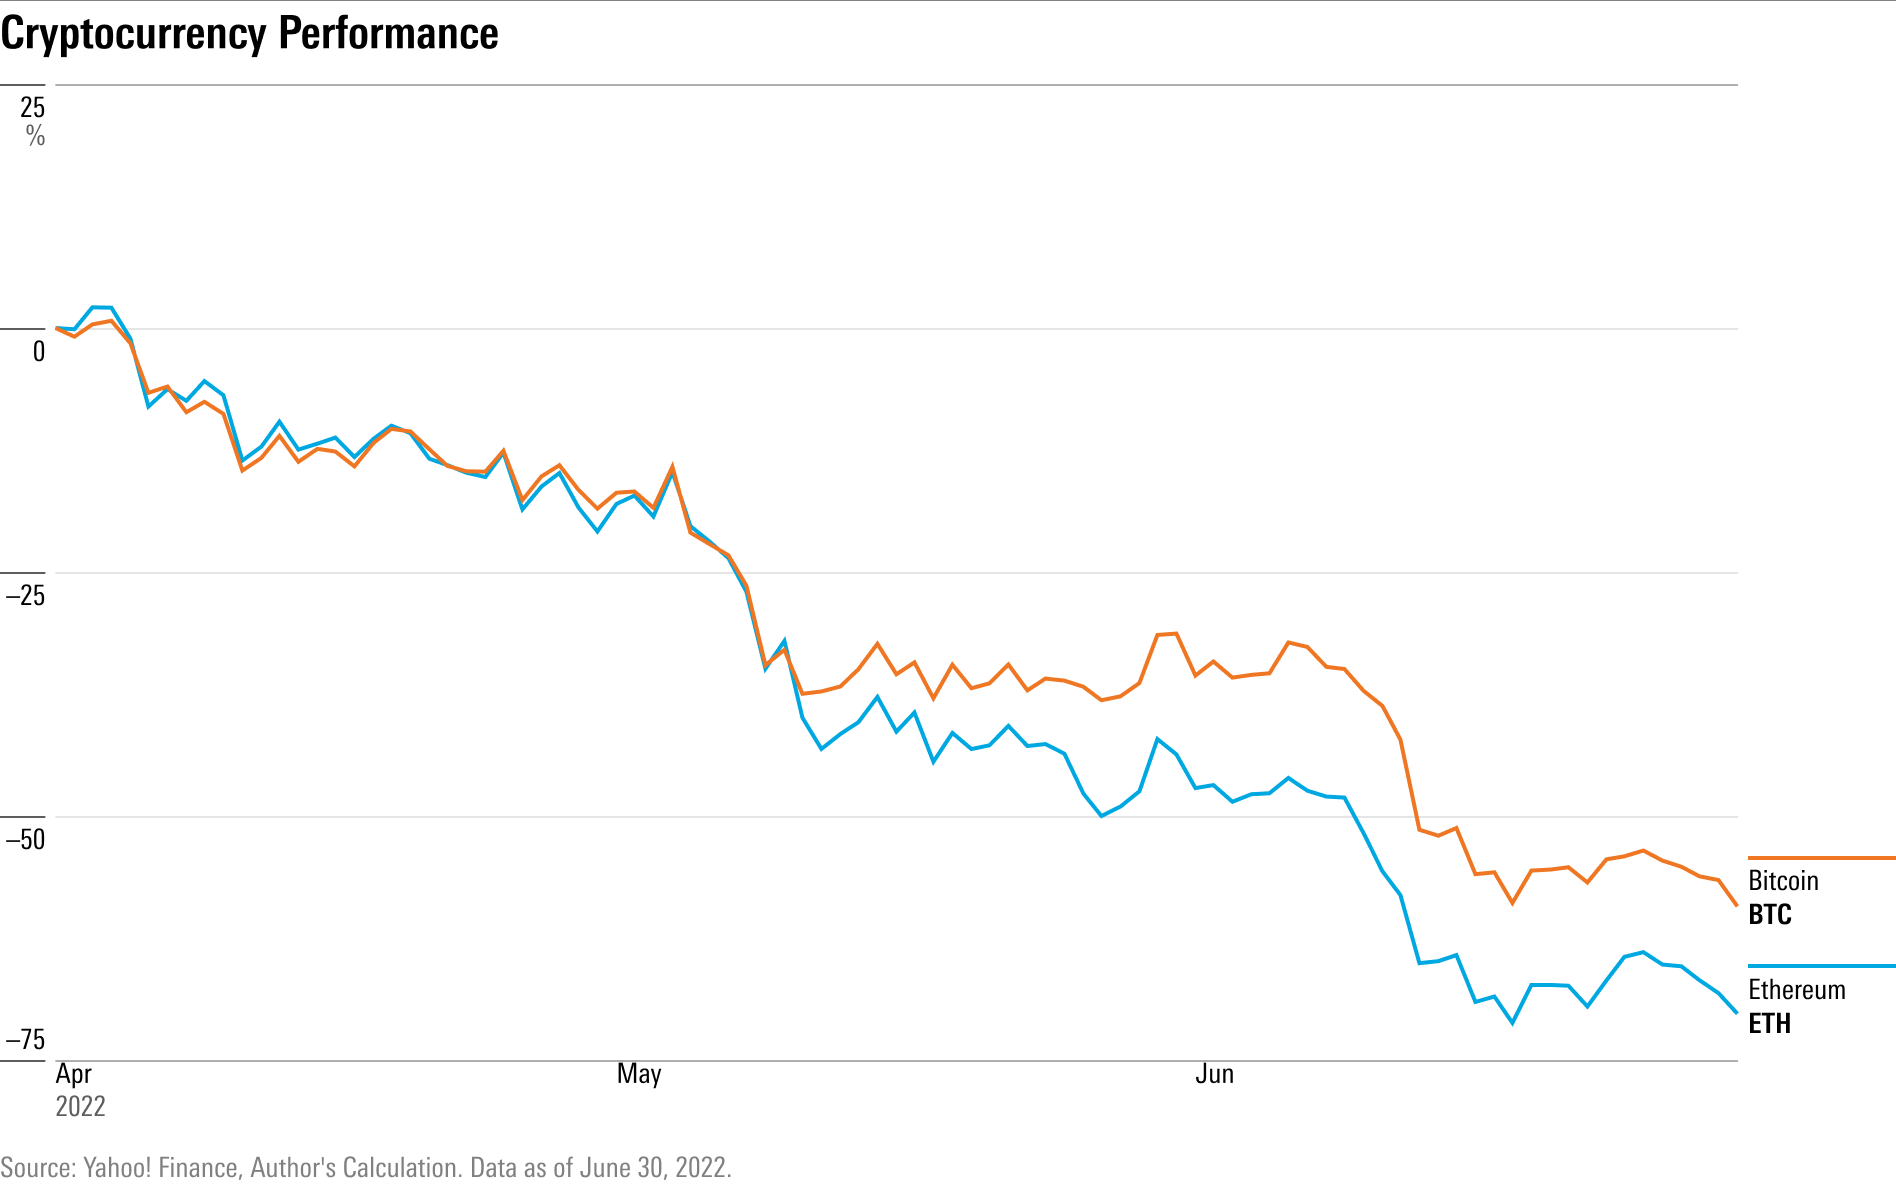
The price of Bitcoin, the first cryptocurrency and the largest by market size, fell 56.5%. After starting the quarter at $46,282, Bitcoin prices dipped below $20,000 on June 18 for the first time since December 2020, ending the quarter at $19,784.73.
Though cryptocurrencies have been highly volatile for their entire history, losses of this size have never been seen for any quarter since the first Bitcoin began trading in 2014. The price of Ethereum, the second-largest cryptocurrency by market cap, tumbled 67.5%.
One of the largest crypto lenders halted withdrawals, crypto-focused businesses laid off employees and even stablecoins, which were designed to avoid the kind of volatility common to cryptocurrencies, were taken through the ringer. Luna, the parent company of popular stablecoin Terra, cratered from its $116 high on April 6 to trade at lows of $0.008 on May 12.
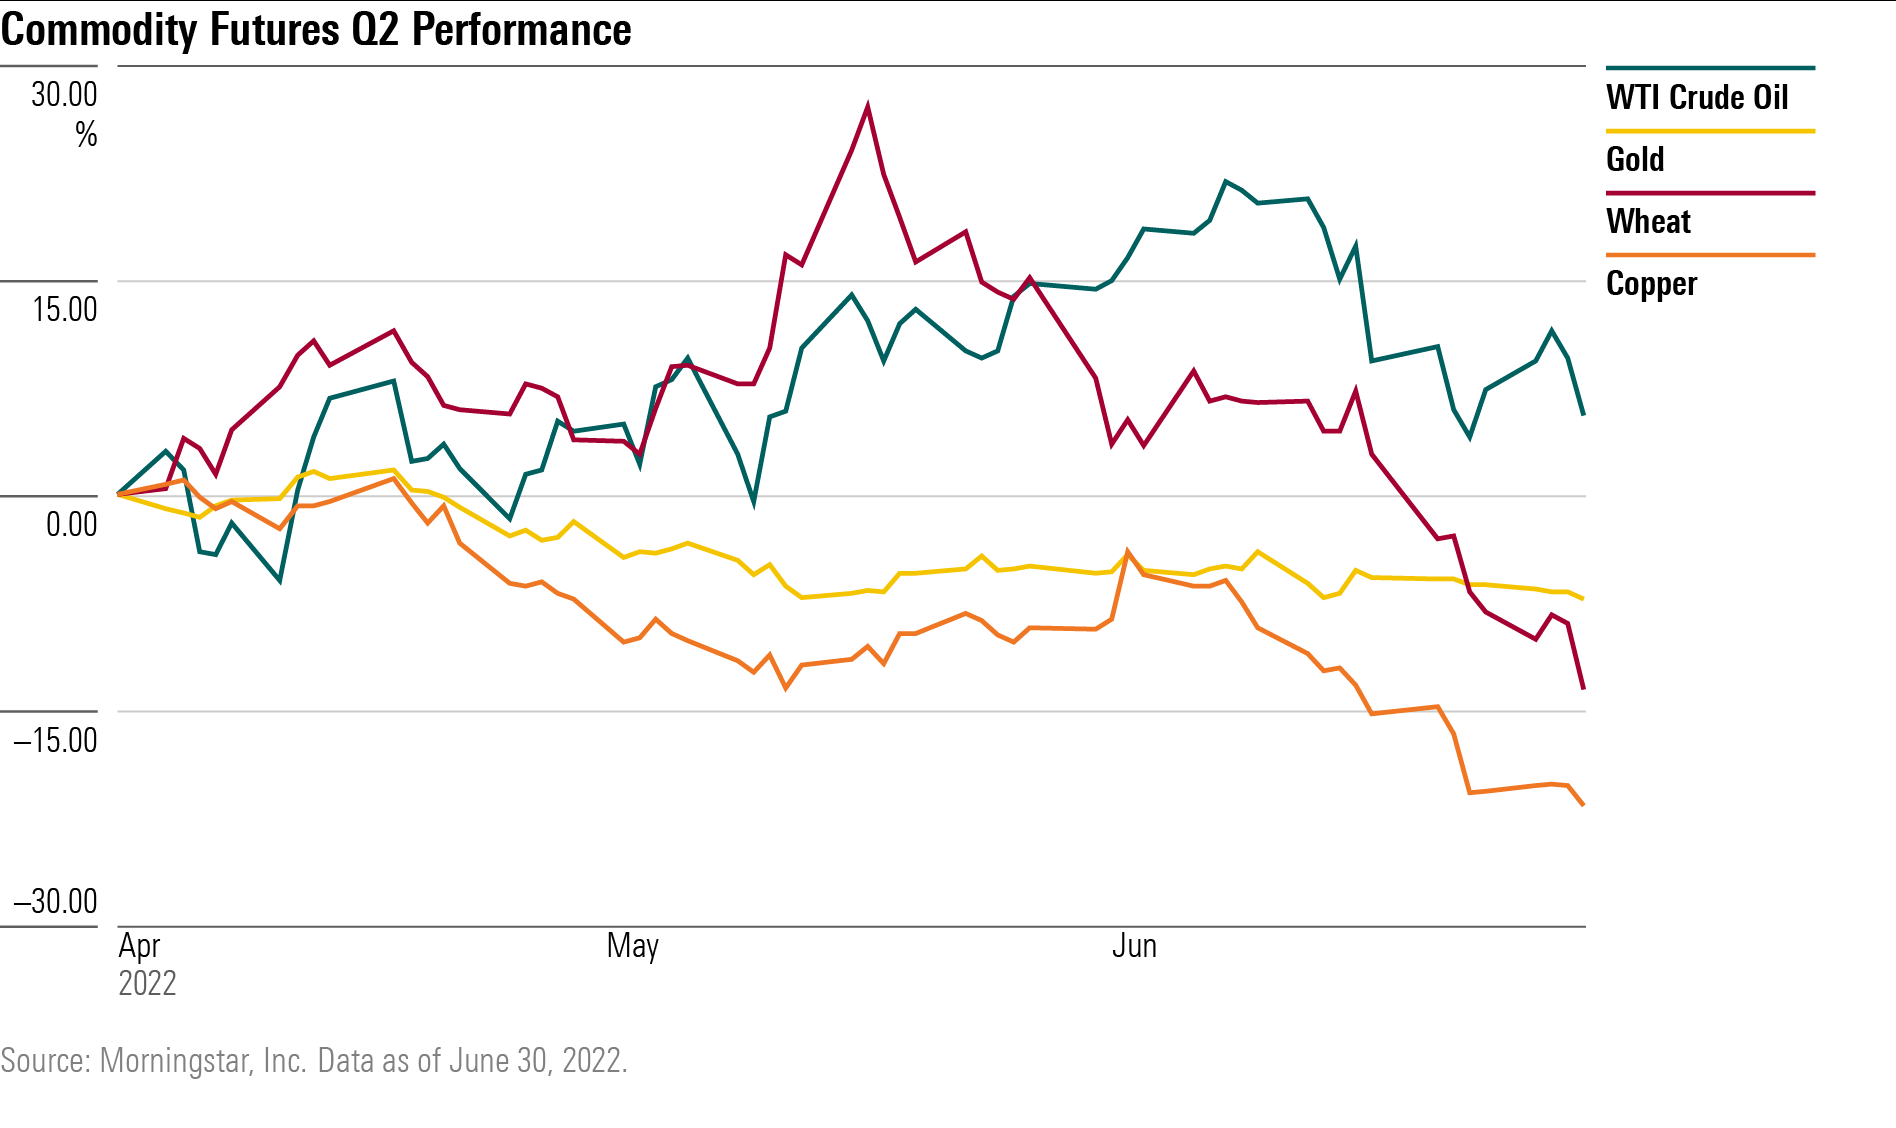
Commodities
It was a mixed picture for commodities in the second quarter as oil prices extended their climb due to Russia’s war against Ukraine. At the same time, key commodities including gold, wheat, and copper declined.
Gold prices fell, ending the quarter down 7.3% and are down 4.5% for the year. The metal has failed to meet expectations as an inflation hedge: $10,000 invested in gold at the beginning of the year would have fallen to $9,550 as consumer prices rose quickly.
One sign of continuing concerns in the global economy was the performance of industrial metals, with copper down 20.5% in the quarter. The metal is used as an input in production and equipment for a wide range of industries.
/cloudfront-us-east-1.images.arcpublishing.com/morningstar/F2S5UYTO5JG4FOO3S7LPAAIGO4.jpg)
/cloudfront-us-east-1.images.arcpublishing.com/morningstar/7TFN7NDQ5ZHI3PCISRCSC75K5U.png)
/cloudfront-us-east-1.images.arcpublishing.com/morningstar/QFQHXAHS7NCLFPIIBXZZZWXMXA.jpg)
:quality(80)/s3.amazonaws.com/arc-authors/morningstar/ba63f047-a5cf-49a2-aa38-61ba5ba0cc9e.jpg)