
Fixed-Income Funds Headline Positive ETF Flows in May
ETF investors pile into bond portfolios in another roller-coaster month in the markets.
/s3.amazonaws.com/arc-authors/morningstar/30e2fda6-bf21-4e54-9e50-831a2bcccd80.jpg)
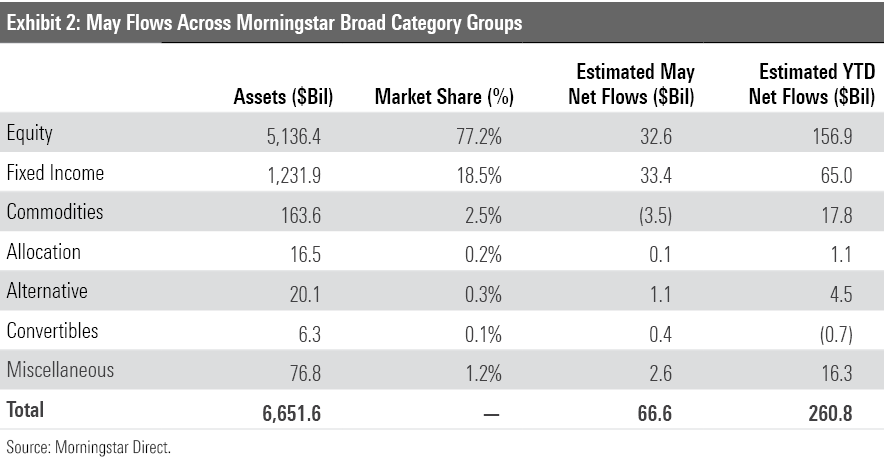
After their first month of outflows since 2018 in April, U.S. exchange-traded funds rebounded with $66.6 billion of inflows in May. Stock ETFs course-corrected, adding $32.6 billion of new money. But it was fixed-income funds that led the way. The $33.4 billion they collected last month exceeded their haul over the previous four months combined.
The Morningstar Global Markets Index, a broad gauge of global equities, scratched out a 0.03% gain across a turbulent May. The benchmark slid 4.62% over the first three weeks of the month before rallying just above zero to close out the month. It was a smoother run for the Morningstar U.S. Core Bond Index, a portfolio of U.S. government bonds and investment-grade corporate debt, whose 0.53% return snapped a streak of five consecutive months of losses. The index is still down 8.97% for the year-to-date—its worst start to a year in 22-plus years of recorded performance.
Here, we’ll take a closer look at how the major asset classes performed last month, where investors put their money, and which corners of the market look rich and undervalued at month’s end–all through the lens of ETFs.
U.S. Bonds Bust Their Slump
Exhibit 1 shows May returns for a sample of Morningstar Analyst-rated ETFs that serve as proxies for major asset classes. A blended global portfolio advanced 0.33% in May. In a mixed month for the portfolio’s bond sleeve, Vanguard Total International Bond ETF BNDX slid 0.67%, while domestic counterpart Vanguard Total Bond Market BND clawed back some of its recent losses with a 0.83% return. Are yields attractive enough to ensure bonds stay in demand? Do current prices accurately reflect future interest-rate hikes? Such questions should help decide whether last month marked the end of U.S. bonds’ bear market or merely a reprieve for bond investors.
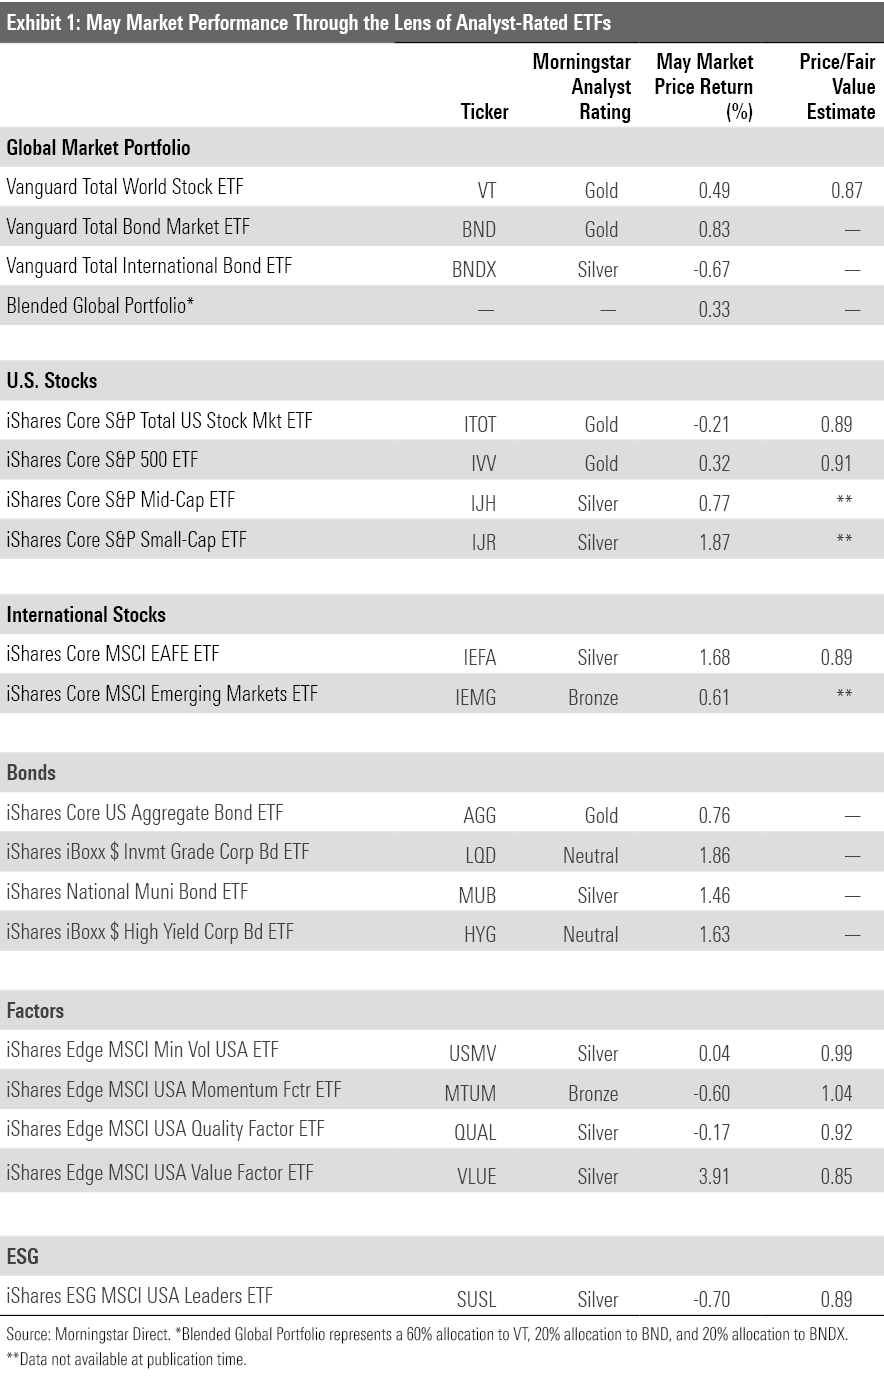
Vanguard Total World Stock ETF VT, which comprises the blended portfolio’s stock sleeve, chipped in a 0.46% May return. Foreign stocks pushed the fund ahead. Vanguard Total International Stock ETF VXUS finished the month 1.52% higher than it started, with solid contributions from developed- and emerging-markets stocks alike. Asian markets fared particularly well. Japanese and Taiwanese stocks both turned in solid performance, and Chinese companies shook off their recent pandemic-induced woes to help the cause. The Morningstar China Index climbed 1.25% in May, its first positive month since October 2021.
U.S. stocks didn’t see the same success. Vanguard Total Stock Market ETF VTI peeled back 0.25% in a roller-coaster May that included a 5.68% drawdown over the first three weeks of the month. However, positive earnings reports and an encouraging inflation report revitalized the market toward the end of the month, making May 23-27 VTI’s best week since November 2020. It remains to be seen how durable the market’s bounce will be, but investors surely welcomed the surge.
May was another difficult month for growth stocks. Vanguard Growth ETF VUG slid 2.74% while its value-oriented counterpart, Vanguard Value ETF VTV, climbed 2.33%. Growth stocks tend to be more sensitive to interest rates because their anticipated cash flows lie further in the future. So, the Federal Reserve’s insistence that more half-point interest-rate hikes lie on the horizon has acutely stung growth companies. Several prominent growth firms have faced their own unique problems this year, too. The latest among them is Tesla TSLA, which declined 12.92% in May as investors questioned CEO Elon Musk’s focus. Apple AAPL, Microsoft MSFT, and Amazon.com AMZN–fellow behemoths that occupied VUG’s top three spots last month–all finished May in the red as well.
Energy stocks have powered much of VTV’s performance this year, and May was no exception. In a hit-or-miss month across the market’s sectors, five of State Street’s Select Sector SPDR ETFs posted gains while five endured losses. Energy Select Sector SPDR ETF XLE once again rose to the top with a 16.03% return. Some energy powerhouses that have soared with oil prices this year, like ExxonMobil XOM and Chevron CVX, are prominently featured in VTV. Combined with the value portfolio’s penchant for defensive sectors like consumer staples and utilities, it comes as little surprise that VTV outperformed its growth twin by 22.4 percentage points for the year to date through May.
IShares MSCI USA Value Factor VLUE is another value fund that notched a solid May, but it takes a much different tack than VTV. Since this fund tethers its sector biases to the broad market, it did not benefit from statistically cheaper sectors’ success as much as unconstrained value portfolios. Rather, the fund carved out its advantage last month by leaning heavily into the cheapest stocks within each sector, like General Motors GM in the consumer discretionary space. VLUE has been the best performer in the iShares suite of strategic-beta funds this year, but iShares MSCI USA Minimum Volatility Factor ETF USMV, which is constructed to hold up well in volatile markets, has fared relatively well, too.
Bond Funds Beef Up
Flows into fixed-income ETFs outpaced those into stock portfolios for the second consecutive month in May. Bond ETFs raked in $33.4 billion, a sum that exceeded their collective inflows from January through April. Even as bonds have posted their worst performance in decades, investors rushed into these funds as stock portfolios have also floundered this year.
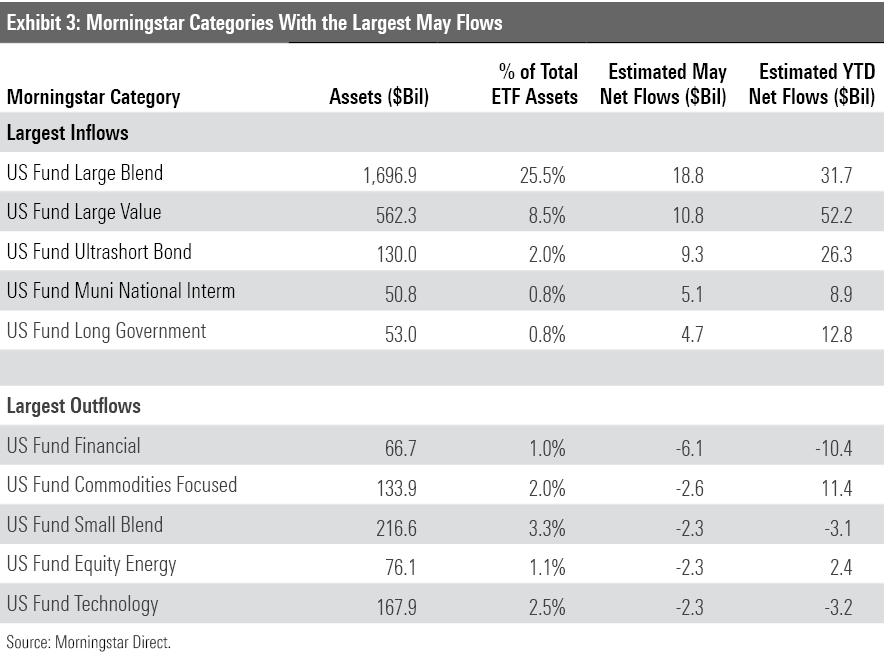
Government bond funds have consumed most of the flows into fixed-income ETFs. The long-, short-, and intermediate-term government Morningstar Categories all cracked the top-10 in category inflows in May. Government bond funds also claimed much of the new money that investors poured into the ultrashort bond category, whose $9.3 billion May inflow ranked third among all categories and translated into a 7.7% organic growth rate. At a time when nearly all corners of the market feel unsafe, Treasury funds offer stability. And after a series of interest-rate hikes, they can now offer palatable yield on their virtually credit-risk-free portfolios. That combination has clearly appealed to investors.
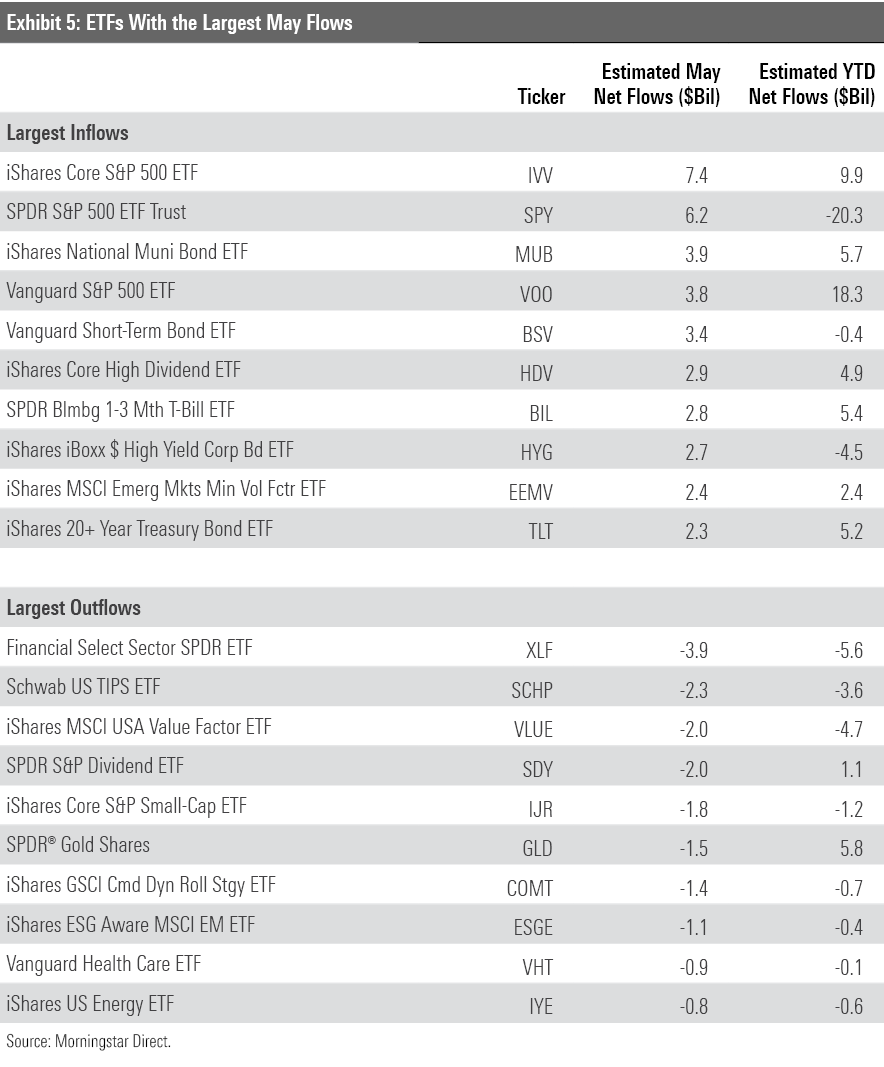
May was a banner month for municipal-bond ETFs. These funds hauled in $6.7 billion in May, a monthly record and a larger sum than they had collected in the prior four months combined. IShares National Muni Bond ETF MUB inhaled more than half of that figure ($3.9 billion). Muni-bond ETFs still represent a small slice of the U.S. ETF market, however. They accounted for only 1.3% of U.S. ETF assets at the end of May, compared with 17.2% for their taxable-bond peers.
Stock ETFs received solid inflows of their own, as they collected $32.6 billion on the heels of a $19.2 billion outflow in April. Investors went back to basics after experimenting with more-niche stock portfolios earlier in the year. U.S. large-blend paced all categories in flows, headlined by a trio of familiar S&P 500 trackers: iShares Core S&P 500 ETF IVV ($7.7 billion), SPDR S&P 500 ETF Trust SPY ($6.2 billion), and Vanguard S&P 500 ETF VOO ($3.8 billion).
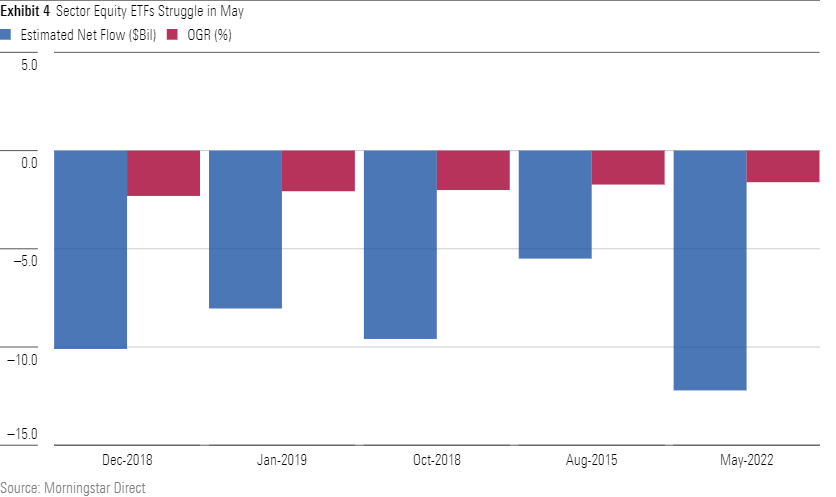
While broad-market stock funds fared well, their more-focused peers did not. Sector stock ETFs collectively bled $12.2 billion in May, their worst monthly outflow to date. That translated into a negative 1.61% organic growth rate that ranked as their fifth-worst of all time and worst since January 2019. The financial, energy, technology, industrial, and real estate categories all leaked more than $1 billion last month. These sectors have turned in a wide range of performance of late. Energy fund investors may have wanted to convert their paper gains to cash, while tech fund investors may have waved the white flag after the stocks’ weak performance.
Flows into commodities ETFs–some of the rare winners so far this year–slowed down in May as well. Focused commodities ETFs, which raked in nearly $14 billion from January through April, leaked $2.6 billion last month. Gold funds were the main culprit, and performance is likely a key factor. After SPDR Gold Shares GLD stamped a 6.6% return in the first quarter, it declined 5.39% over the subsequent two months. Indeed, investors marched into the fund earlier in the year but yanked $1.5 billion from the fund in May. Broader commodities portfolios haven’t maintained their flows momentum, either, as they collectively shed about $974 million in May.
IShares Gets Its Share
The largest ETF provider on the market flexed its heft in May, comfortably leading all fund families in ETF inflows. The $34 billion that iShares collected last month nearly tripled that of its closest competitor, Vanguard ($12.4 billion). Investors poured $22.2 billion into iShares’ fixed-income lineup. MUB led the way in the fixed-income space, but iShares iBoxx High Yield Corporate Bond ETF HYG bears mention as well. After enduring outflows in each month of this year, the fund broke its losing streak with a $2.68 billion inflow in May.
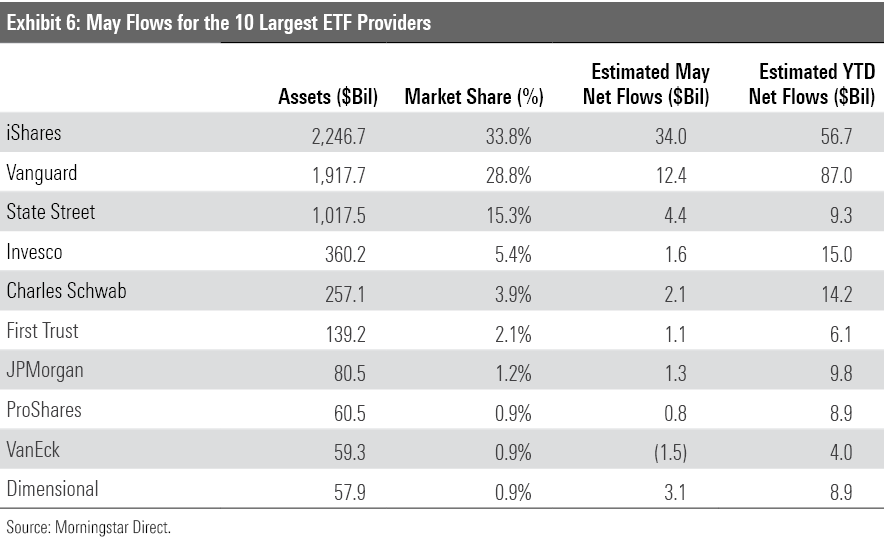
The ETF provider leaderboard welcomes a new constituent this month: Dimensional Fund Advisors, whose $3.1 billion May inflow catapulted it ahead of WisdomTree. DFA first dipped its toes into the ETF pool by converting a pair of mutual funds to ETFs in December 2019. Its inflection point came in June 2021, when it converted a quartet of U.S. stock strategies–including the $13.3 billion Dimensional U.S. Core Equity 2 ETF DFAC–from open-end funds into ETFs to capture the tax advantages of the ETF wrapper. DFAC has led the charge this year with $1.3 billion of inflows for the year to date through April, but it’s been a collective effort. None of the firm’s ETFs have seen outflows in 2022. Together, they’ve raked in $8.9 billion for the year to date.
VanEck was the lone top-10 ETF provider to close May in outflows. About 60% of the fund’s assets under management resides in sector equity funds. After a lucrative April, this lineup of narrowly focused stock ETFs fell out of favor when investors went back to the basics. For example, VanEck Semiconductor ETF SMH–a buy-the-dip darling that collected $1.3 billion in April–came back down to earth, experiencing a $556 million May outflow.
Value in the Pacific
The fair value estimate for ETFs rolls up our equity analysts' fair value estimates for individual stocks and our quantitative fair value estimates for stocks not covered by Morningstar analysts into an aggregate fair value estimate for stock ETF portfolios. Dividing an ETF's market price by this value yields its price/fair value ratio. This ratio can point to potential bargains and areas of the market where valuations are stretched.
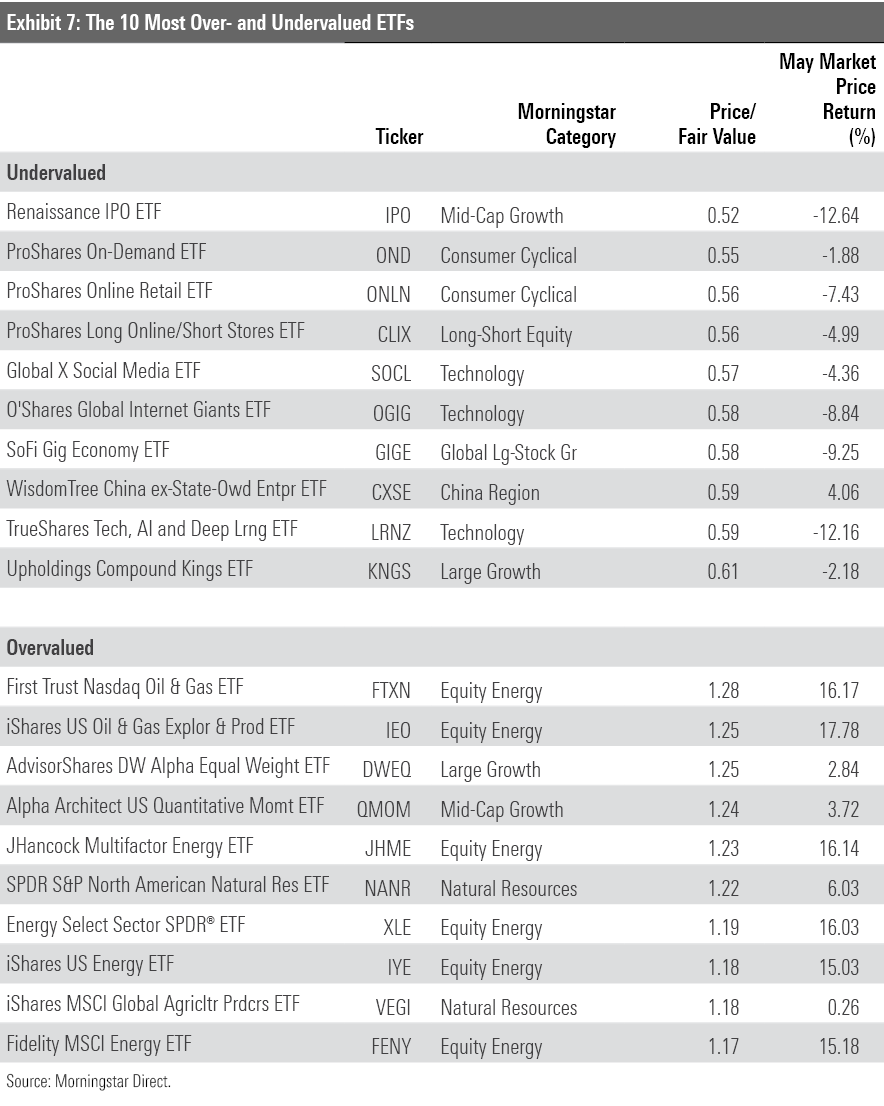
ETFs that home in on some corner of the internet claimed six of the 10 spots on the cheaper half of Exhibit 7, which features funds that traded at the lowest prices relative to their fair value at May’s end. Many of these funds thrived in 2020 as the market rewarded the firms best-suited to navigate the transition to a remote economy, but they have since lost their luster. For example, ProShares Online Retail ETF ONLN is an index fund that tracks a bundle of retailers that focus their operations online or in other non-brick-and-mortar channels. Investors piled into this fund after it skyrocketed 111% in 2020. But the fund lost 54% from the start of 2021 through May. This fund’s rise and fall illustrates the difficulty of timing a thematic fund purchase correctly.
Another month of rising oil prices pushed a slew of energy funds to the most-expensive end of Exhibit 7. At the end of May 2021, XLE sported a price/fair value ratio of 0.87. It soared 76.12% in the 12 months since and now trades at a 19% premium to its fair value estimate. Oil prices may continue to climb as the Russia-Ukraine conflict continues, but stocks with heavy exposure to the commodity don’t look like the bargains they did a year ago.
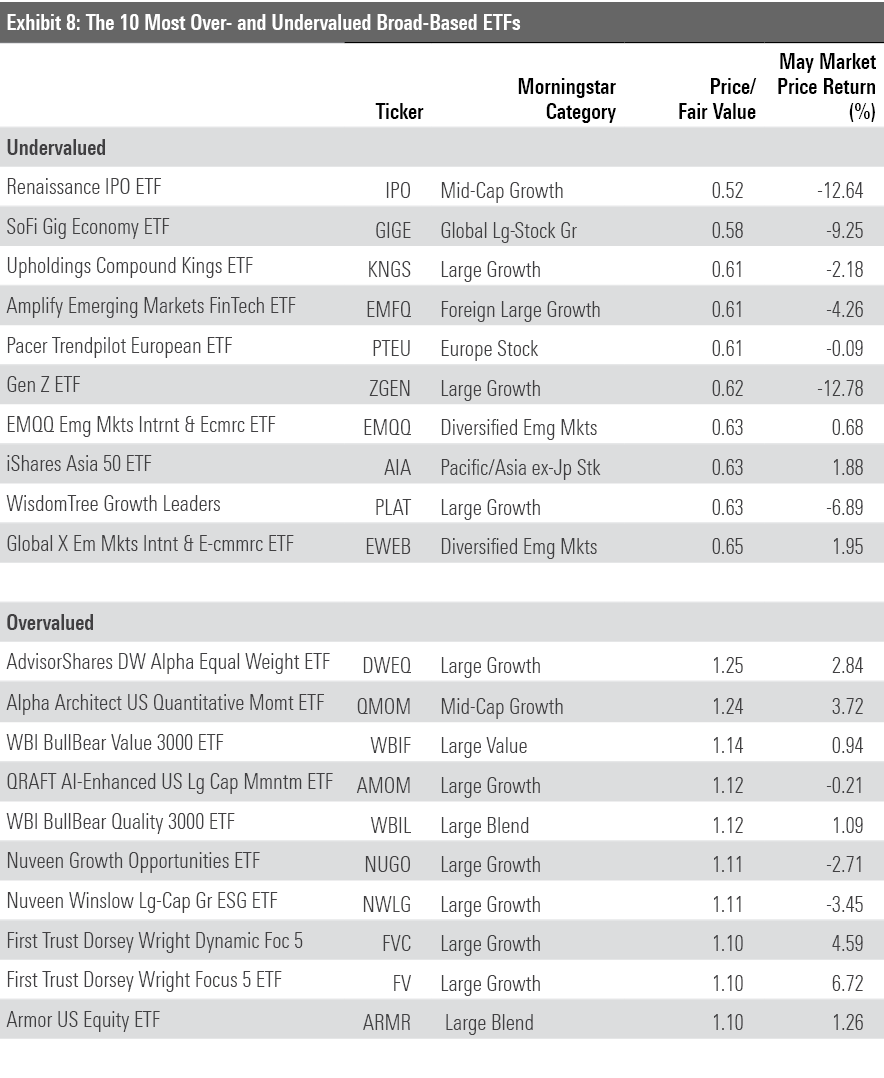
The Pacific/Asia ex Japan category may harbor funds that are currently undervalued. IShares Asia 50 ETF AIA–a cap-weighted portfolio of the largest companies in Hong Kong, Singapore, Taiwan, and South Korea–is the only one to make the cheaper side of Exhibit 8, but each fund with a fair value estimate traded below that estimate at the end of May. This is not the sole product of recent underperformance, either. Funds with limited China exposure, like iShares MSCI Pacific ex Japan EPP, have held up relatively well this year but still look attractively valued.
/cloudfront-us-east-1.images.arcpublishing.com/morningstar/CGEMAKSOGVCKBCSH32YM7X5FWI.png)
/cloudfront-us-east-1.images.arcpublishing.com/morningstar/LUIUEVKYO2PKAIBSSAUSBVZXHI.png)
:quality(80)/s3.amazonaws.com/arc-authors/morningstar/30e2fda6-bf21-4e54-9e50-831a2bcccd80.jpg)