
The Best Total U.S. Stock Market Funds
Few in number, but high in quality.
/s3.amazonaws.com/arc-authors/morningstar/1aafbfcc-e9cb-40cc-afaa-43cada43a932.jpg)

Several Indexes
This column follows last month’s “The Best S&P 500 Funds.”
The challenge for that article was winnowing the field. Several dozen mutual funds and exchange-traded funds have “500” in their names, but the vast majority either invest in a subset of the S&P 500 or are available only to institutions. Once the proper funds were identified, though, ranking them was straightforward, because they all mimicked the same benchmark.
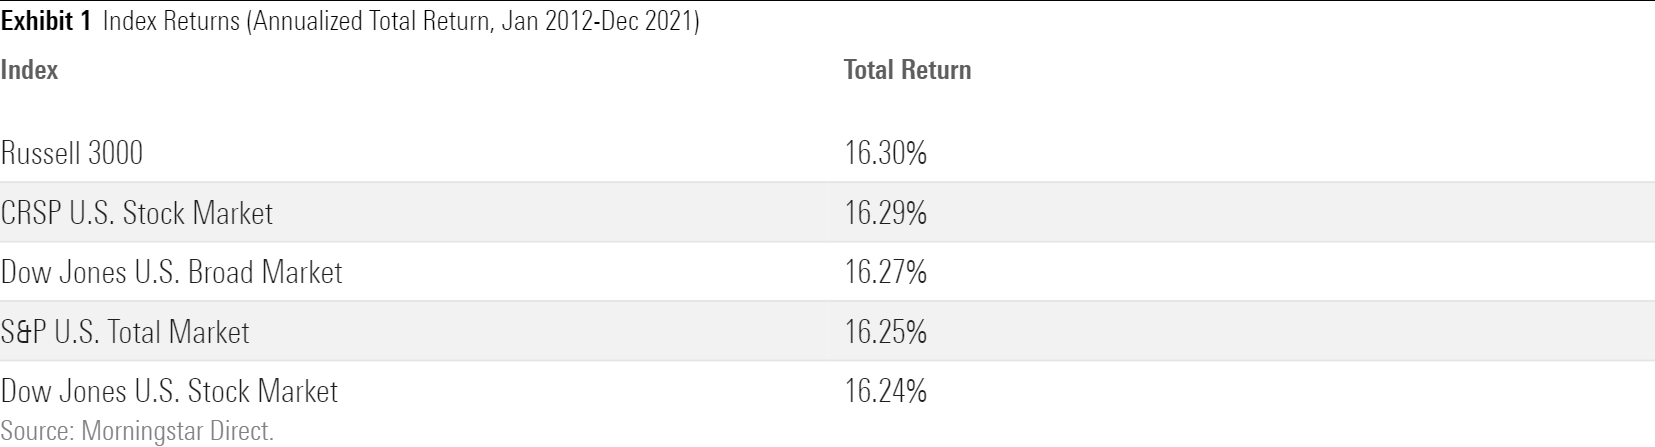
Not so with funds that buy the entire U.S. stock market. Although the Wilshire 5000 Index was once the industry’s total market standard, invariably cited when researchers sought the broadest U.S. stock benchmark, that no longer holds. In fact, of the nine total stock market index funds with 10-year records (retail funds only, cheapest share class), none claims the Wilshire 5000 Index as its benchmark.
As it turns out, the choice of index hasn’t much mattered. For the 10 years from January 2012 through December 2021, only 6 basis points separated the leader from the laggard.
Considering Returns
As it’s anybody’s guess how those indexes will place over the next decade, I won’t judge the nine fund contenders by the benchmarks they emulate. The first element of this article’s three-part scoring system is instead 10-year total returns. Admittedly, that signal is messy, as it blends reliable information (fund costs) with accidents of history (which index performed best, and the direction of the funds’ tracking errors). But at least some credit should be given for accomplishments.
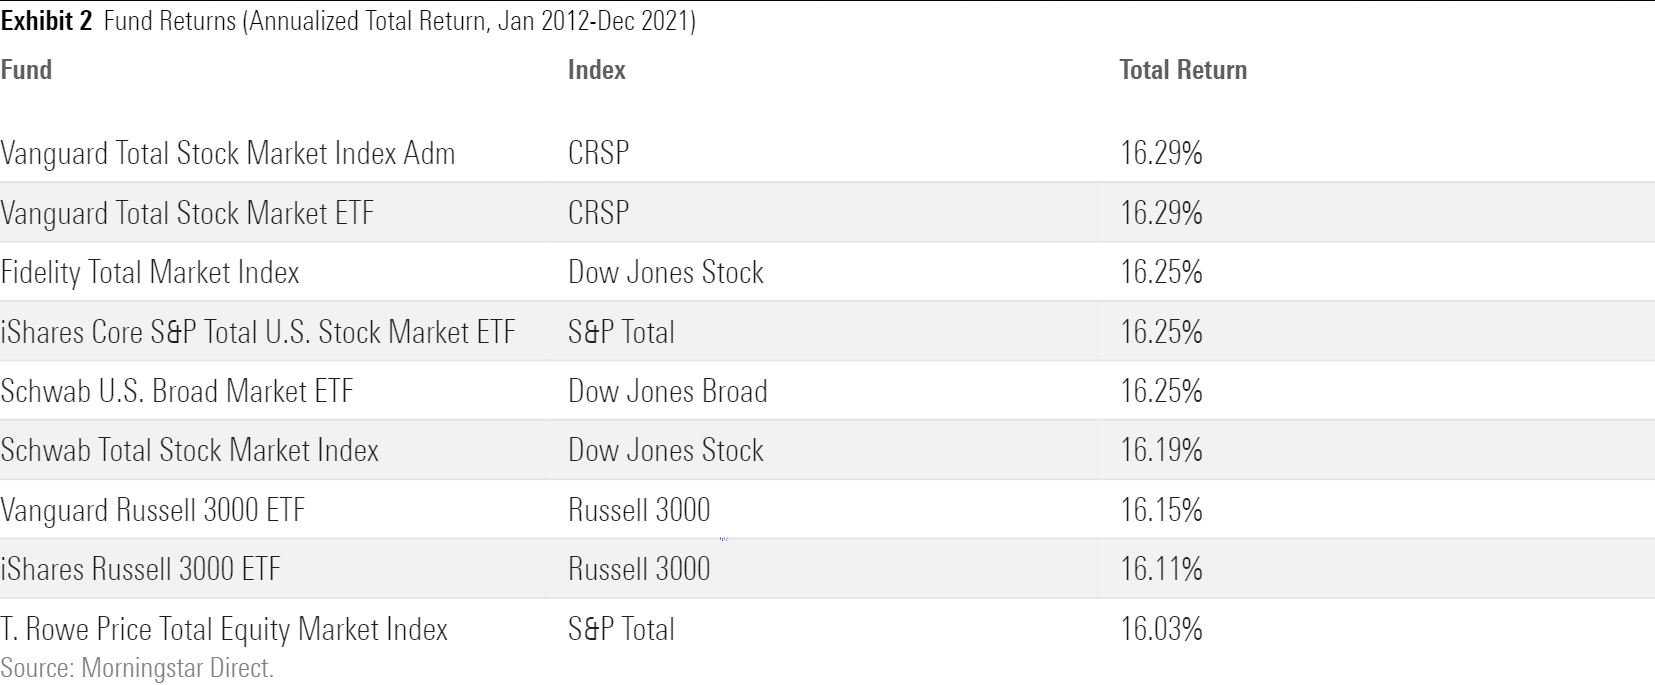
The total-return spread for the nine funds, consisting of four mutual funds and five ETFs, is considerably larger than the spread for the indexes that they mimic. This divergence occurs partially because the funds charge different expense ratios and partially because the funds stray from their benchmarks.
Ultimately, those latter two factors determined how the funds finished. Thus, while the Russell 3000 Index posted the second-highest return among the five benchmarks, the two Russell 3000 Index funds landed near the bottom. Conversely, the Dow Jones U.S. Stock Market Index trailed among the indexes, but was selected by Fidelity Total Market Index FSKAX, which tied for the third-best gain. Further evidence that investors need not fuss over which benchmark a total market fund adopts.
Tracking Errors and Costs
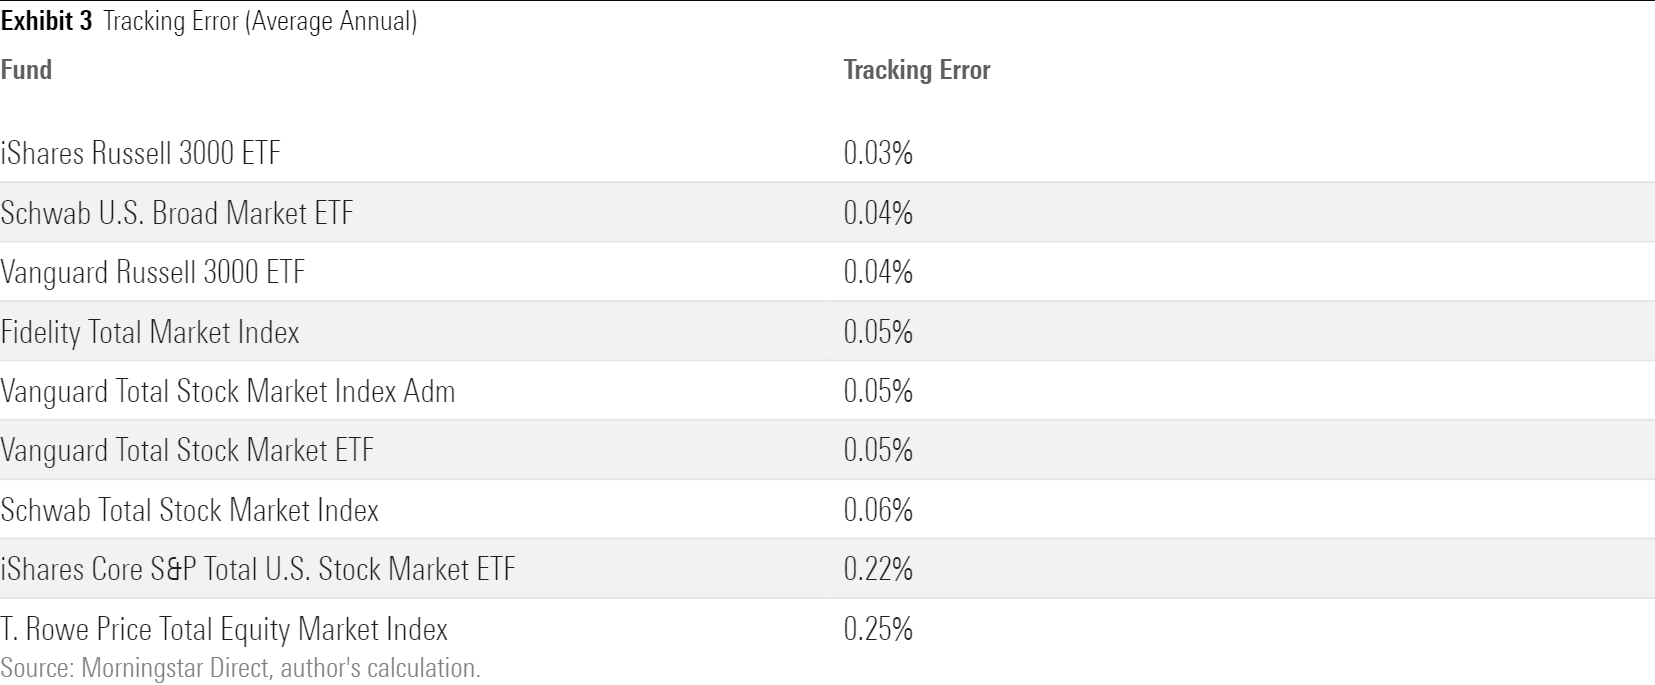
Whereas the top S&P 500 funds almost exactly match their indexes, total stock market funds are less precise. Tracking error is thus a larger issue. To be sure, as tracking error cuts both ways, being as likely to increase a fund’s return as to reduce it, such errors don’t necessarily harm shareholders. Still, as index funds promise to mirror their indexes, it’s fair to penalize their deviations.
The following chart shows the average annual tracking error for each fund over the same 10-year period. It should be noted that although the two versions of Vanguard Total Stock Market Index (the mutual fund Admiral share class VTSAX and its ETF sibling VTI) appear to be identical, featuring the same 10-year returns and average tracking error, those funds are not actually the same. They usually record different total returns during each calendar year, and the Admiral shares’ tracking error is slightly lower.
The value of the third and final measure cannot be disputed: current expense ratios. The funds’ historic fees were embedded in their total returns, so I will not double-count costs by including them in this section. That said, each fund except for iShares Russell 3000 ETF IWV has cut its expenses over the past decade, in some cases dramatically. That trend no doubt will continue, thereby further shrinking the expense gap between winners and losers.
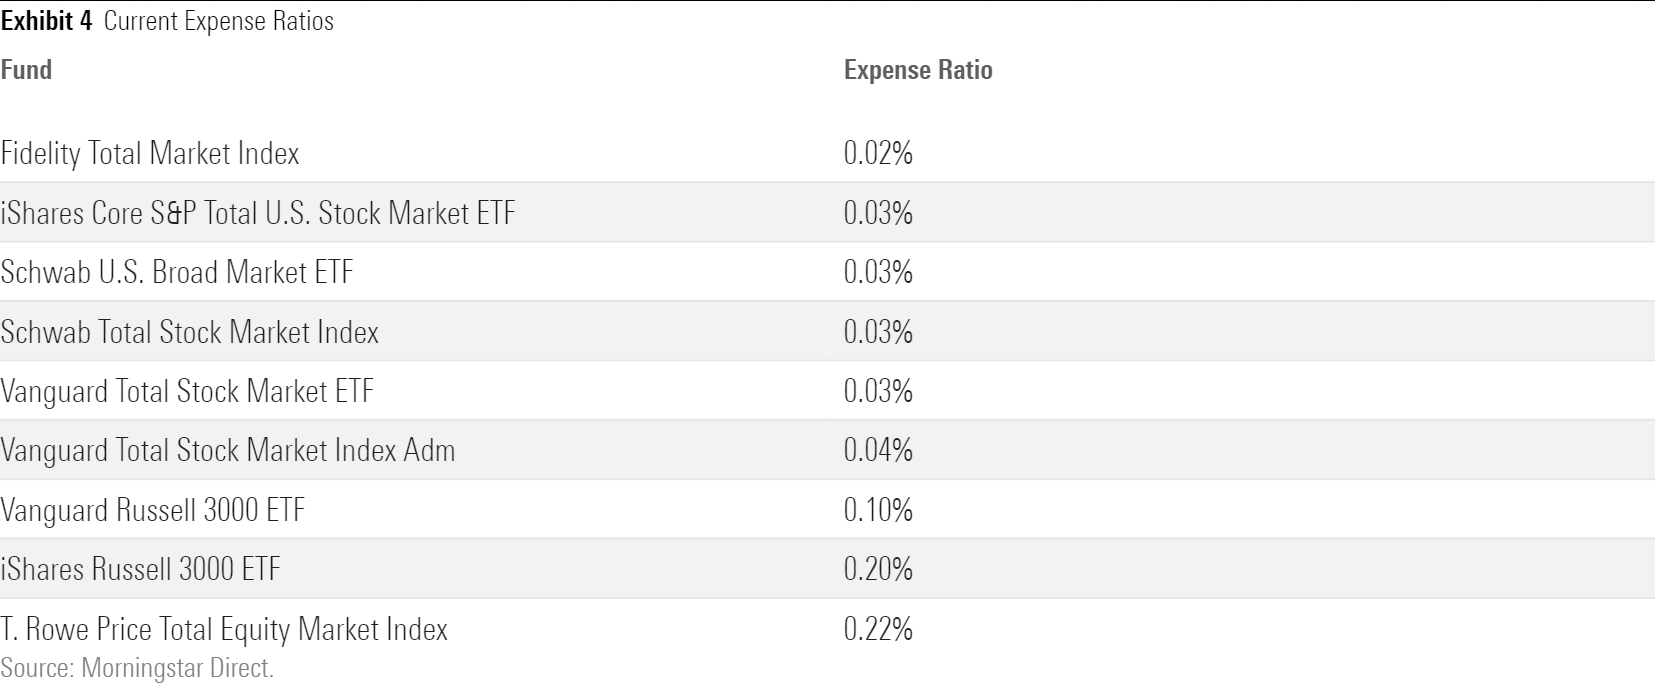
The cheapest six funds have similar costs, with fees rising for the two Russell 3000 Index entrants, and then higher again for T. Rowe Price Total Equity Market Index POMIX. As the latter’s expense ratio suggests, T. Rowe, unlike its rival Fidelity, has steered clear of the index-fund price wars. But the company has nevertheless acknowledged reality. Since 2109, it has slashed the fund’s expense ratio to 0.22% from 0.30%.
This column’s final chart assembles the components, by sorting the funds along each of the three measures, then summing those scores to arrive at an overall ranking.
Three’s Company
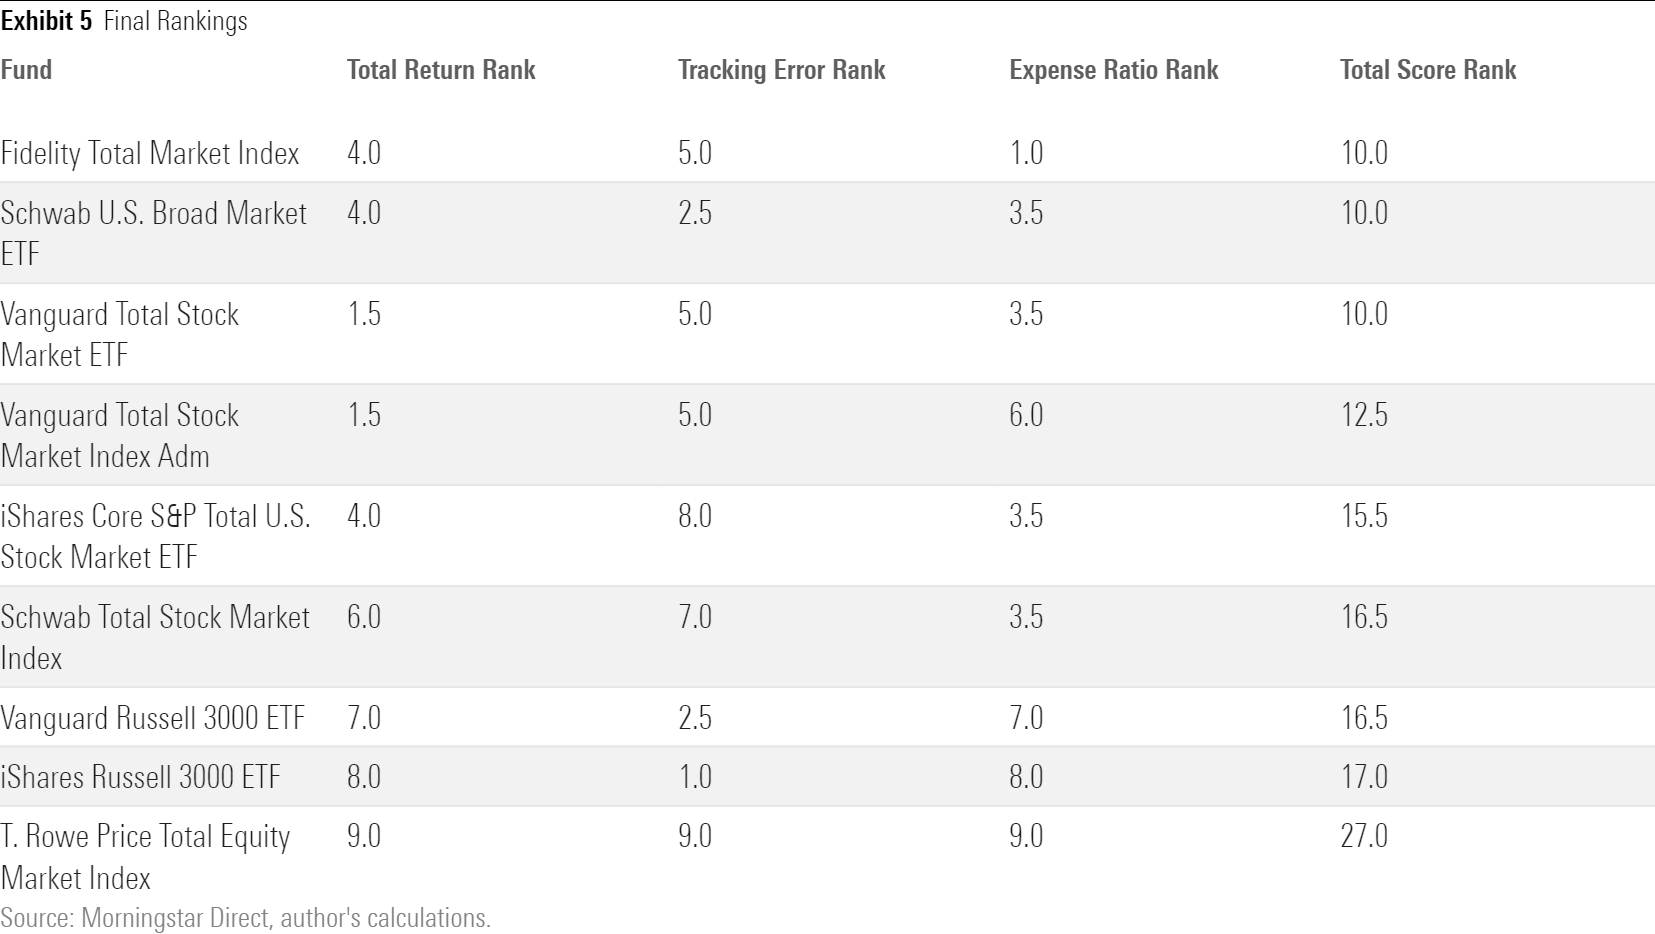
A three-way tie, featuring the three best-known fund providers: Fidelity, Schwab, and Vanguard. The fund marketplace has allocated its monies efficiently. Counting both its Admiral and ETF versions, Vanguard’s offering is by far the biggest of the total market U.S. stock funds, with Fidelity Total Market Index placing a distant second. Only Schwab’s fund lies outside the top three, because although the company boasts terrific brand recognition and $7 trillion in assets, most of that business lies elsewhere. The company is not (yet) among the 10 largest fund companies.
The middle funds on the list are close behind. IShares Core S&P Total U.S. Stock Market ETF ITOT, from giant BlackRock, lies close enough to the big three to be legitimate competition, and while the next two funds from Vanguard and Schwab can’t quite match what came before, they are certainly acceptable holdings. Only the last three funds don’t merit attention, unless one either must own a Russell 3000 Index investment or has a particular reason to do business with T. Rowe Price.
Fidelity Zero
It would be remiss not to mention Fidelity Zero Total Market Index FZROX, which follows through on its name’s suggestion by charging no expenses whatsoever. As the fund began operations in 2019, it does not quality for this column’s screens. But given its nonexistent cost, and the similarity of total stock fund indexes (Fidelity’s fund uses an in-house benchmark), Fidelity Zero will likely outgain most rival total U.S. stock funds over time and may well end up leading the pack.
John Rekenthaler (john.rekenthaler@morningstar.com) has been researching the fund industry since 1988. He is now a columnist for Morningstar.com and a member of Morningstar's investment research department. John is quick to point out that while Morningstar typically agrees with the views of the Rekenthaler Report, his views are his own.
The opinions expressed here are the author’s. Morningstar values diversity of thought and publishes a broad range of viewpoints.
/cloudfront-us-east-1.images.arcpublishing.com/morningstar/ZKOY2ZAHLJVJJMCLXHIVFME56M.jpg)
/cloudfront-us-east-1.images.arcpublishing.com/morningstar/IGTBIPRO7NEEVJCDNBPNUYEKEY.png)
/cloudfront-us-east-1.images.arcpublishing.com/morningstar/HDPMMDGUA5CUHI254MRUHYEFWU.png)
:quality(80)/s3.amazonaws.com/arc-authors/morningstar/1aafbfcc-e9cb-40cc-afaa-43cada43a932.jpg)