
5 Charts Tracking Recent 529 Savings Plan Trends
A deeper look at how 529s have evolved.
/s3.amazonaws.com/arc-authors/morningstar/de44b91c-c918-4e53-81c3-ce84542f3d36.jpg)

The impetus for introducing 529 college savings plans over 20 years ago remains strong: to broaden accessibility to higher education through tax-advantaged investing. Since Morningstar assigned its first forward-looking Analyst Ratings to 529s in 2012, we've witnessed continuous improvements to these tax-advantaged investing plans, from the quality of the investment options to fee reductions.
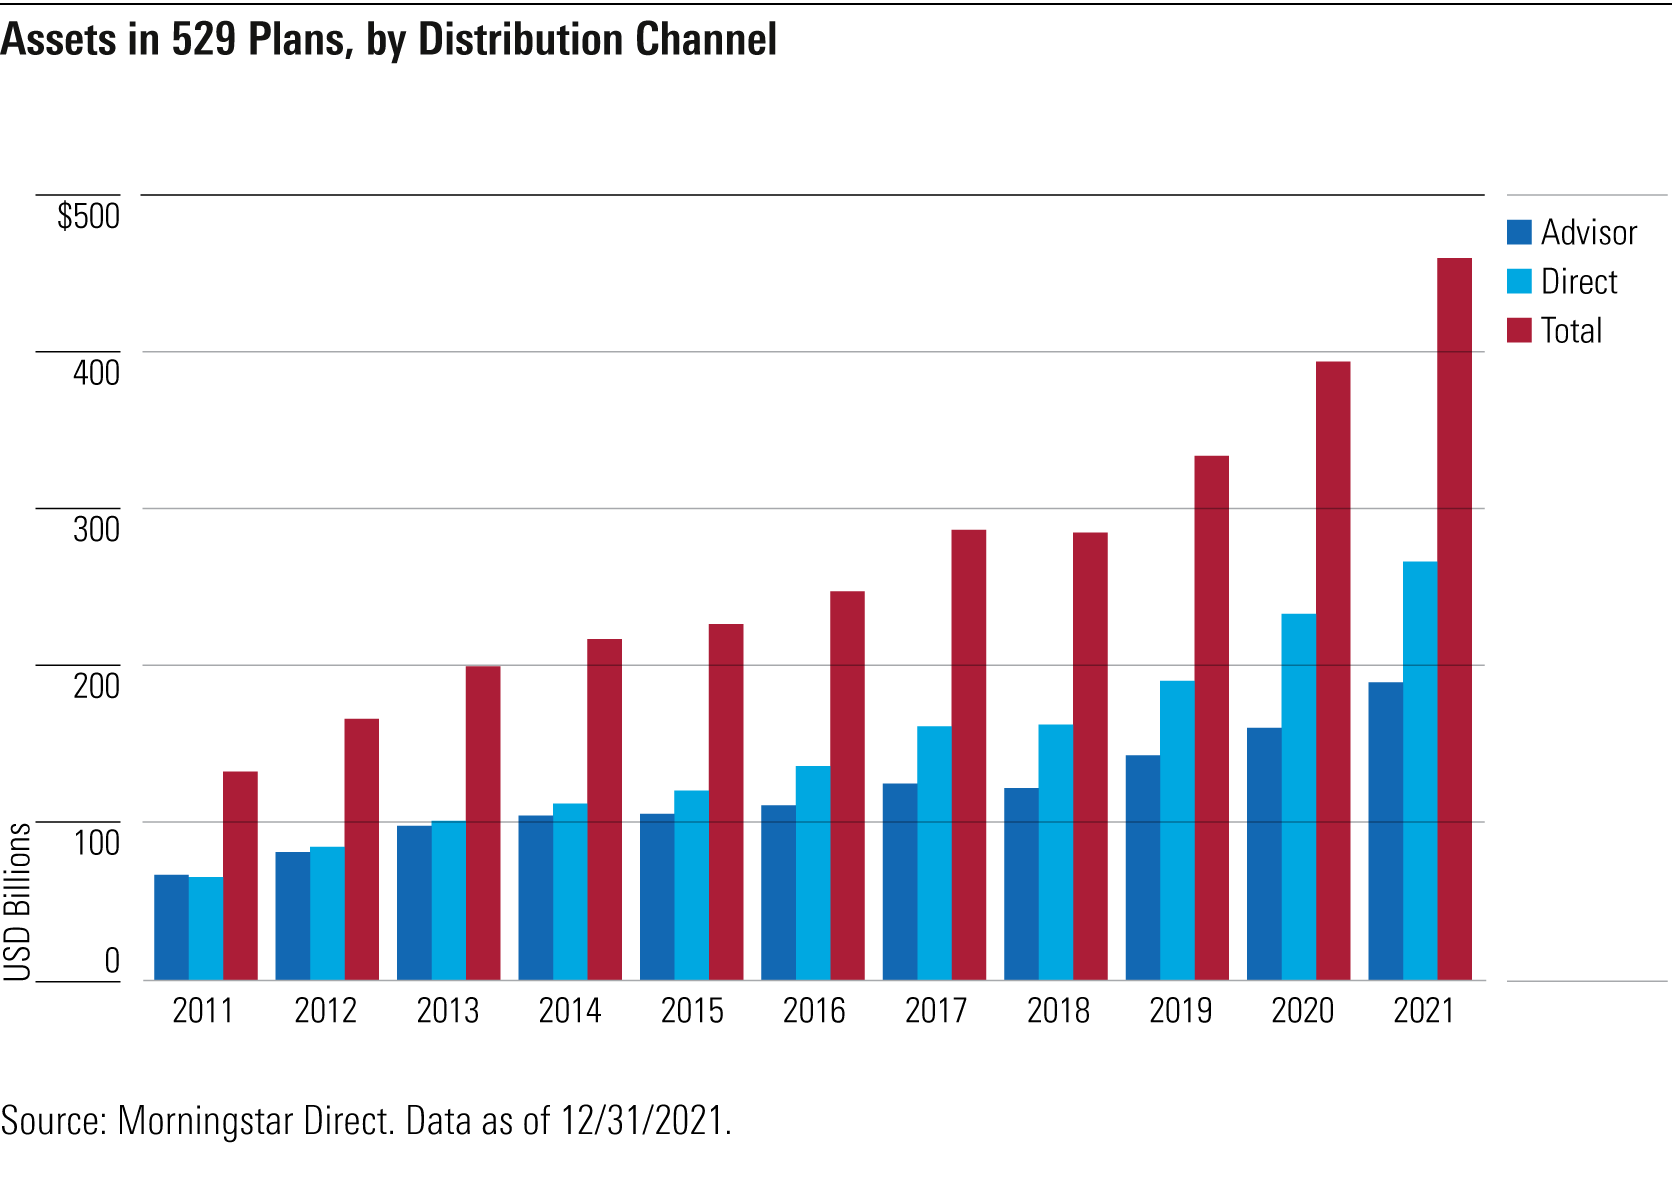
Assets in 529 plans increased by 17% in 2021, reaching an all-time high of $461 billion by year-end. Since 2011, assets have grown at a fairly steady clip, averaging about 13% a year (see Exhibit 1). Over that same period, growth in direct-sold plans, which tend to carry lower fees, averaged about 15% a year, versus 13% growth in the more expensive advisor-sold plans. Vanguard continues to maintain its lead within 529 plan investment options, holding an approximately 30% market share, followed by Capital Group at 20%. Far behind, but still material players include Fidelity Investments, TIAA-CREF, T. Rowe Price, and Columbia Management, with market shares between 4% and 9%.
Glide Paths: An Evolution
The 529 college savings plan was designed to be low maintenance and suitable for both novice and experienced investors. Each plan offers a menu of investment options, including aged-based or target-enrollment series, as well as individual mutual funds, and cash or cashlike accounts. The majority of 529 accountholders opt for the age-based or target-enrollment series because of their ease of use. When the beneficiary is young, the portfolio starts with a large allocation in equities, and then shifts to a more conservative positioning by trimming equities and moving into bonds and cash as the beneficiary approaches college age.
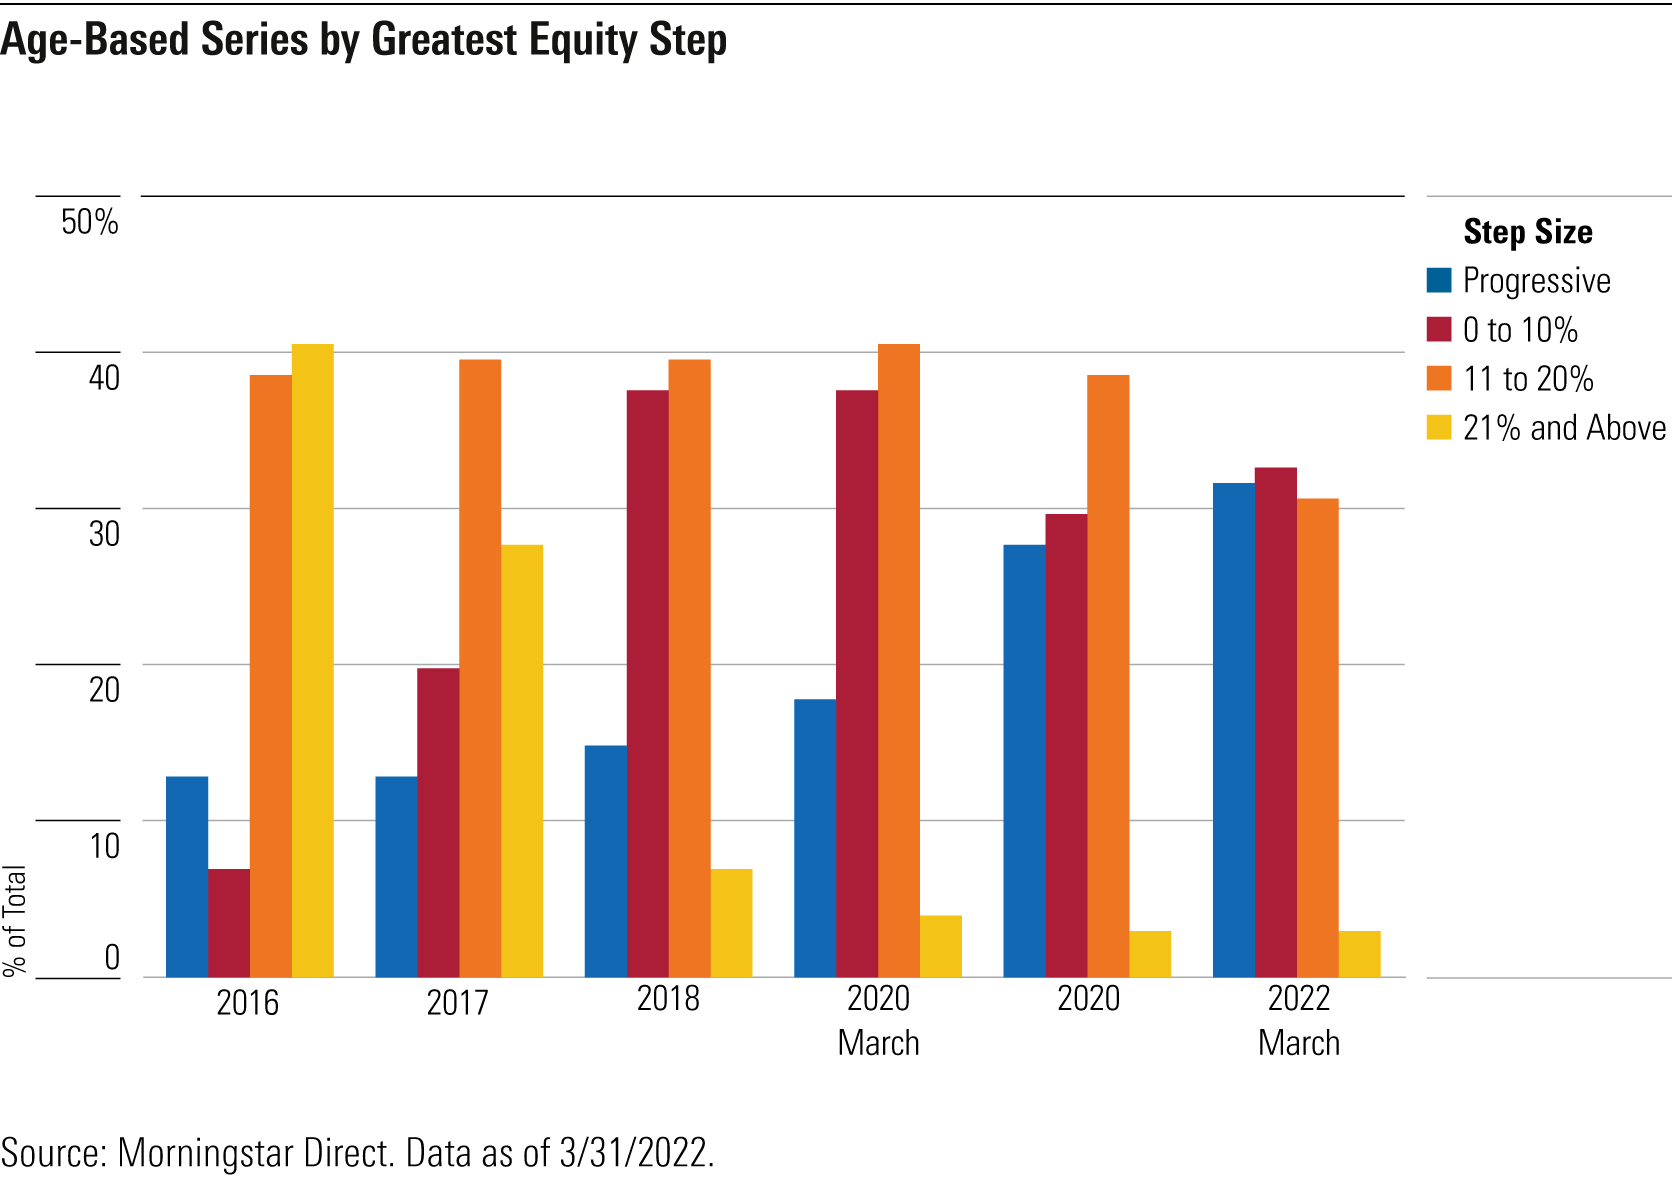
In recent years, many plan providers have improved their series by adopting a smoother glide path. Some have switched to a progressive glide path, which makes small (around 2%) asset-allocation changes, typically four times a year. Others have added portfolios to their age-based series so that the equity step-downs (which take place in one day) are 12.5% or less. Larger equity steps of 20% or more expose investors to market-timing risk. These large shifts can weigh on returns if they were to take place as markets recover after a large decline. In 2016, over 40% of age-based series had at least one equity step of 21% or greater. By the end of March 2022, series with such large step-downs only accounted for 3% of the industry.
In 2020, a large group of plans moved to a progressive glide path. This included six managed by TIAA-CREF, such as the Gold-rated Michigan Education Savings Program and California's Silver-rated ScholarShare College Savings Plan. Another notable switch to progressive took place in Silver-rated The Vanguard 529 College Savings Plan, which did not go smoothly, as both state sponsor Nevada and Vanguard failed to notice errors in the asset allocation.
The pace of change slowed in 2021, when only four plans moved from a stepped glide path to a progressive one: the Silver-rated Pennsylvania 529 Investment Plan, Utah's Gold-rated my529, Connecticut's Neutral-rated CHET Advisor 529 College Savings Plan, and Colorado's Neutral-rated Scholars Choice Education Savings Plan.
In April 2021, Pennsylvania switched from offering three age-based series (conservative, moderate, and aggressive) to one target-enrollment option and kept the same underlying fund lineup. Utah's my529 made the change in July 2021, going from four age-based series to one target-enrollment option while also trimming the number of underlying funds. For both plans, the end of the glide path courts a little more risk than their prior conservative and moderate tracks. More specifically, the new progressive glide paths generally hold slightly higher equity allocations relative to the two plans' previous moderate options, and include an almost 20% equity allocation in the year prior to the target-enrollment year, whereas the prior conservative options had already moved to a zero allocation in equities. 529 investors who want to minimize downside risk just prior to enrollment should consider moving their assets into a cash or cashlike account.
The remaining two plans that moved to a progressive glide path, Connecticut's CHET Advisor 529 College Savings Plan and Colorado's Scholars Choice Education Savings Plan, resulted from a change in program manager to Fidelity Investments and TIAA-CREF, respectively. Both firms employ progressive glide paths in the plans they manage for other states. Industry laggards, with steps of 21% or greater, include the Neutral-rated College Savings Iowa 529 Plan and three nonrated plans: Iowa's IAdvisor 529 Plan, Louisiana's START Saving Program, and Oregon's MFS 529 Savings Plan.
Exhibit 3 shows the average equity allocations of 164 age-based or target-enrollment series, divided into five groups. The first group, progressive, includes 53 series. In this group, each plan typically follows one glide path but may provide choice. For example, plans managed by Fidelity, such as Massachusetts' Bronze-rated U.Fund College Investing Plan, employ one progressive glide path but provide a choice of three series: one that uses all active underlying funds, one that uses all index funds, and one that uses a blend of active and index funds.
The remaining four groups follow an age-based stepped glide path. There are 26 plans that offer one glide path option, depicted as "age-based: one option." The remaining plans allow investors to pick their preferred risk profile by providing aggressive, moderate, and conservative options.
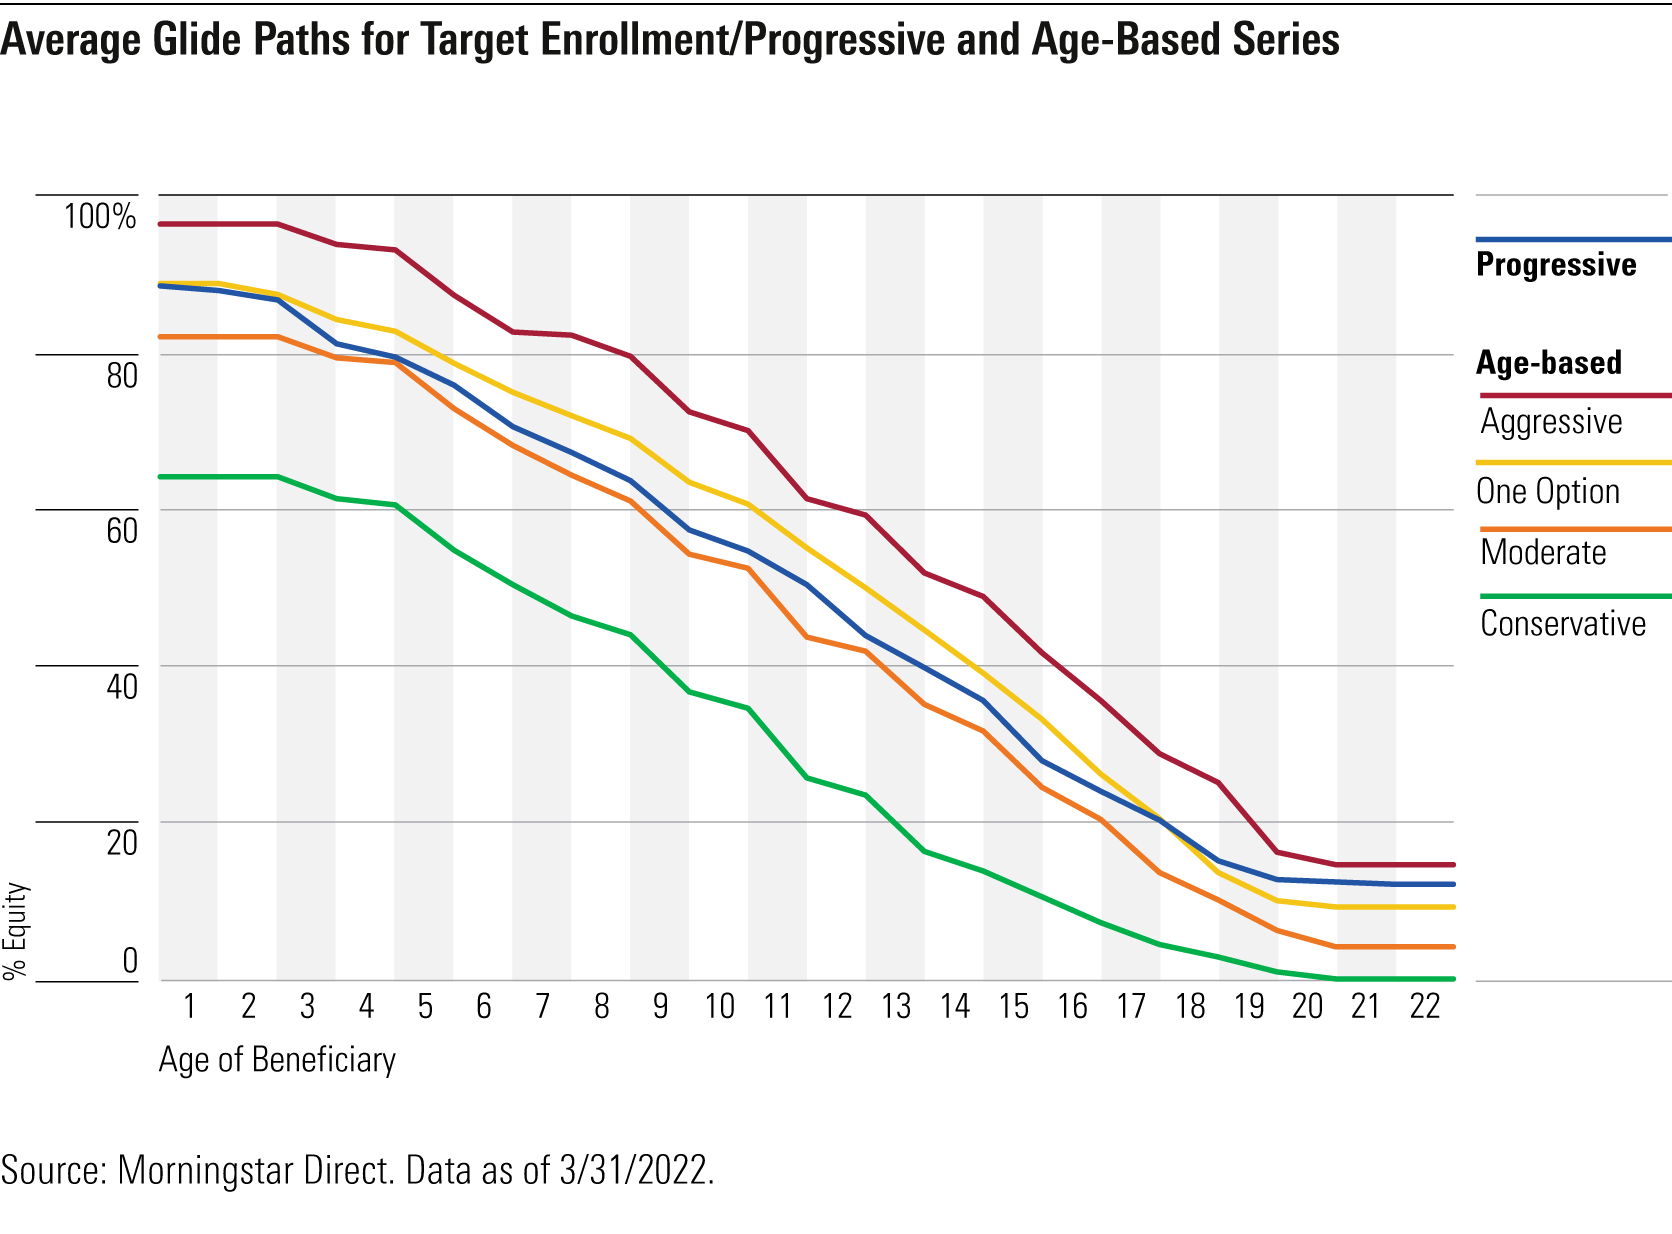
Plans that offer one glide path option (progressive and one option) have average equity allocations that are slightly higher than the average moderate glide path. While a higher equity allocation earlier in the glide path can potentially result in higher upside in the long run, investors will likely experience more volatility. That said, in 2020, during and immediately after the pandemic-related market slide, 529 investors appeared to stay put, suggesting that investors can weather volatility without panicking. But a large decline in 529 assets for those just about to enter college can be a stressful time for families. The average portfolio for an 18-year-old in a series with a progressive glide path has 15% in equities and at least 30% in bonds that carry duration and/or credit risk. In the first four months of 2022, these portfolios saw average declines of 6% to 7% as both equities and bonds sank. More research into spending patterns during a beneficiary's college years may help determine if more conservative options at the end of the glide path may be beneficial for families.
Fees Continue to Fall
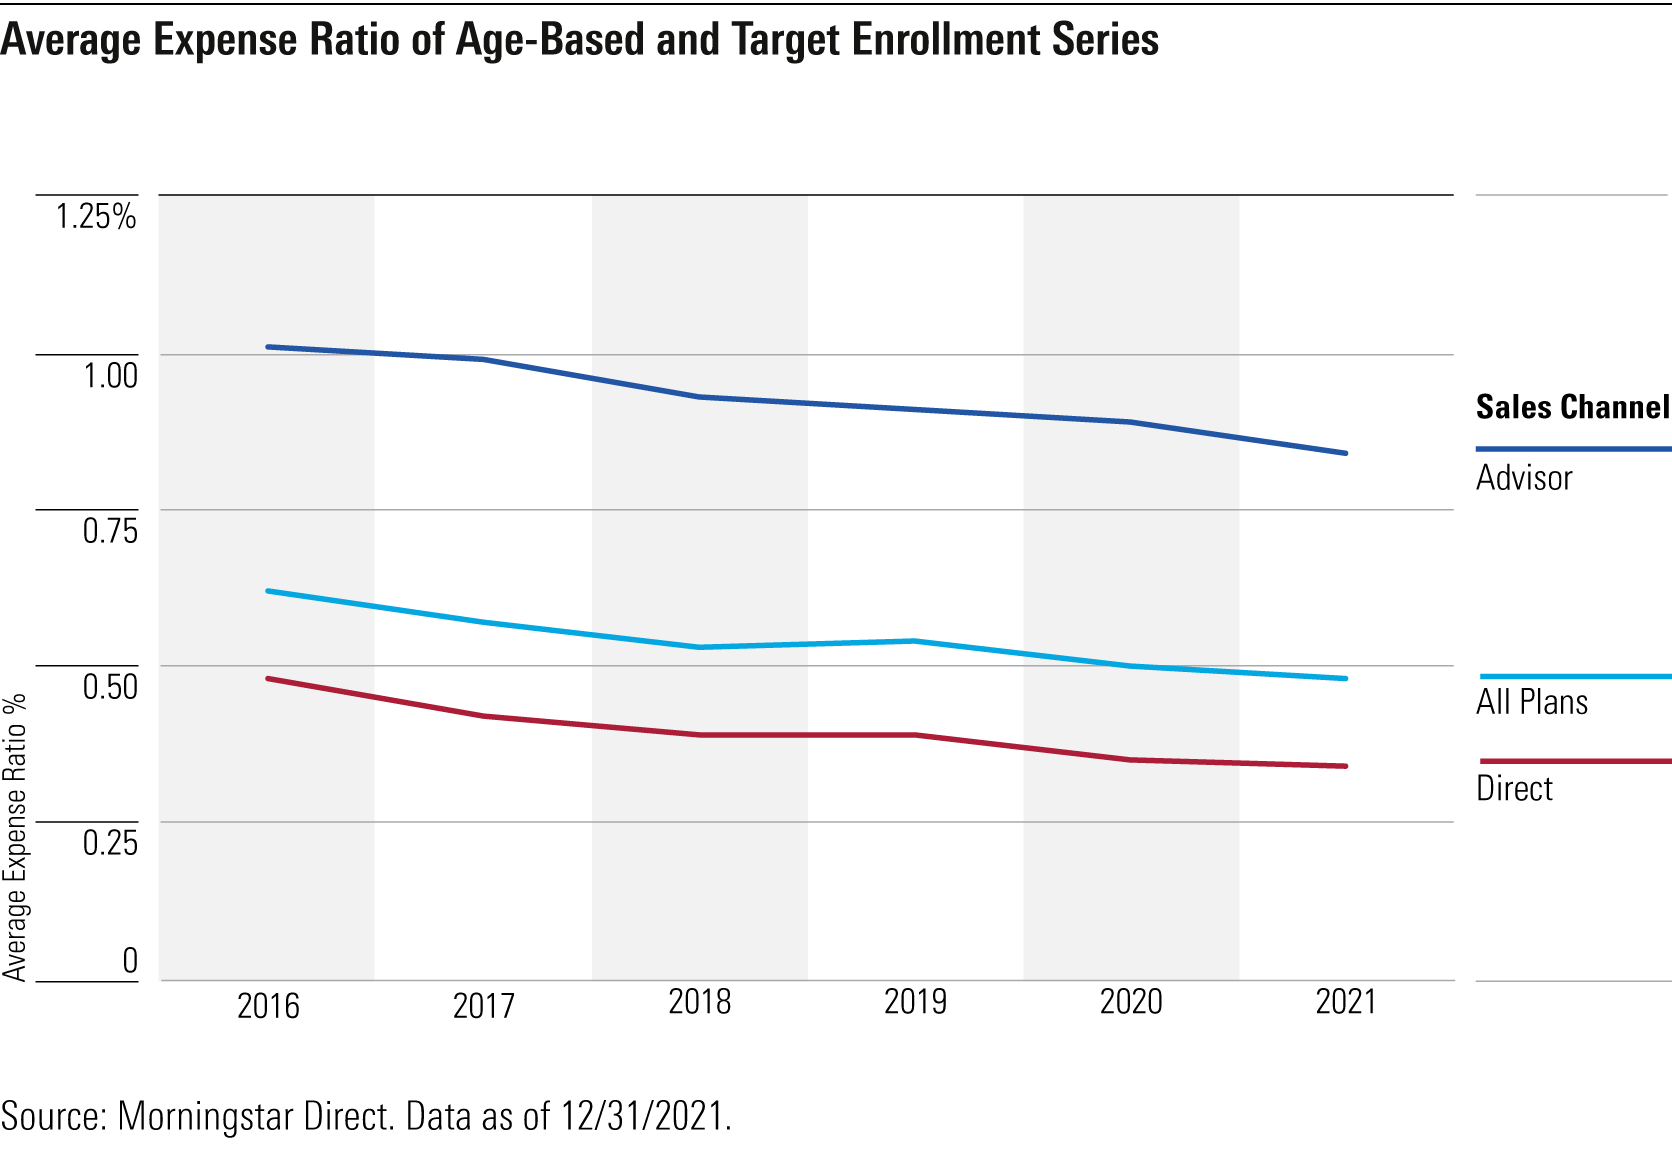
Average fees continue to fall across the investment industry, including 529 savings plans. At the end of 2021, the average fee for an age-based or target-enrollment series was 0.48%, a decline from 0.50% in the year prior. Direct-sold options continue to boast a substantial fee advantage, with average fees of 0.34%, reflecting a decline of 1 basis point from 2020. Meanwhile, advisor-sold plans remain significantly more expensive, with average fees of 0.84%, a decline of 5 basis points from the year prior.
Since their inception, 529 portfolios have often charged higher fees than comparable mutual funds and target-date series owing to additional layers of fees: one for the program manager of the investments and one for the state offering the plan. Over the years, some plans have reduced fees by trimming the state fees and negotiating with their program manager for lower fees. Plans with a growing and relatively larger asset base can achieve some economies of scale, which can be passed on to investors through lower fees.
In 2021, Georgia's Silver-rated Path2College 529 Plan earned the distinction of offering the cheapest target-enrollment series, with average fees of 0.09%, a significant decline from its prior fees of 0.22%. This is notable as fee cuts tend to be much smaller. That year, the Georgia Higher Education Savings Board decided to waive its state administrative fee of 0.06% and also successfully negotiated lower program manager fees with TIAA-CREF during the contract renewal process. Other notable fee cuts came from Illinois. For its Neutral-rated Bright Directions Advisor-Guided 529 age-based series, the state shifted to lower cost-managers in certain asset classes, resulting in average fee declines of 9 to 12 basis points across its aggressive, moderate, and conservative series. For Illinois' Gold-rated Bright Start Direct-Sold College Savings, the blend series saw an average decline of 3 basis points, partly owing to a partial shift from active to passive for international-equity exposure. Last year, fee cuts also resulted from a change in program manager. Colorado's Scholars Choice Education Savings Plan selected TIAA-CREF to take over its advisor-sold plan, which now charges average fees of 0.77% for its target-enrollment series, a 16-basis-point decline from the year prior.
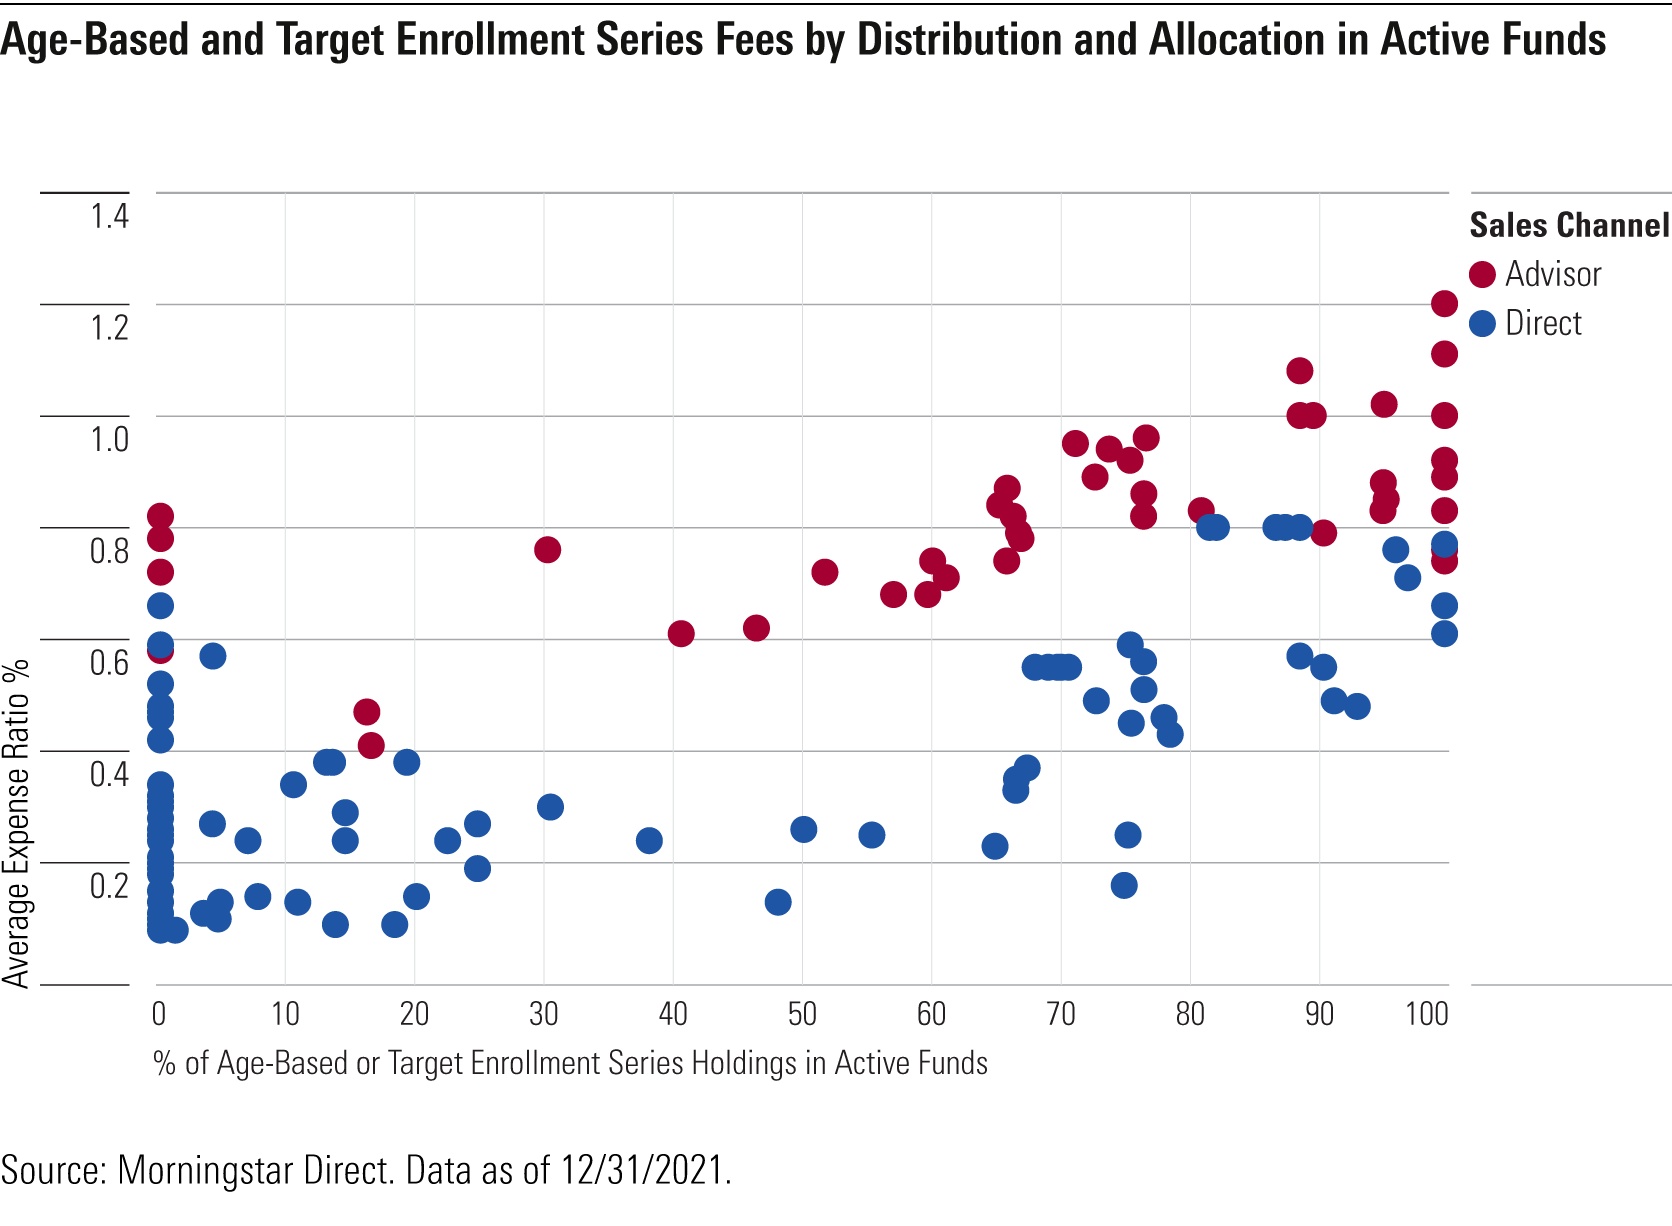
Advisor-sold plans remain more expensive than direct-sold plans, and Exhibit 5 provides a partial explanation, as it shows that on average, advisor-sold plans hold a higher percentage of actively managed strategies in their age-based or target-enrollment series. The most expensive offering in the 529 industry is Alaska's John Hancock Freedom 529, whose all-active age-based series charges an average fee of 1.21%. While the series was designed by the topnotch multi-asset team at T. Rowe Price, the exorbitant fees limit its Morningstar Analyst Rating to Neutral. The least expensive advisor-sold option with an all-active underlying lineup is Bronze-rated CollegeAmerica, which is sponsored by Virginia. The plan charges average fees of 0.77% for its target-enrollment series.
Another reason for advisor-sold plans' higher fees is the annual distribution (or sales) fees paid to the advisor. Arizona, Maine, and North Dakota each offer an advisor-sold age-based or target-enrollment series that only holds low-cost index funds. The weighted average fees for the underlying index funds range from 0.04% to 0.15%, but after the addition of the management, state, and sales fees, the total expense ratios for these series rise to an expensive range of 0.59% to 0.79%.
Morningstar doesn't prefer active or passive funds for age-based or target-enrollment series, but our research has consistently shown that over time, lower-fee options provide a reliable edge relative to peers. Lower fees present lower performance hurdles, putting less pressure on portfolio managers to take more risk to make up their funds' costs. It's hard even for outstanding asset allocation and talented managers to consistently overcome high costs, especially when their styles are out of favor. Low fees, however, are a dependable advantage that compounds over time and lead to better investor outcomes.
This is the fifth and final article in this year's Morningstar series on 529 savings plans. The first article explains our ratings methodology for 529 plans and highlights our top picks. The second article discusses the tax benefits of 529 plans, state by state. The third article addresses common concerns about using 529 plans, and the fourth article looks at the largest asset managers in the 529 industry.
Subscribers to Morningstar.com can access our 529 plan reports and ratings from the 529 Plan Center map. (After clicking on a state, please allow a few seconds for the plan options to download into your browser.)
All 529 plan ratings are as of May 26, 2022.
/cloudfront-us-east-1.images.arcpublishing.com/morningstar/GQNJPRNPINBIJGIQBSKECS3VNQ.jpg)
/cloudfront-us-east-1.images.arcpublishing.com/morningstar/EC7LK4HAG4BRKAYRRDWZ2NF3TY.jpg)
/cloudfront-us-east-1.images.arcpublishing.com/morningstar/JNGGL2QVKFA43PRVR44O6RYGEM.png)
:quality(80)/s3.amazonaws.com/arc-authors/morningstar/de44b91c-c918-4e53-81c3-ce84542f3d36.jpg)