
Public/Private Markets
Structural shifts in markets make private assets hard to ignore.
/s3.amazonaws.com/arc-authors/morningstar/033528a9-55cc-40aa-90a9-8d2d98697cf5.jpg)

Editor's note: This article first appeared in the Q2 2022 issue of Morningstar magazine. Click here to subscribe.
There’s no shortage of statistics that tell the story of booming private markets. Consider that there are now roughly 1,000 unicorns, private companies with $1 billion valuations—no longer so rare as the term implies. Or that private-market transactions reached nearly $5 trillion globally in 2021 on more than 38,000 deals, both records, according to estimates by PitchBook, a Morningstar company that tracks private markets.
The boom is also evident in the performance of public companies focused on private assets. (See exhibit below.) The Morningstar PitchBook Developed Markets Listed Private Equity Index, which tracks publicly traded companies with significant private-market exposure, gained an average of 45% per year from 2019 to 2021, more than double the equivalent gauge of public equities. The index does not include special-purpose acquisition companies, which represent a backdoor way to bring private companies into public markets. But it does include alternative-asset managers like TPG TPG, which raised $9 billion in an IPO in January 2022.
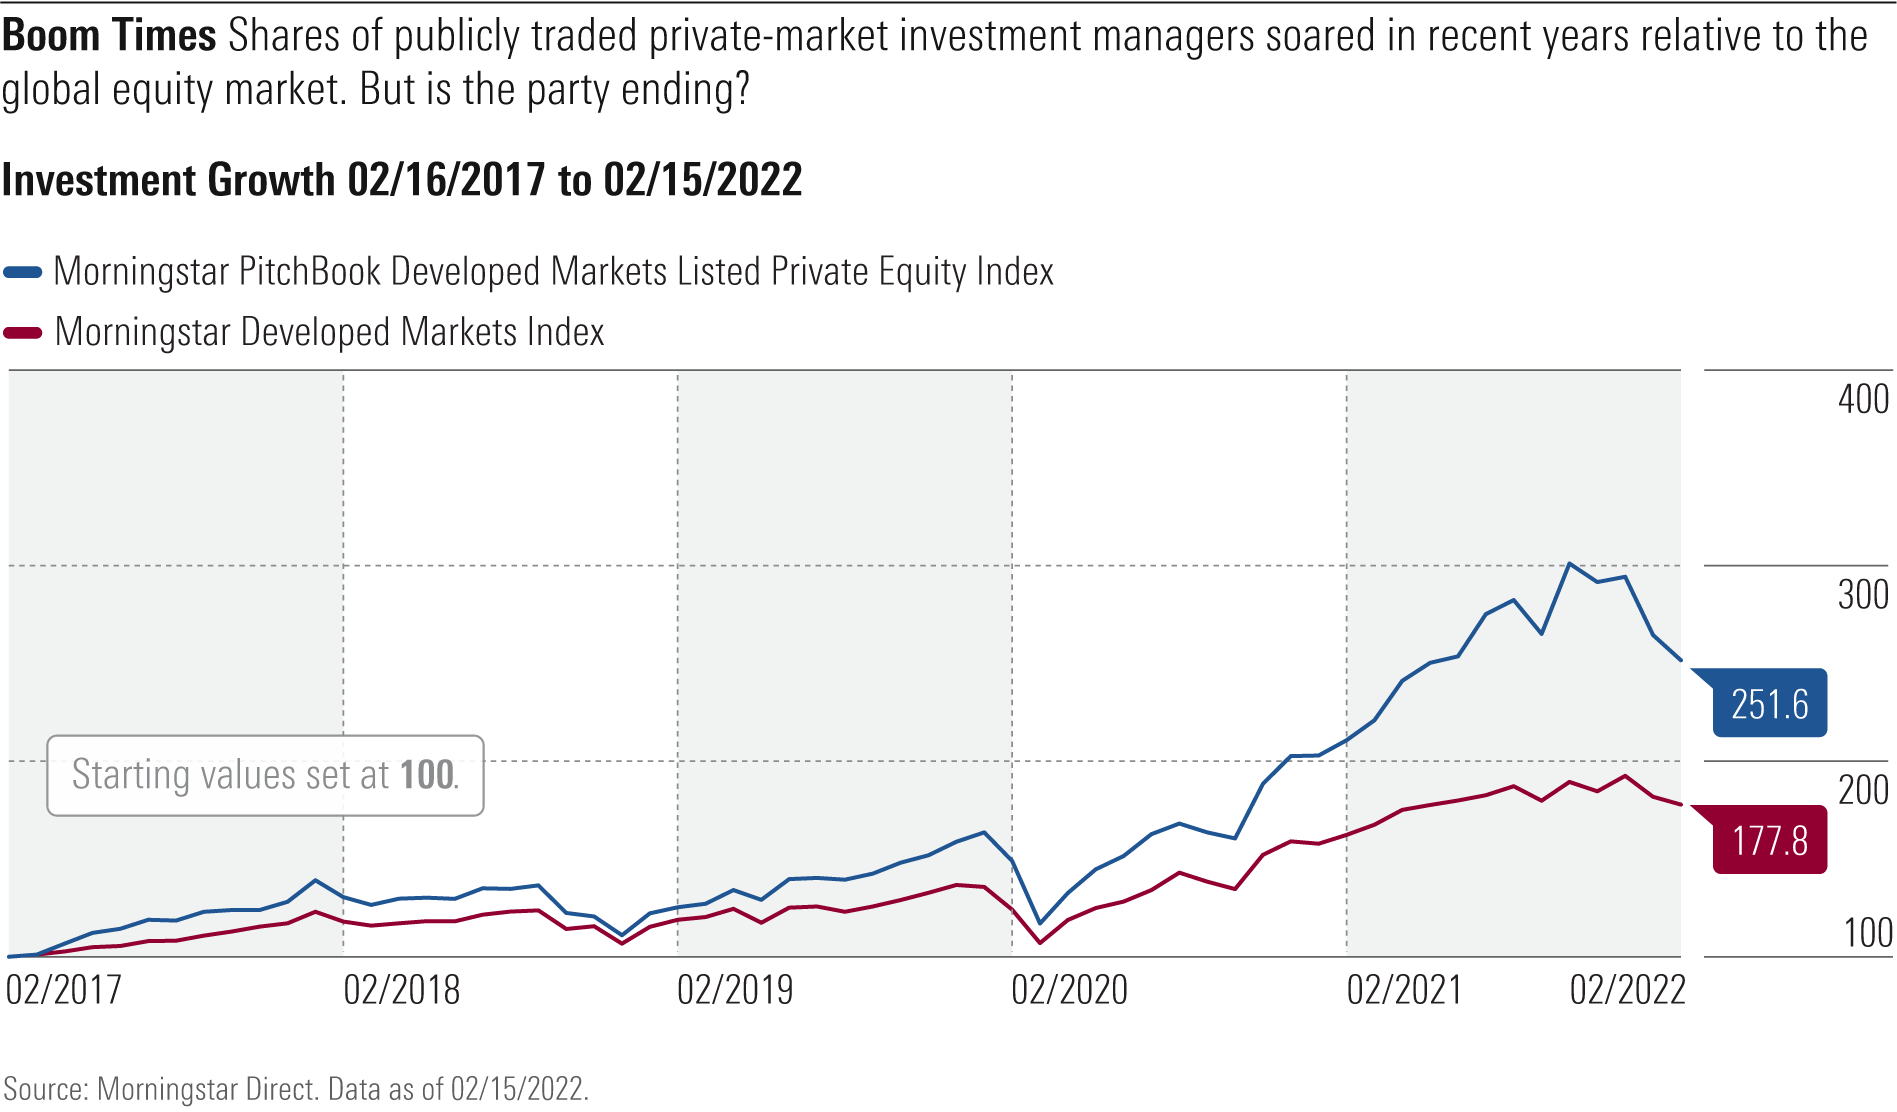
In retrospect, TPG’s listing might come to be seen as a cyclical peak. The first quarter’s rocky equity market was especially painful for publicly traded private-market players. Rising interest rates and cooling public markets represent real risks. But long-term structural drivers make private assets increasingly difficult for investors to ignore.
Privates Peaking? Speaking at the Morningstar Investment Conference in September 2021, Brian Selmo, a mutual fund manager at First Pacific Advisors, bemoaned a paucity of undervalued securities compared with the late 1990s, another growth-dominated era:
“The sophistication of the private equity world today and the amount of money that’s there ... mean that the sort of neglected little industrial business ... or consumer staples or restaurants ... [are impossible to find] in today’s market because they would be bought by someone at maybe twice the multiple.”
Roughly $12 trillion managed by private equity, venture capital, and other such funds compete for assets of all kinds, including public companies such as Telecom Italia TIT:IT, which received a EUR 10.8 billion buyout bid from KKR KKR; family-held businesses such as Medline, bought out by a private equity group for $34 billion; sports franchises such as the Golden State Warriors basketball team, in which a private investment group owns a minority stake; and transportation centers such as Sydney Airport in Australia, taken over by a consortium of private investors.
PitchBook estimates that the number and value of deals reached record heights in 2021 in both Europe (16,352 deals worth $1.8 trillion) and North America (18,539 deals worth $2.8 trillion). Valuations for early-stage companies jumped 50% in 2021 to a median of $45 million, while the typical late-stage valuation surpassed $750 million.
The composition of the Morningstar PitchBook Developed Markets Listed Private Equity Index reflects a dynamic global landscape. (See next exhibit.) Partners Group Holding PGHN of Switzerland; Sweden’s EQT EQT:SE and Kinnevik KINV A:SE; Canada’s Onex ONEX:CN; Japan’s SBI Holdings 8473:JP; and the United Kingdom’s Intermediate Capital Group ICP:UK sit alongside U.S. managers such as Apollo Global Management APO, KKR, and Blackstone BX, which closed 2021 managing $880 billion in private equity, private debt, and hedge funds.
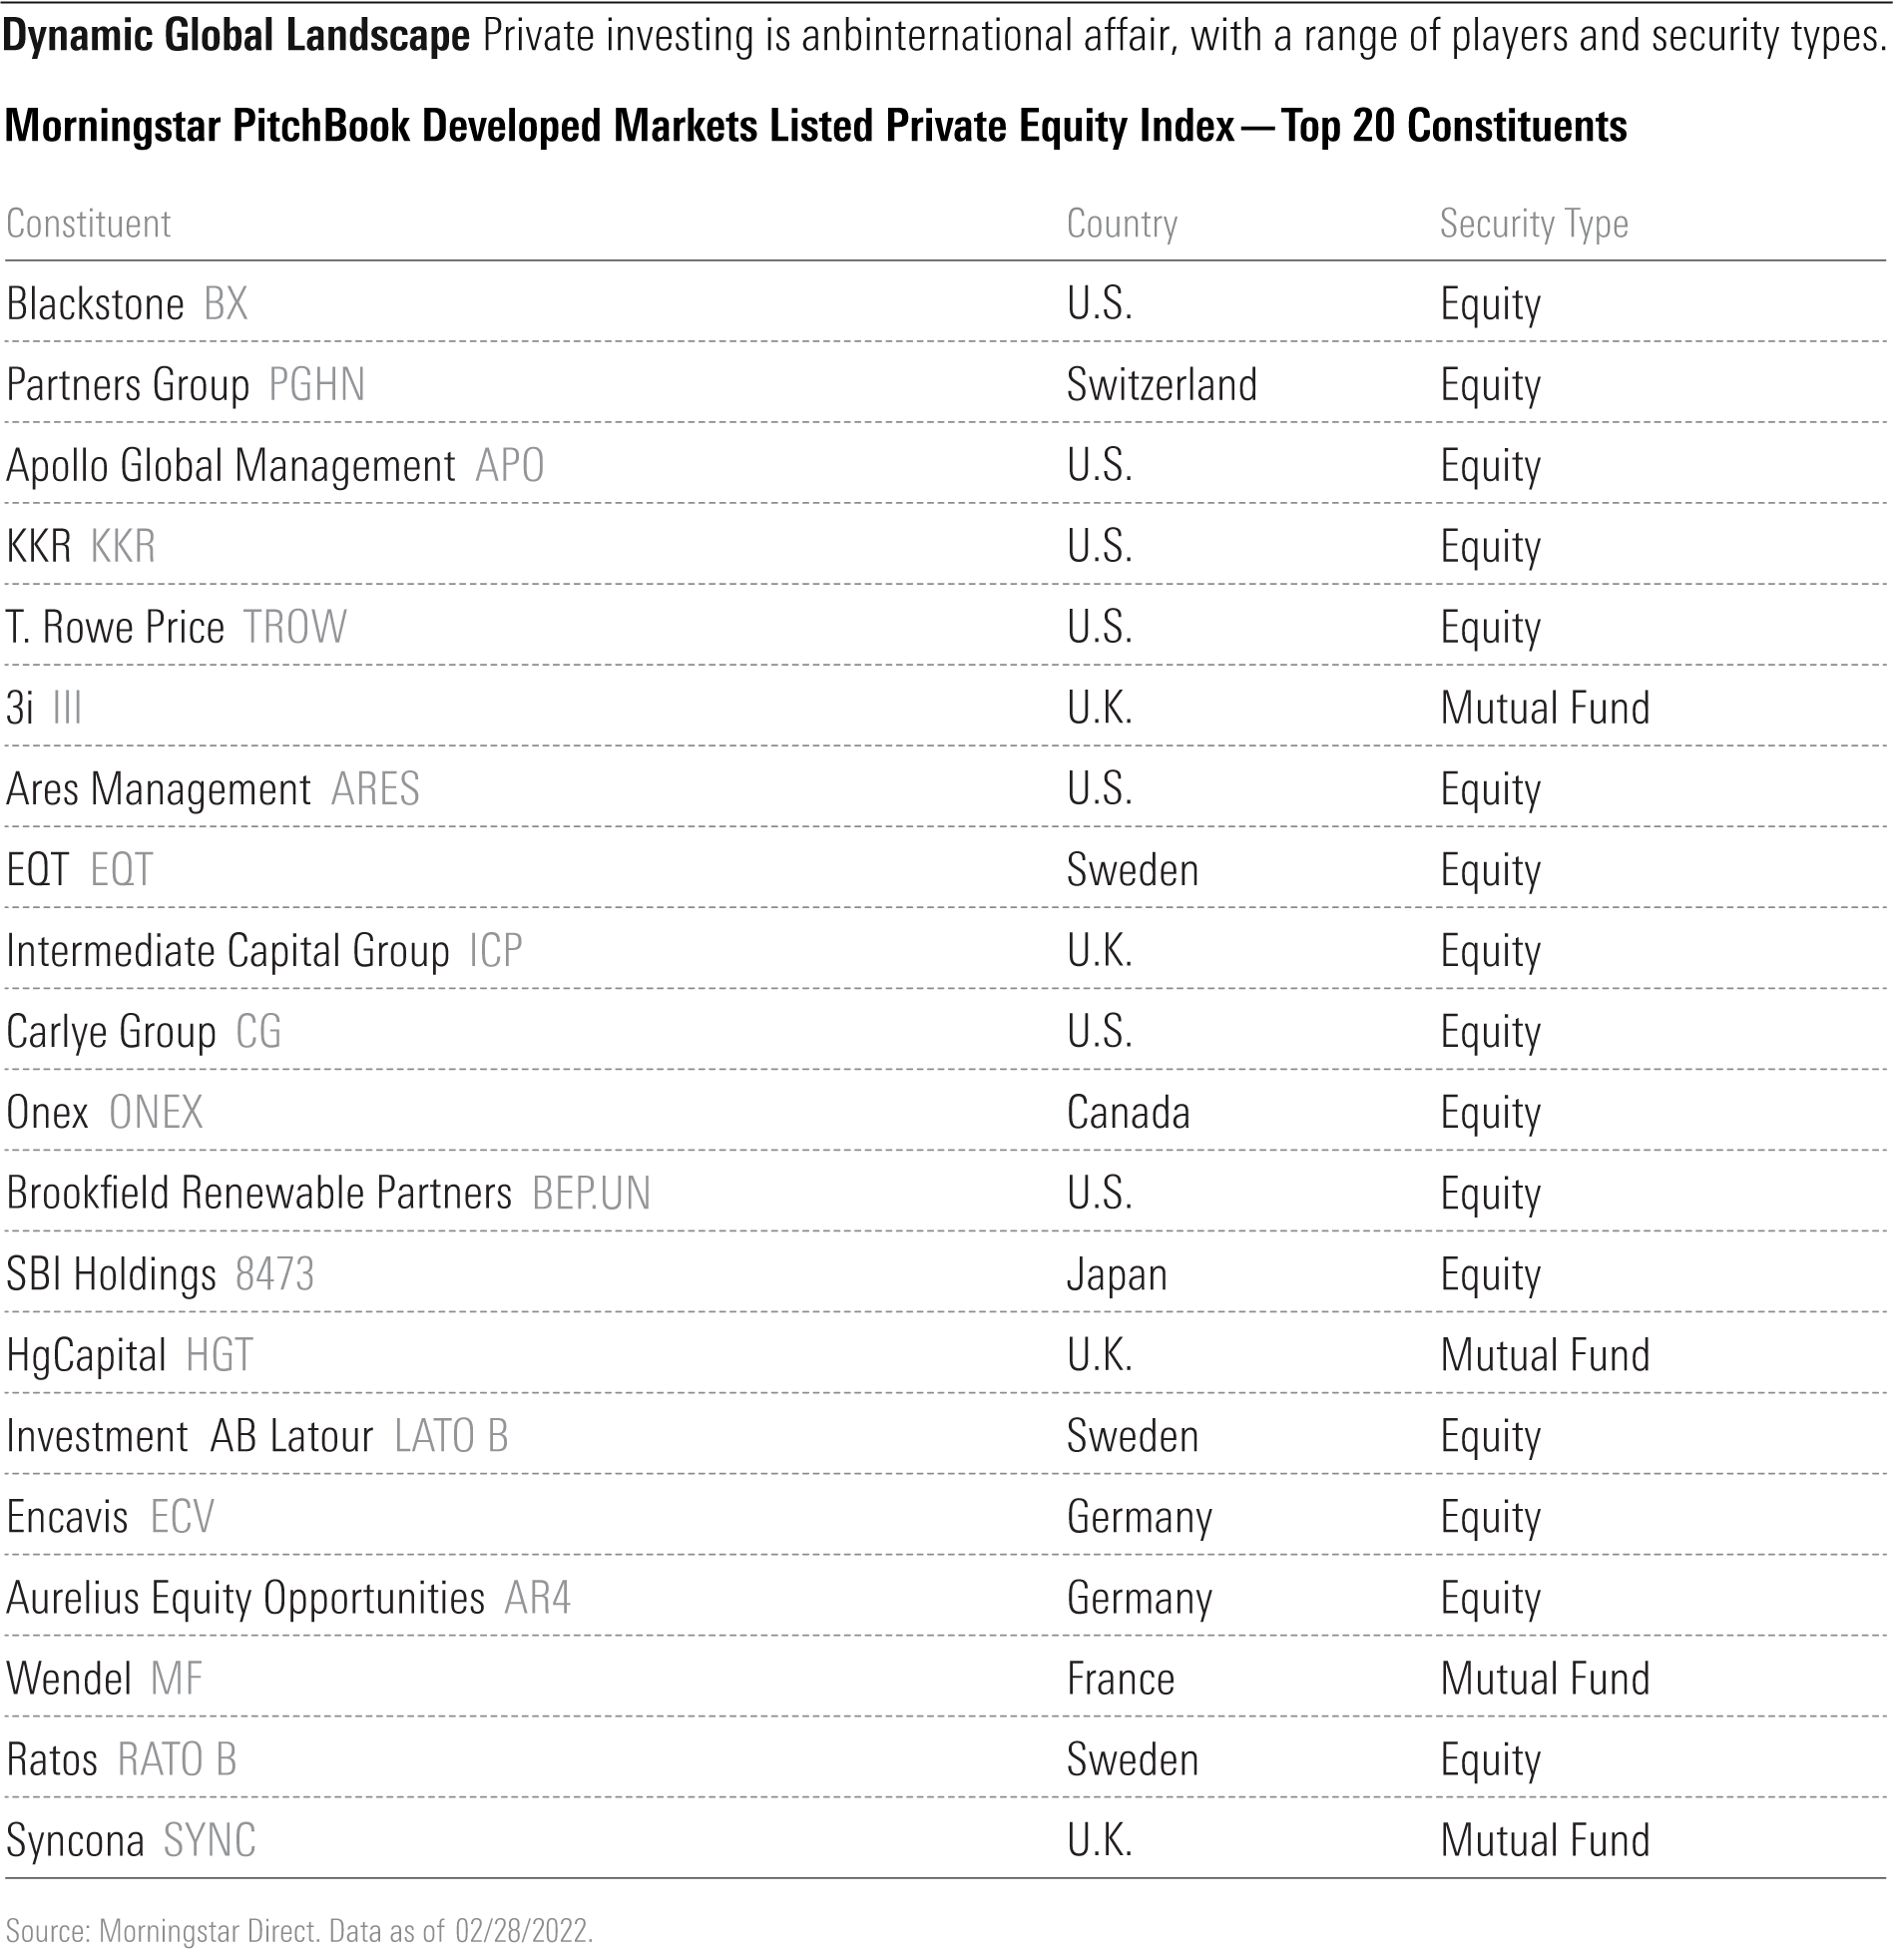
The index notably includes T. Rowe Price TROW, an example of a “crossover” investor. Best known for managing mutual funds, T. Rowe’s venture capital activities were significant enough to merit inclusion. According to PitchBook, T. Rowe owns stakes in RealPage, Waymo, and Glassdoor and was a pre-IPO investor in Airbnb ABNB, Paytm PAYTM:IN, Toast TOST, and Twitter TWTR.
Low interest rates have undoubtedly helped fuel this boom. Private equity funds typically make significant use of leverage, issuing or restructuring debt to enhance returns. Debt-heavy deals in 2021 included the $12.3 billion buyout of cloud security vendor Proofpoint, $6 billion for Hertz HTZ, $9.7 billion for British supermarket chain Morrisons, and Medline, which was the largest leveraged buyout in a decade.
Rip-roaring public equity markets also provided a tailwind to private assets. In 2021, the best IPO year since 2000, listings like DiDi Global DIDI, Coupang CPNG, Robinhood Markets HOOD, Wise WISE:UK, and Coinbase COIN provided massive “exits” for their investors. And public companies flush with cash and hunting for acquisitions drove up private asset prices. Microsoft MSFT acquired healthcare-focused AI firm Nuance Communications for $19.7 billion, for example, and DoorDash DASH paid EUR 7 billion to acquire Finland-based Wolt.
As interest rates rise and public markets cool, however, private markets will feel the pinch. Market volatility has already postponed some private-capital-backed IPOs. In an analysis of Blackstone that applies broadly, Morningstar equity strategist Greggory Warren writes:
“Tightened credit conditions could limit the firm’s ability to move into new investments, while weak economic conditions and difficult equity and credit markets could affect not only the value of Blackstone’s investments, but also its ability to cash out of these investments.”
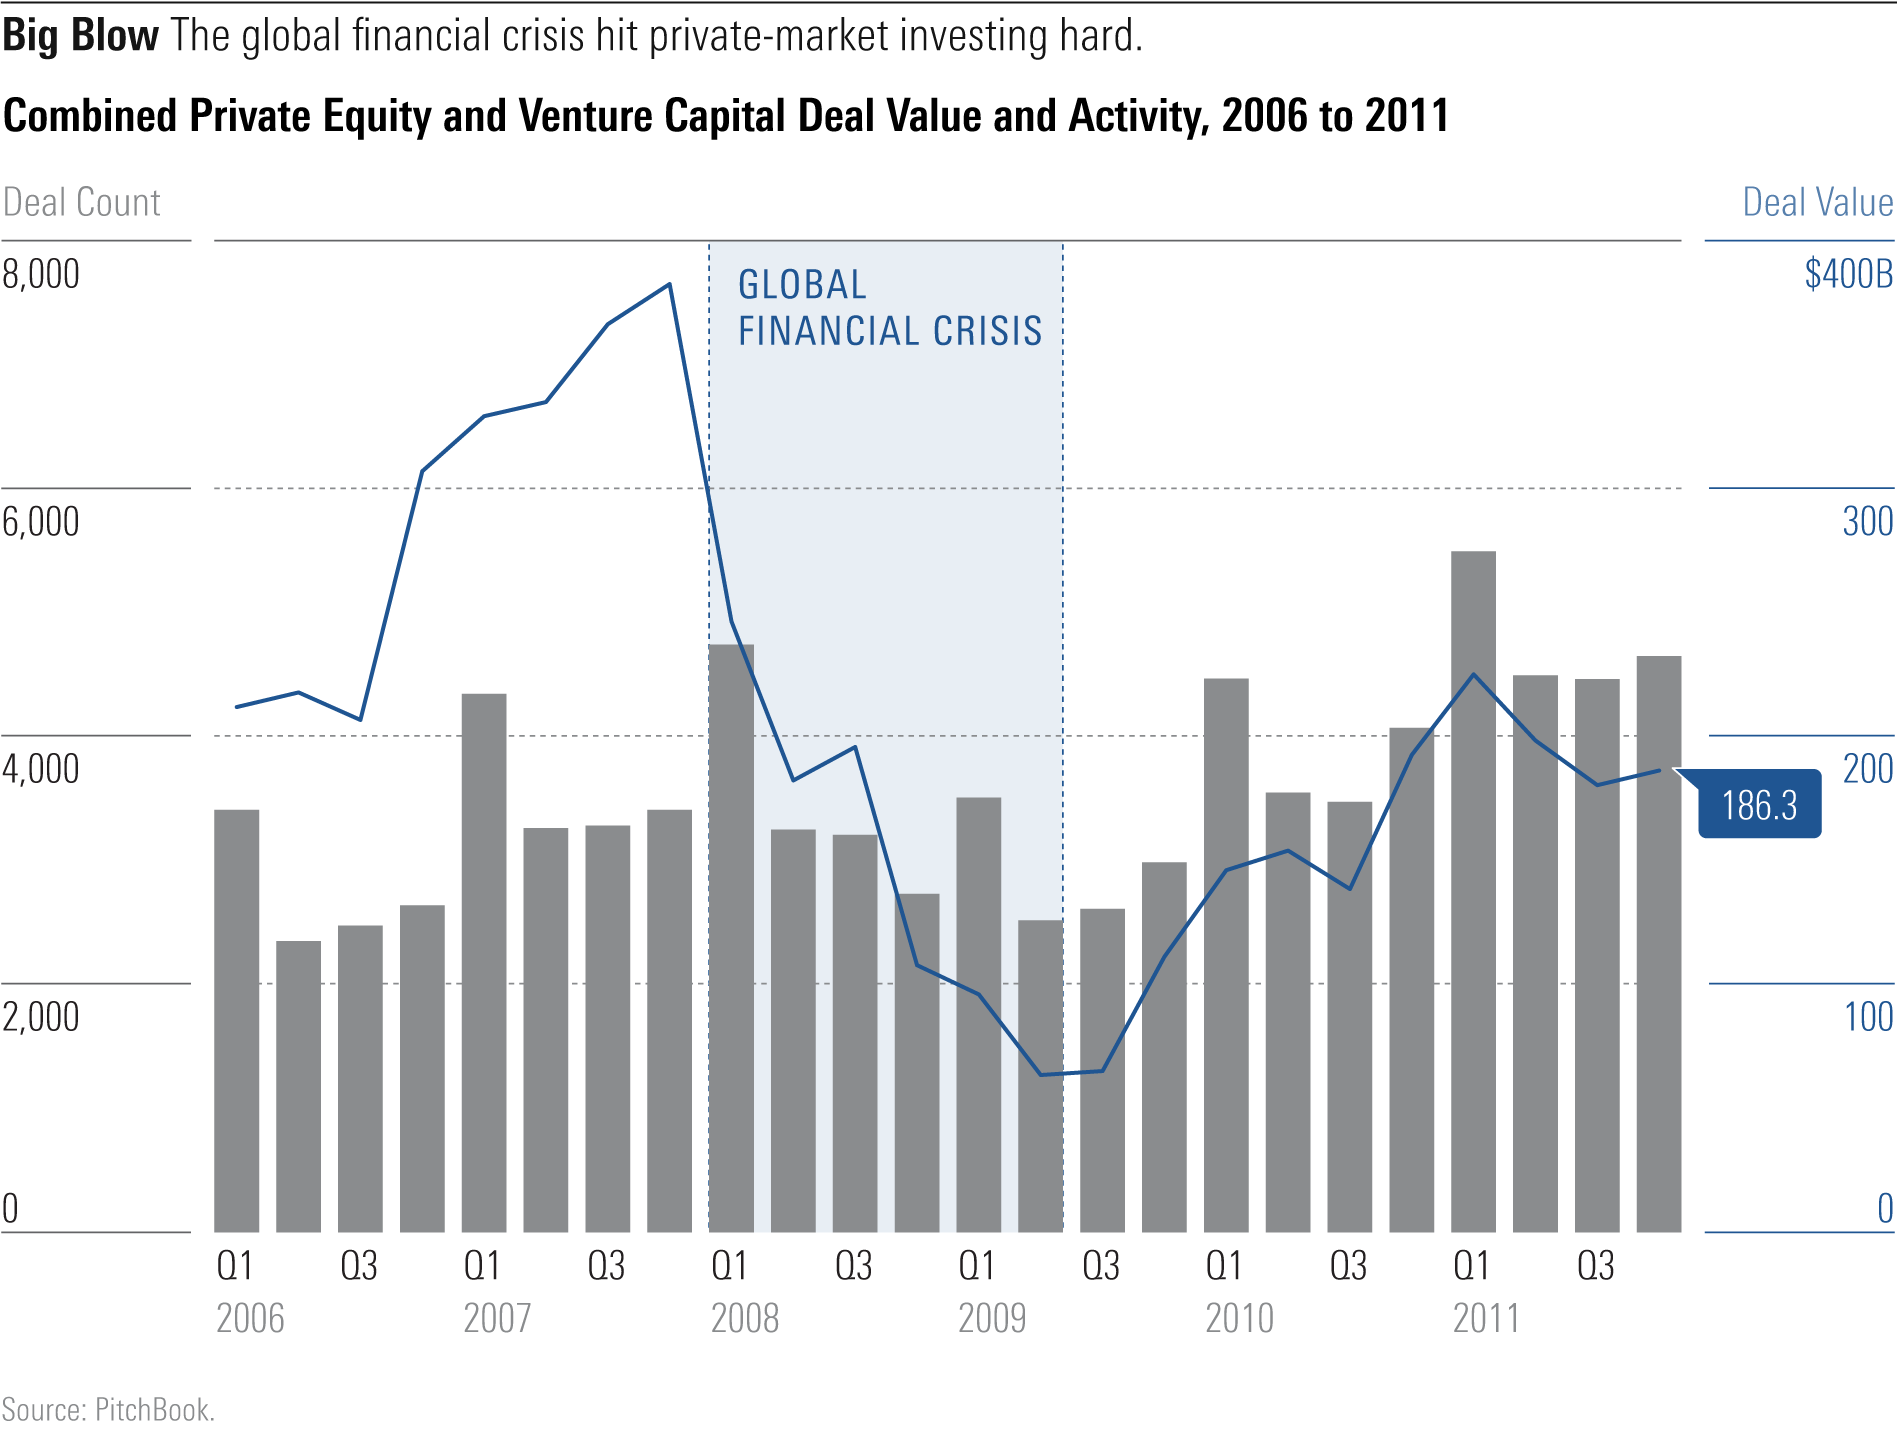
During the global financial crisis of 2007–09, private-market activity fell off a cliff. (See exhibit below.) Deal flow ground to a halt as access to leverage tightened and credit spreads widened. According to PitchBook, private deal value declined by a factor of 10 between the fourth quarter of 2007 and the second quarter of 2009. Blackstone’s share price reflected this drop, declining from more than $30 per share after its mid-2007 IPO to less than $5 in early 2009, then badly underperforming the market until 2020.
Private asset prices could have a long way to fall. The WeWork WE debacle, which saw the shared workspace provider’s valuation cut to $9 billion in 2021 from $47 billion in 2019, shows just how spectacularly wrong private markets can get valuation. The confluence of a flood of capital and easy money has undoubtedly created froth.
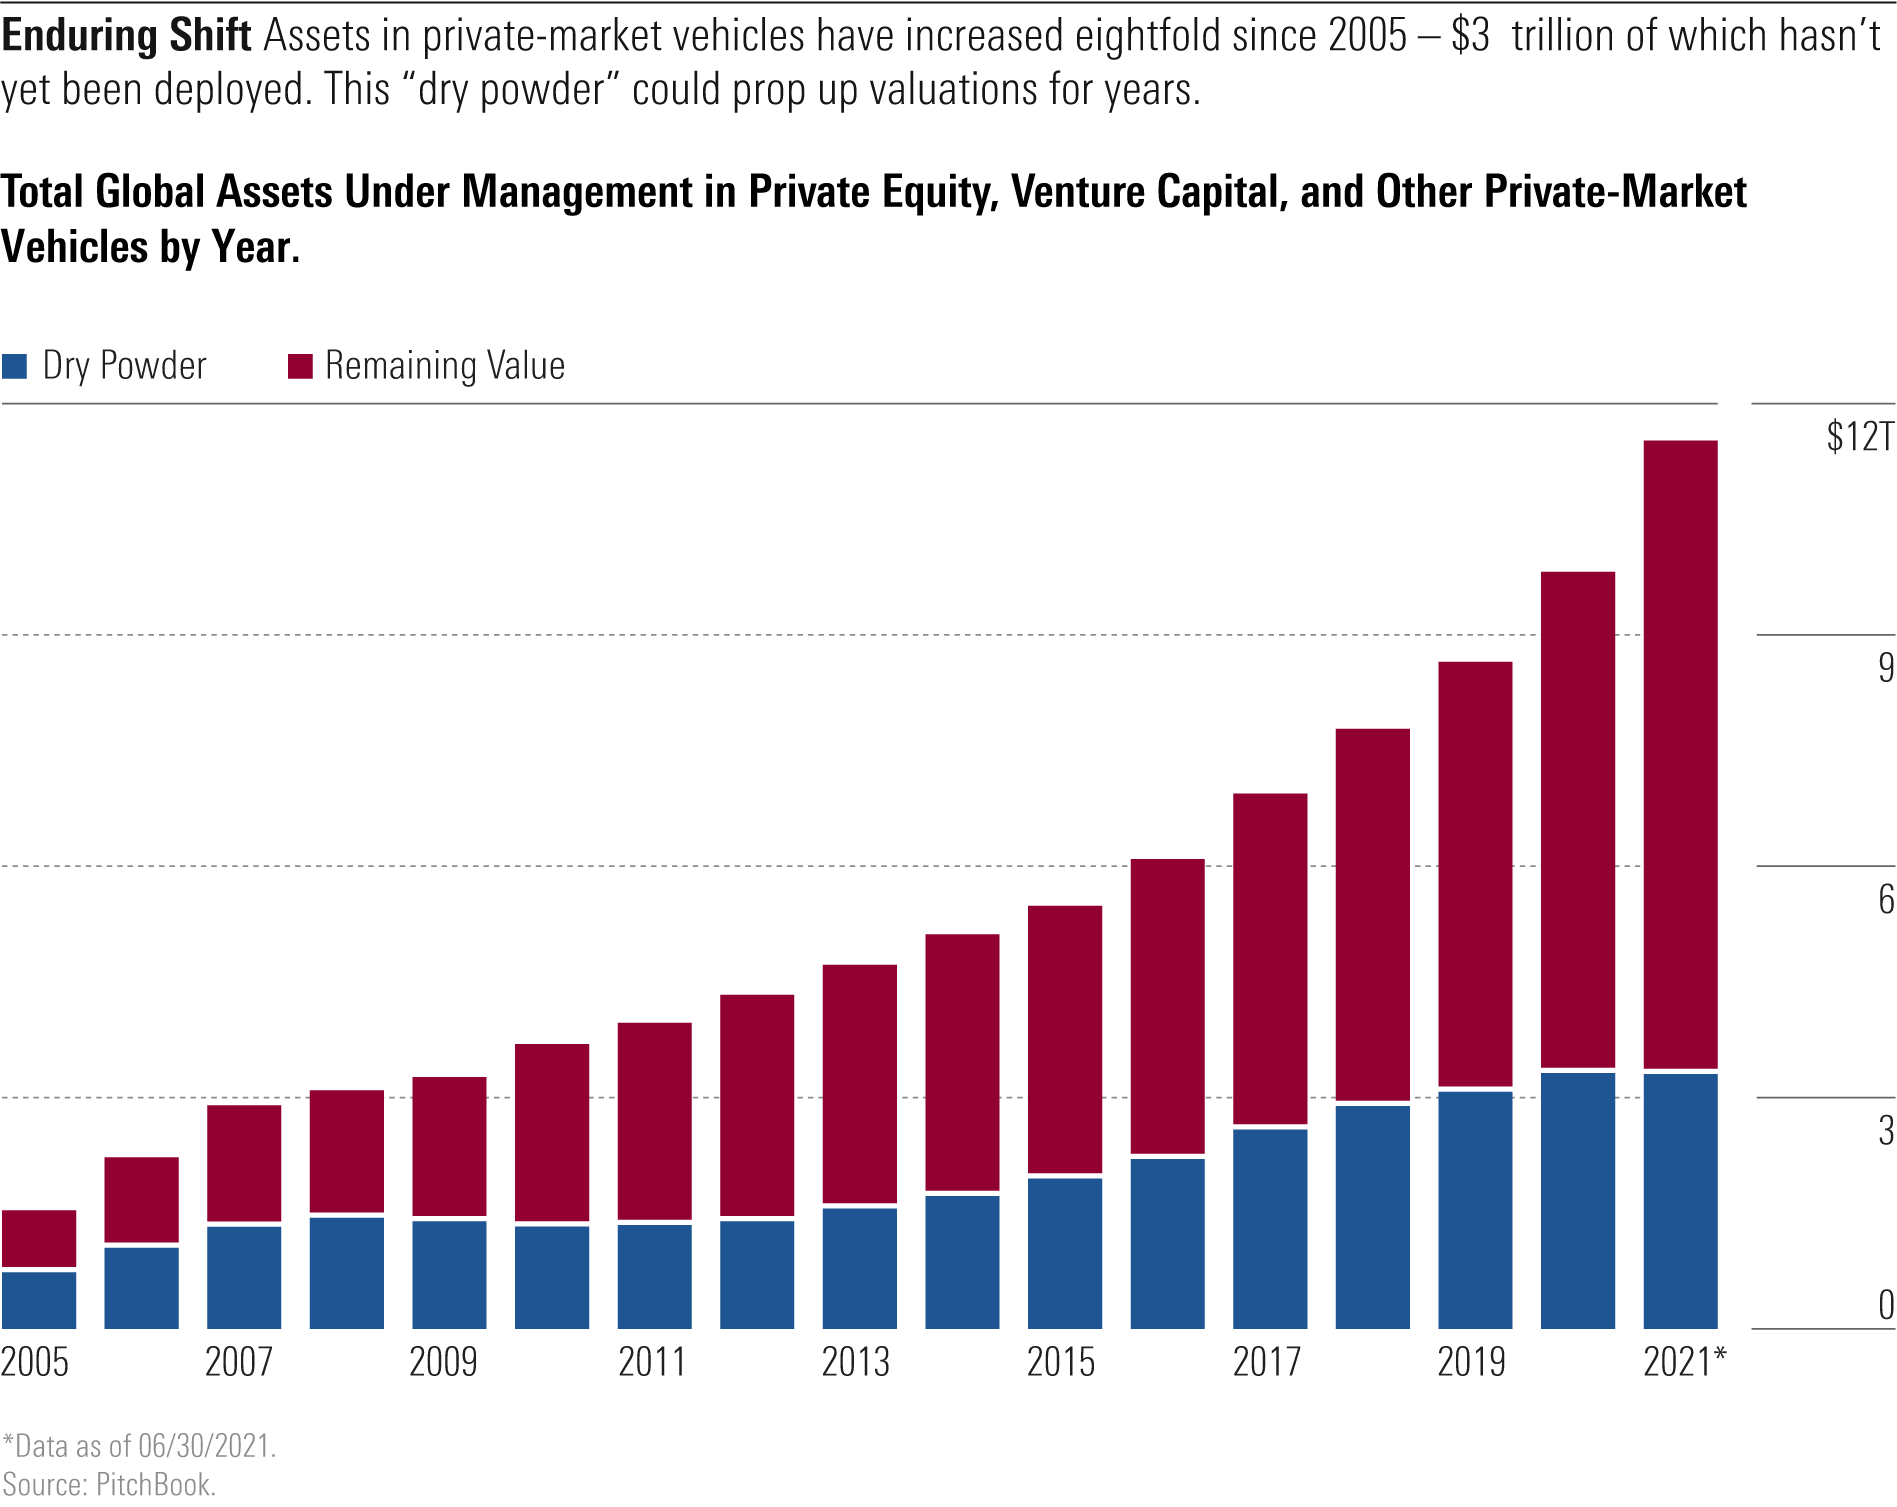
Here to Stay While cyclicality is endemic, the recent private-market boom reflects enduring structural shifts within the investment landscape. PitchBook data shows that private capital has grown nearly eightfold since 2005. (See exhibit below.) More than $3 trillion today sits in "dry powder," capital that has been committed by investors but has yet to be deployed. Long lockup periods required by private funds mean these assets will be seeking a home for years to come, potentially propping up valuations.
What’s the source of this capital? Large asset owners such as pensions, endowments, and sovereign wealth funds have made private assets a portfolio staple. This is partly imitation of the highly successful Yale University endowment model, which rode more than 30% in illiquid assets to peer-beating returns. It is also a reaction to low bond yields and a long bull market for public equities that has burnished the allure of (hopefully) noncorrelated assets.
In the United States, public pension plans now tend to hold close to 20% of their portfolios in private-focused investments, according to the National Association of State Retirement Administrators. A 2020 study of sovereign wealth and public pension funds concluded that private-market allocations rose to an average of 22%, up from 10% in 2008. Japan’s Government Pension Investment Fund, the world’s largest vehicle of its kind, has invested more than $11 billion in alternatives since first allocating to the asset class in 2017. Saudi Arabia’s public investment fund commits $2 billion per year to private-market investments.
For investors today, the opportunity set has changed profoundly. Despite the IPO frenzy of 2021, public markets are not what they once were. The number of public companies in the U.S. has declined from a peak of more than 8,000 in 1996 to roughly 4,000 today. Meanwhile, the number of U.S. private-equity-backed companies neared 10,000 in 2021. Globally, there are nearly 22,000 companies that are backed by private capital, up from roughly 3,000 in 2000.
But is there actually diversification benefit to private-market investing?
PitchBook analyst Andrew Akers found that a 20% allocation to randomly selected private equity buyout funds within a diversified portfolio added 0.6% worth of annualized excess return. He also observed a wide dispersion of returns across vehicles. So, fund selection matters.
Morningstar researcher Amy Arnott is not so sure. She cites research that finds that private and public equities are highly correlated.
Power Shift A range of factors explains this shift in the balance of power to private markets. Regulation, including the U.S. National Securities Markets Improvement Act of 1996 and the 2012 Jobs Act, made staying private more compelling. The 2002 Sarbanes-Oxley Act increased the burden on public companies. Stock market listing comes with costs, hassles, and disclosure requirements that many are keen to avoid. Wall Street's obsession with quarterly earnings provides another reason for companies to stay private.
Regulation could alter the public-versus-private calculus. But more transparency in private markets could attract more investors. What’s clear is that the mountain of capital sitting in private-market-focused funds means there’s simply less need for companies to list on exchanges in order to raise funds or create “liquidity events” for their investors. The fact is that these days, “capital formation” occurs in both public and private markets. In the words of a 2018 CFA Institute study:
“There are benefits to both public and private capital markets, and so the ability to allocate to both is important ... Having increasingly large sections of capital markets being out-of-bounds for pension savers is unlikely to be politically viable or even desirable in the long term ... It is not credible to allow an entire generation of retail investors to be left with only diversified public market exposure to generate retirement returns, while institutional investors crowd into innovative business models that offer potentially higher returns.”
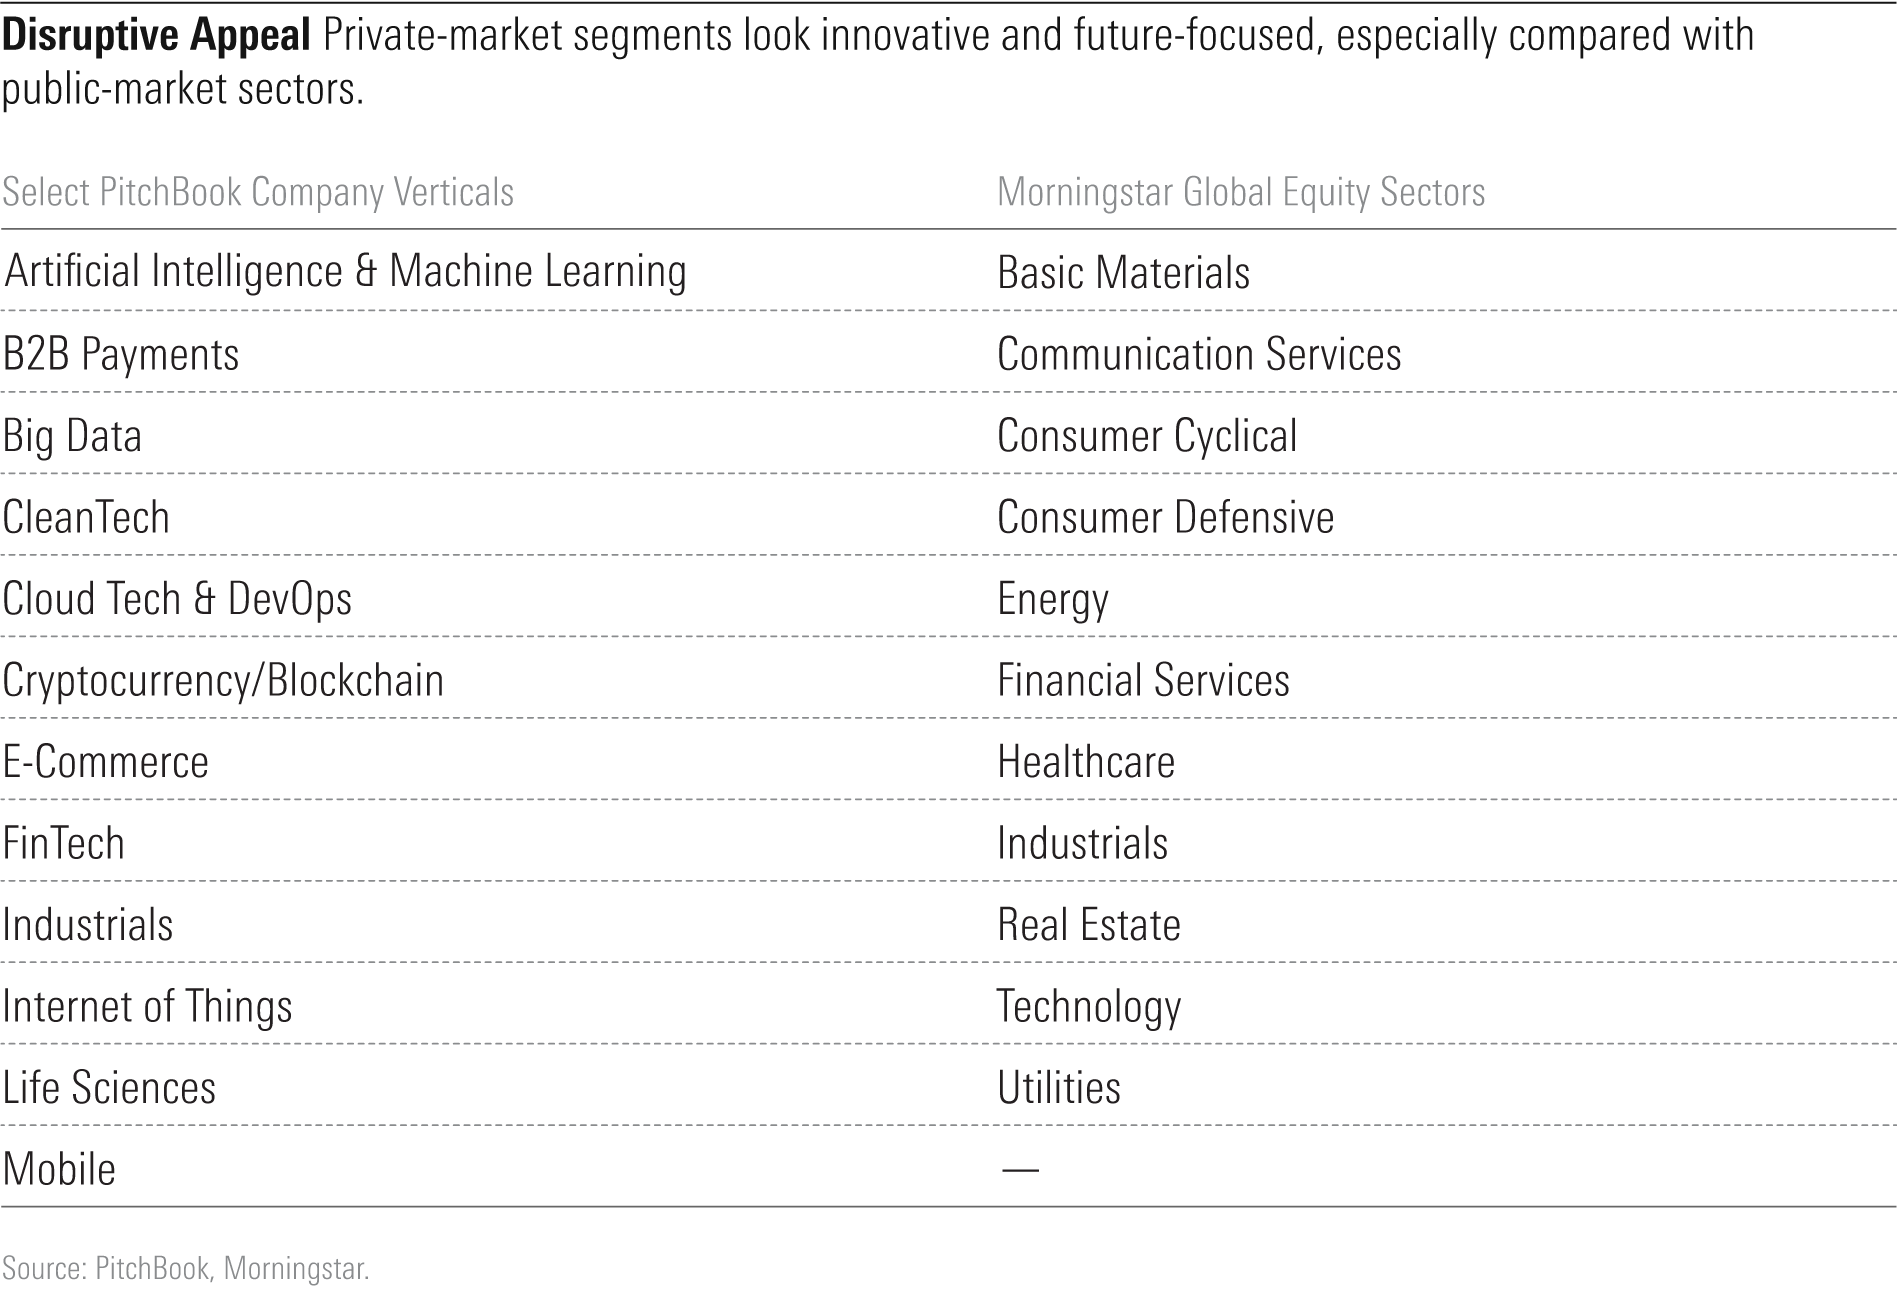
How different are public and private markets in composition? Consider PitchBook's so-called verticals, or company classifications, compared with Morningstar's public equity sectors. (See next exhibit.) It's hard not to get excited about the innovation focus of private markets.
Not just T. Rowe Price but a range of traditional asset managers have heeded the siren song of private markets. A Morningstar report called Unicorn Hunting tracks mutual funds’ exposure to private, mostly venture-capital-backed companies. Fidelity Contrafund FCNTX, to take one example, owns stakes in SpaceX, Rad Power Bikes, and Stripe.
Many saw Vanguard’s 2020 foray into private equity products as a marker of their mainstreaming. A Vanguard paper expressed a goal of broadening access to a “distinct and growing segment of world equity markets that, because of its significant illiquidity and other market dynamics, offers suitable investors the opportunity to earn long-term excess returns while increasing portfolio diversification.” The fund is limited to institutional investors, however.
High Fees On the heels of the Vanguard launch, the U.S. Department of Labor opened up the 401(k) market to the asset class. But slow takeup prompted Jason Kephart and Erol Alitovski of Morningstar Manager Research to title an article: "Private Equity and Target-Date Funds: An Unrequited Love Story." They cite high fees as the main barrier.
Indeed, private-focused funds have escaped the kind of fee pressure that has squeezed traditional asset managers. In an era of zero-expense-ratio mutual funds, management fees charged by private equity, venture capital, and other private-market-focused funds have actually crept higher, according to PitchBook data. (See next exhibit.) A third of private funds with vintage years 2018 to 2021 carried management fees of 2% or more.

Blackstone and the other constituents of Morningstar’s listed private equity index benefit from these high fees. Competition, scrutiny, regulation, or other forces may eventually bring them down. Yet private-market exposure is hard to replicate in the same way as stocks and bonds. There’s no investable beta to serve as a passive alternative and exert fee pressure.
For some investors, listed private equity represents an access route to private markets. Its benefits are low minimums and ease of trading and tracking. Its drawbacks are indirectness, volatility, and correlation with public markets.
Change Is Coming Former SEC chair Jay Clayton said, "I continue to worry that retail investors do not have access to as broad a slice of our capital markets as I would like them to have." On this logic, regulators across the globe are loosening restrictions, giving rise to platforms facilitating retail investments in private companies. Democratization is needed. As investors of all types—from the world's largest asset owners to individuals—seek to gain access to private assets, development in this area is sure to continue.
Dan Lefkovitz is a strategist, Morningstar Indexes.
Disclosure: Morningstar, Inc. licenses indexes to financial institutions as the tracking indexes for investable products, such as exchange-traded funds, sponsored by the financial institution. The license fee for such use is paid by the sponsoring financial institution based mainly on the total assets of the investable product. Please click here for a list of investable products that track or have tracked a Morningstar index. Neither Morningstar, Inc. nor its investment management division markets, sells, or makes any representations regarding the advisability of investing in any investable product that tracks a Morningstar index.
Morningstar, Inc. licenses indexes to financial institutions as the tracking indexes for investable products, such as exchange-traded funds, sponsored by the financial institution. The license fee for such use is paid by the sponsoring financial institution based mainly on the total assets of the investable product. A list of investable products that track or have tracked a Morningstar index is available on the resources tab at indexes.morningstar.com. Morningstar, Inc. does not market, sell, or make any representations regarding the advisability of investing in any investable product that tracks a Morningstar index.
/cloudfront-us-east-1.images.arcpublishing.com/morningstar/FNDLNORUIBFD5KKEXASUD67L6Q.png)
/cloudfront-us-east-1.images.arcpublishing.com/morningstar/BHGJBKNFZRB7NHXO3ZLRNAHOIY.png)
/cloudfront-us-east-1.images.arcpublishing.com/morningstar/RENAPI2NVVDIDCNNAGV6XAUCM4.jpg)
:quality(80)/s3.amazonaws.com/arc-authors/morningstar/033528a9-55cc-40aa-90a9-8d2d98697cf5.jpg)