13 Charts on the Market’s First-Quarter Performance
Investors face losses on stocks and bonds after a volatile quarter.
From the opening days of 2022, investors were taken on a wild ride during a first quarter that featured wide swings in stock, bond and commodity markets around the world.
Stocks took a dive as the market reassessed the potential of the Federal Reserve setting out a more aggressive path for interest-rate hikes to help curb inflation that hit a 40-year high. Bond prices slid, sending yields higher. In a knock-on effect of rising yields, some of the stock market’s strongest performers in recent years, such as Nvidia NVDA and Microsoft MSFT, saw share prices fall sharply.
Just as markets seemed to be stabilizing in February, Russia invaded Ukraine, sending oil and other commodity prices soaring. Stocks fell into official correction territory, falling more than 10% from their all-time highs. The slide in bond prices caused some of the worst losses in years. All of this was reflected in an increase in trading volatility.
By the end of the quarter, U.S. stocks staged a strong recovery, cutting much of their losses. Nvidia closed the quarter down about 7.2% after dropping as much as 27.5% in mid-March.
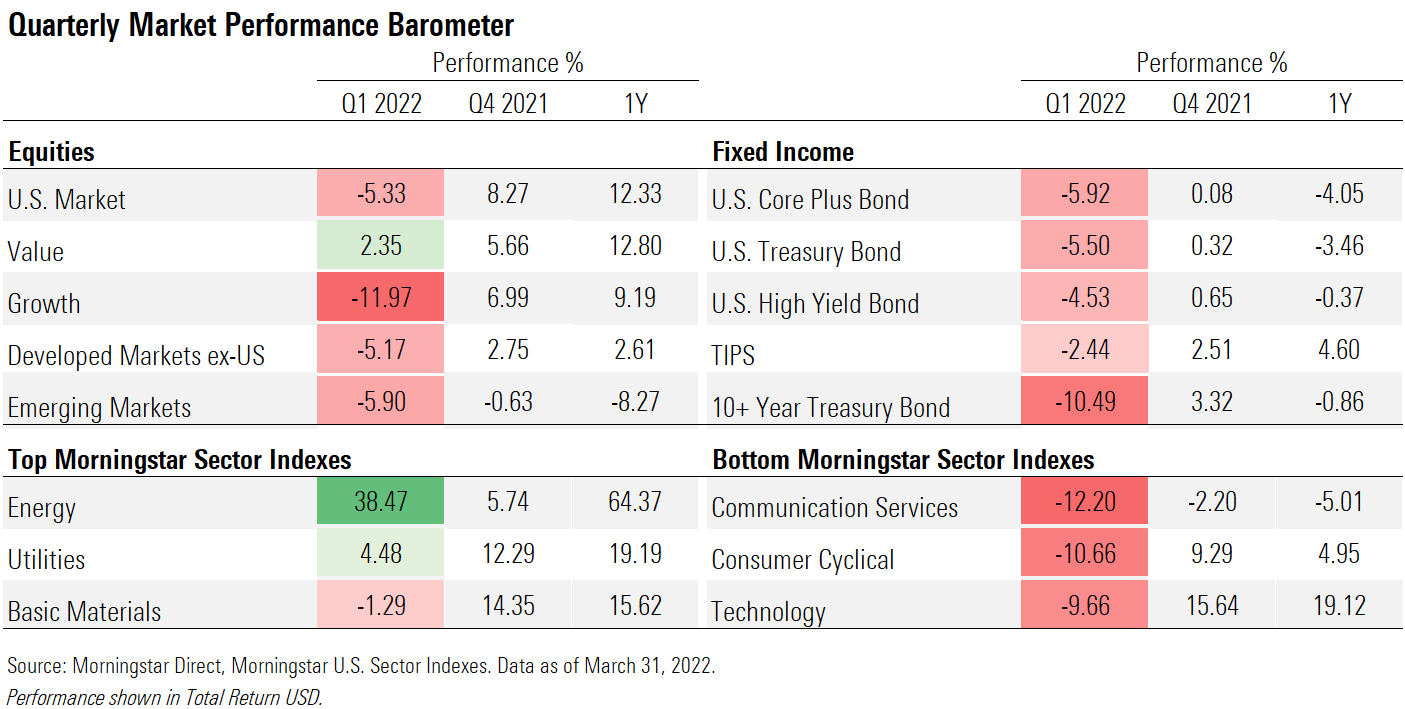
First-quarter statements will show widespread losses for many investors. The Morningstar US Market Index lost 5.3% in the first quarter, and the Morningstar US Core Plus Bond Index fell 5.9%.
Here are some of the other notable first-quarter stats:
• At its worst levels, the Morningstar US Market Index was down 13.6% from its Jan. 3 peak. It then rallied back 8.9% from its lows by the end of the quarter.
• U.S. stocks finished the quarter up 12.3% from one year ago and are up 18.3% per year for the last three years.
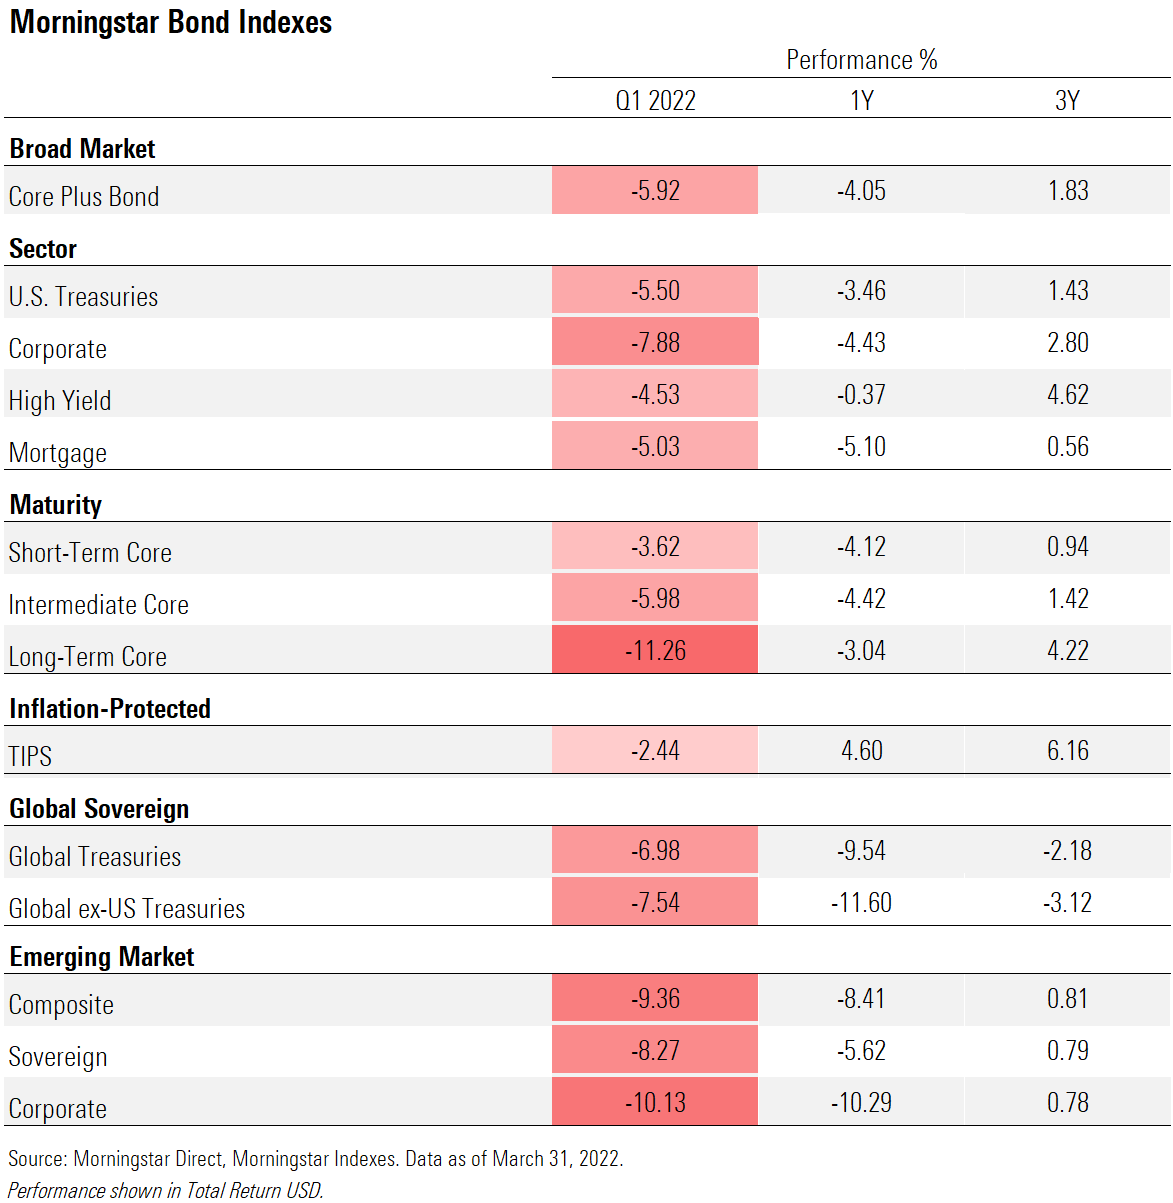
• Bonds had their worst quarter in 20 years, with long-term core bonds down 11.3%.
• Stocks and bonds, which often move in opposite directions, both finished in the red--an occurrence not seen since the first quarter of 2018.
• The Morningstar US Large Value Index outperformed the US Large Growth Index by more than 15 percentage points. Overall, value outperformed growth by over 14 percentage points.
• The Morningstar US 5-10 Year Treasury Bond Index is down 5.9% so far in 2022, and has lost some 9.9% since its last peak in August 2020, the largest such drawdown in its history.
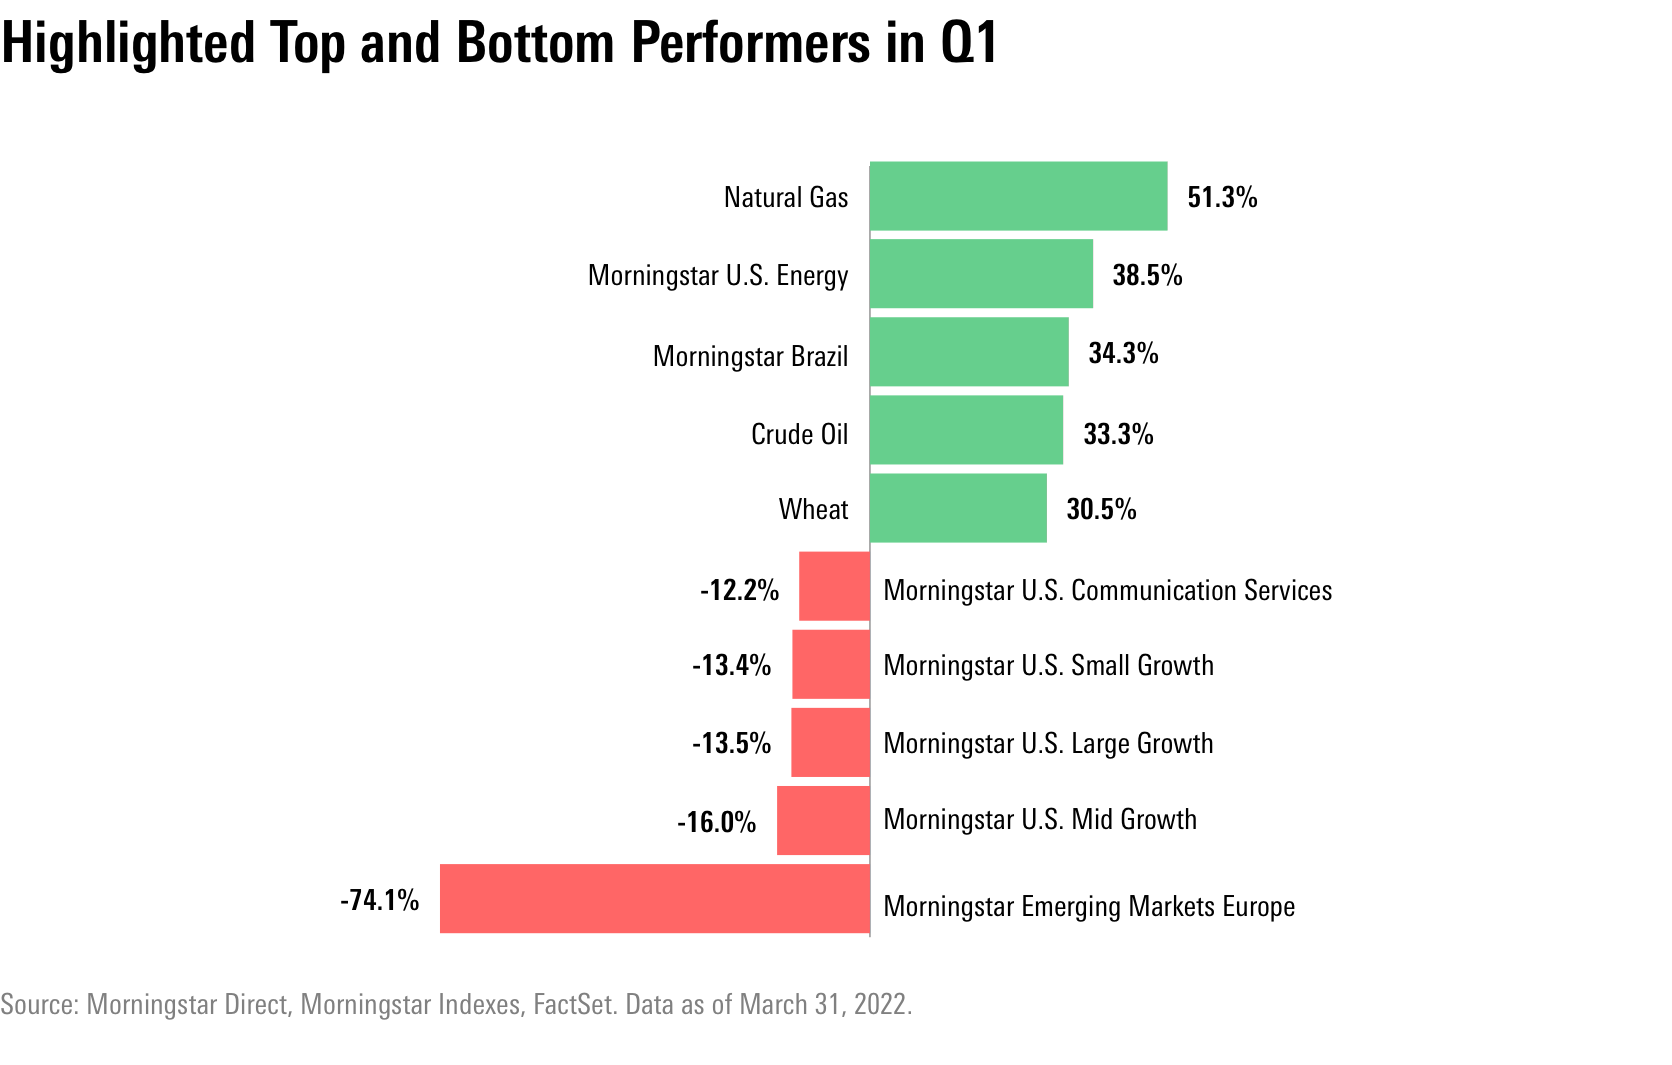
• Commodity prices surged, with oil finishing up 33% despite a decline of 20% from its high in the quarter.
Taking a broad look across global markets, the biggest winners were commodities, especially those affected directly or indirectly by Russia’s attack on Ukraine, such as wheat and oil. On the flip side, rising interest rates hit both bonds and growth stocks.
Bonds Took Big Losses in First Quarter
For all the attention on stocks, bond performance is perhaps the bigger story. The asset class saw its worst quarter in over 20 years.
As stubbornly high inflation had the Fed embarking on a path of more aggressive rate increases than was expected at the start of the year, bond investors are facing some of their worst losses in years. Hardest hit were longer-term bonds, which have the greatest sensitivity to interest-rate changes.
Yields Rose as Inflation Continued to Run Hot
With inflation running hotter than expected, the closest sector to a haven for bond investors in the U.S. has been Treasury Inflation-Protected Securities--better known as TIPS. While the losses might come as a surprise to some investors given the rise in inflation, TIPS have taken a hit from rising rates along with the rest of the bond market. The Morningstar US TIPS Index is down a relatively modest 2.4% for the year to date, ahead of all other Morningstar fixed income indexes. In 2021, TIPS returned 5.7%.
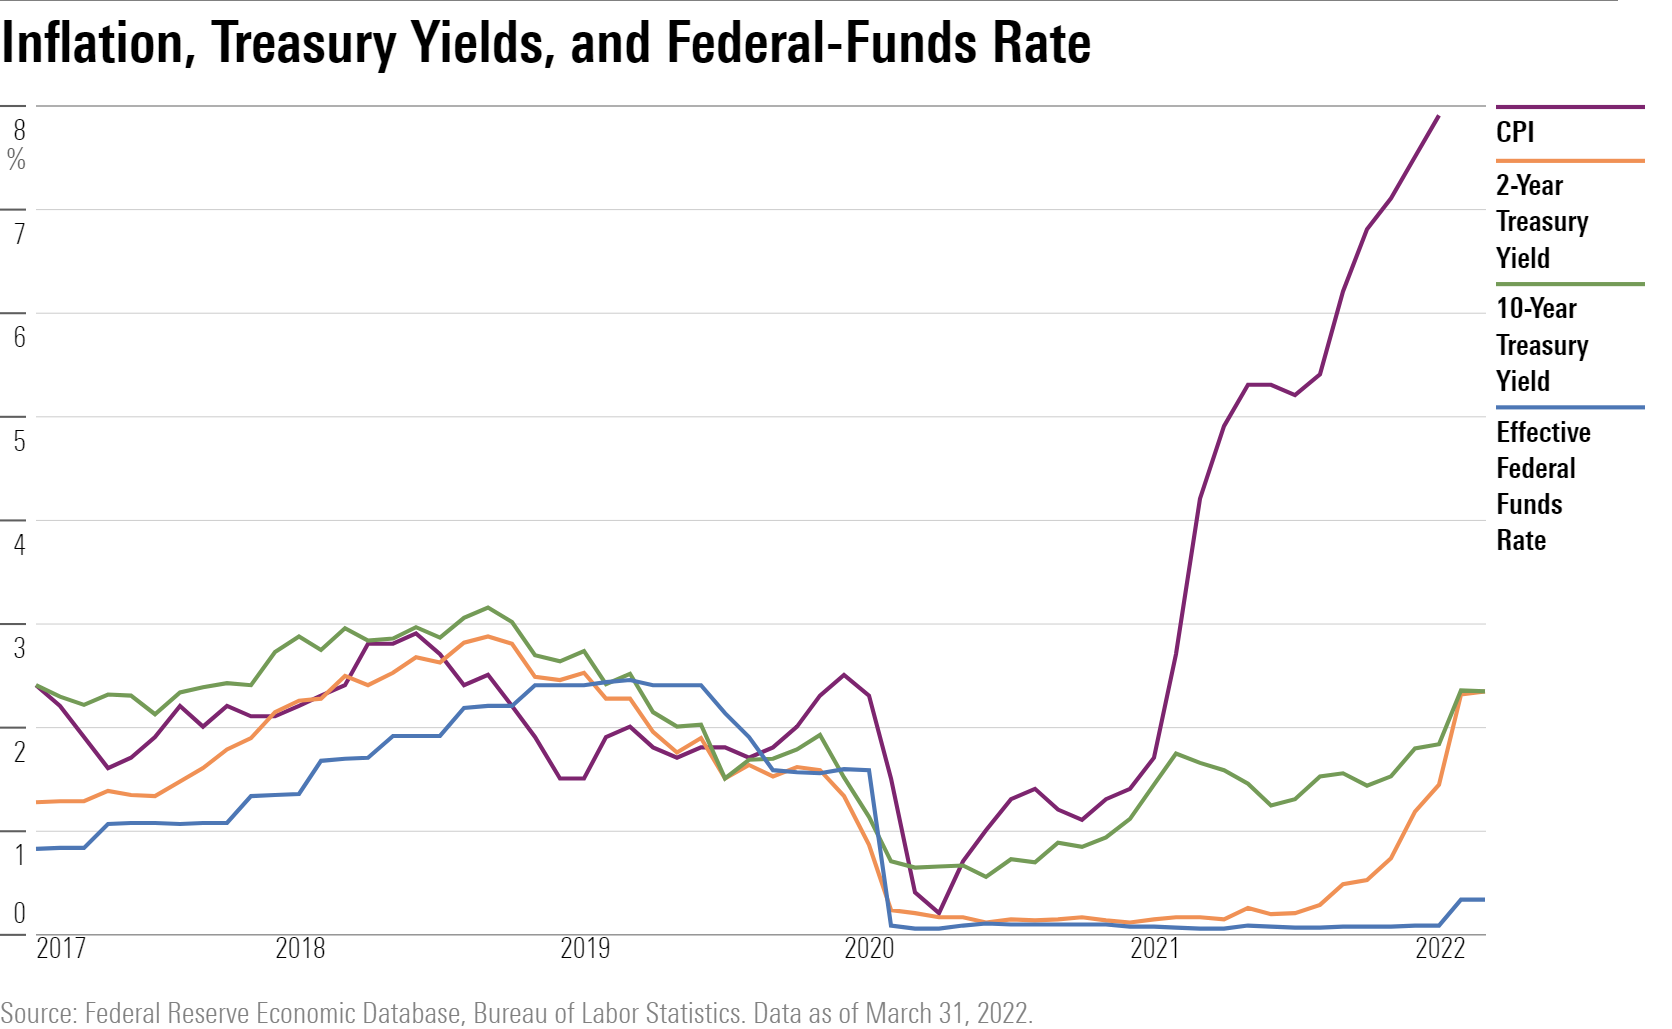
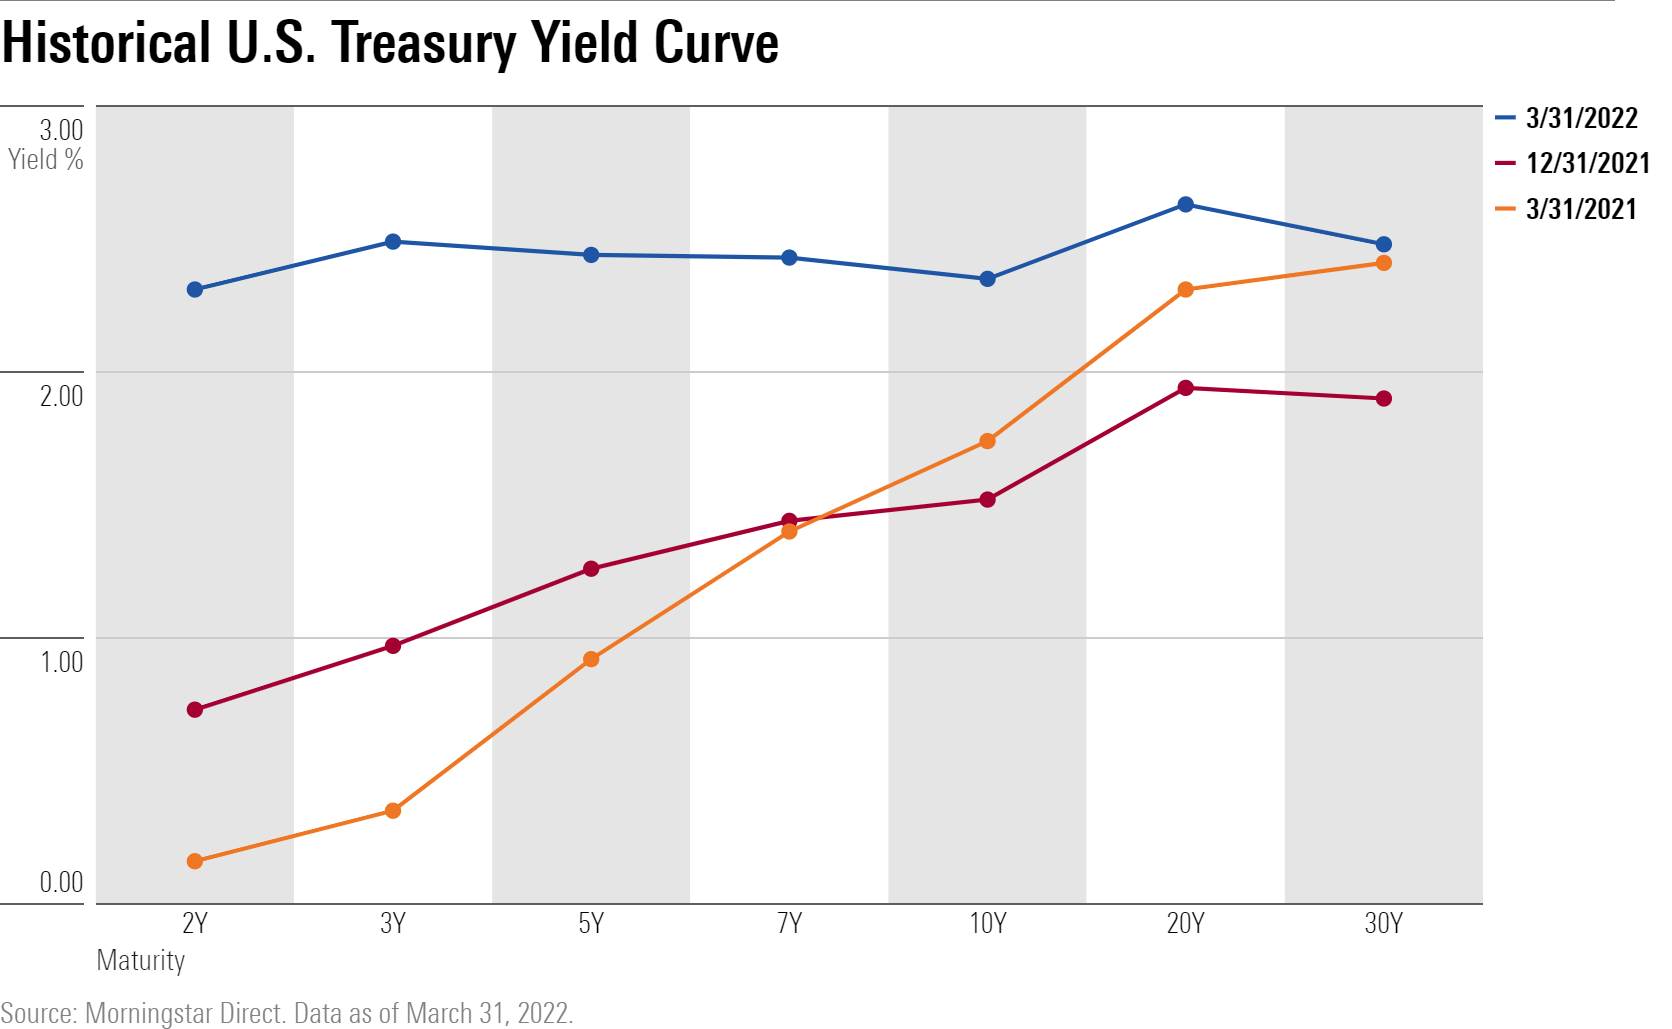
The big issue for the bond market was the continued upward pressure on inflation as the consumer price index registered its biggest increases in 40 years. With inflation well above the Fed’s 2% target rate, policy makers raised the federal-funds rate by a quarter point. Yields on both short- and long-term bonds jumped to their highest level in years. The U.S. Treasury two-year note rose to 2.28% from 0.73% at the end of 2021, while the yield on the 10-year rose to 2.32% from 1.5%.
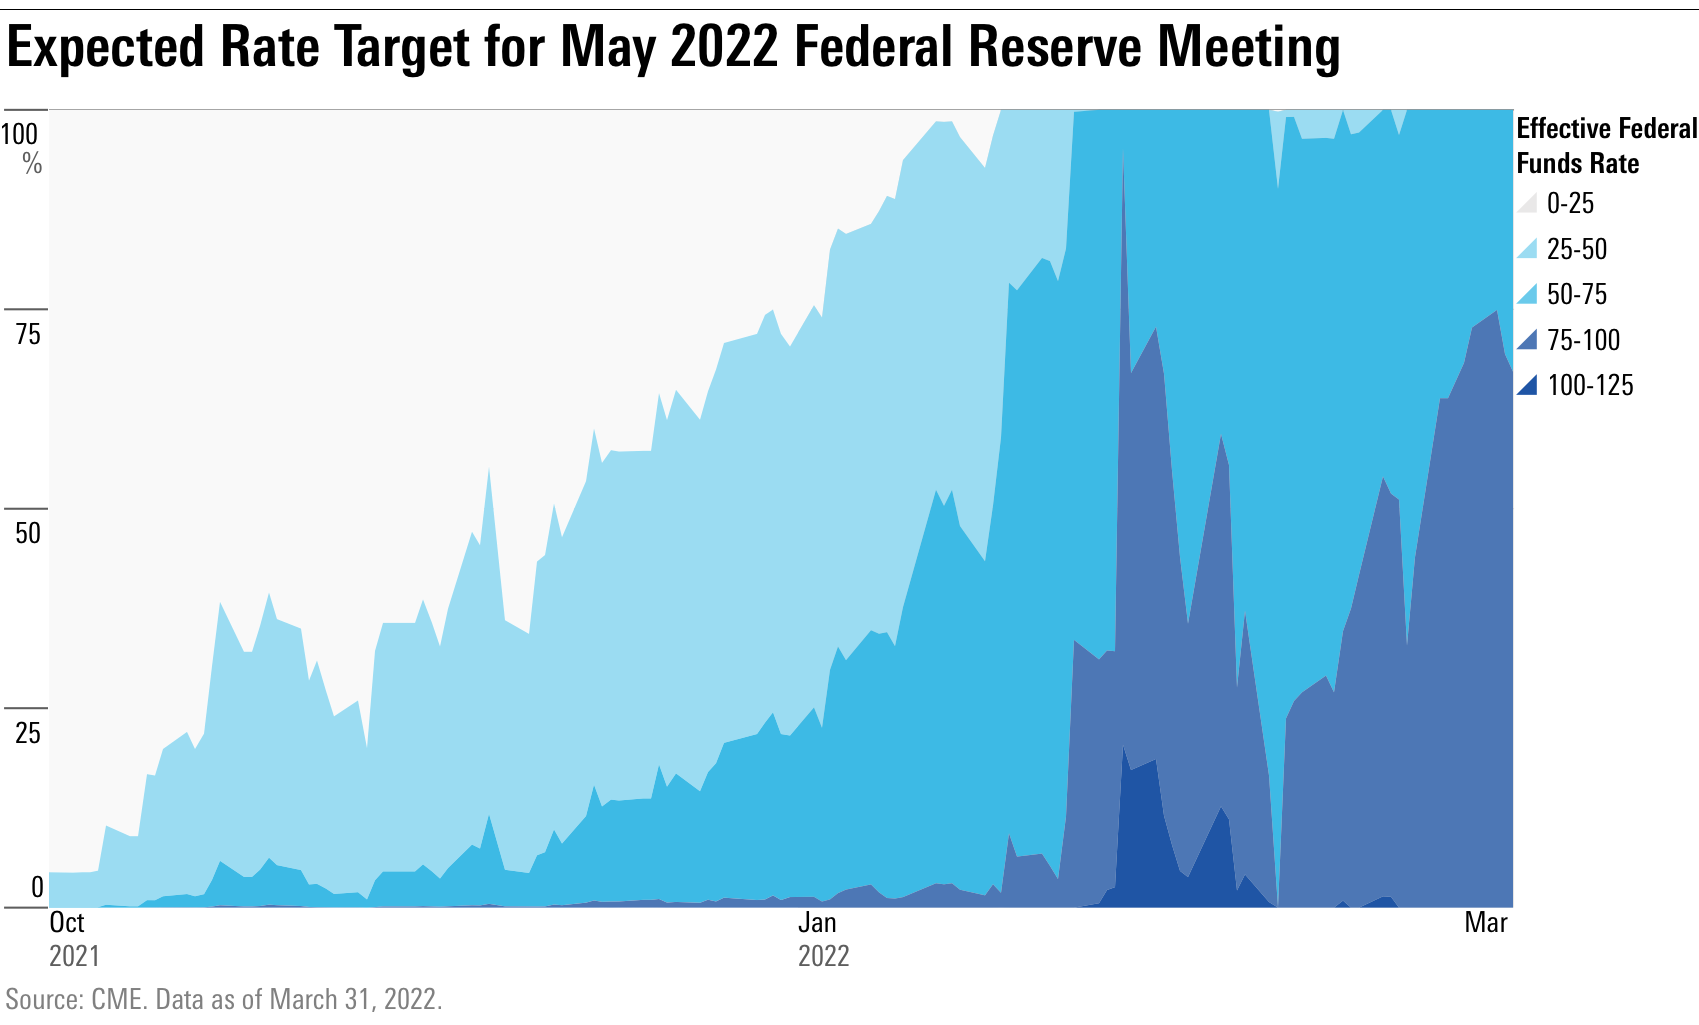
Expectations for future rate hikes swung widely, but as the quarter ended, the bond market priced for the Fed to move rates much higher, faster than had been the case at the start of the year. As of March 31,
the funds rate by a half point at both its May and June meetings.
Another aspect of the bond market’s first-quarter selloff was a shrinking gap between long- and short-term Treasury yields. The difference between the two began to level out in a trend known as a “flattening yield curve.”
On the final day of the quarter, the yield on the Treasury two-year note closed in the on the 10-year, on its way to moving over the 10-year in what is known as an “inverted yield curve.” Historically, inverted yield curves have preceded recessions.
A Nearly Round Trip for Stocks in Q1
U.S. stocks lost ground during the first quarter of 2022, finishing down 5.3%--making for the worst start to the year since the coronavirus pandemic in the first quarter of 2020. In 2021, U.S. stocks rose 25.8%.
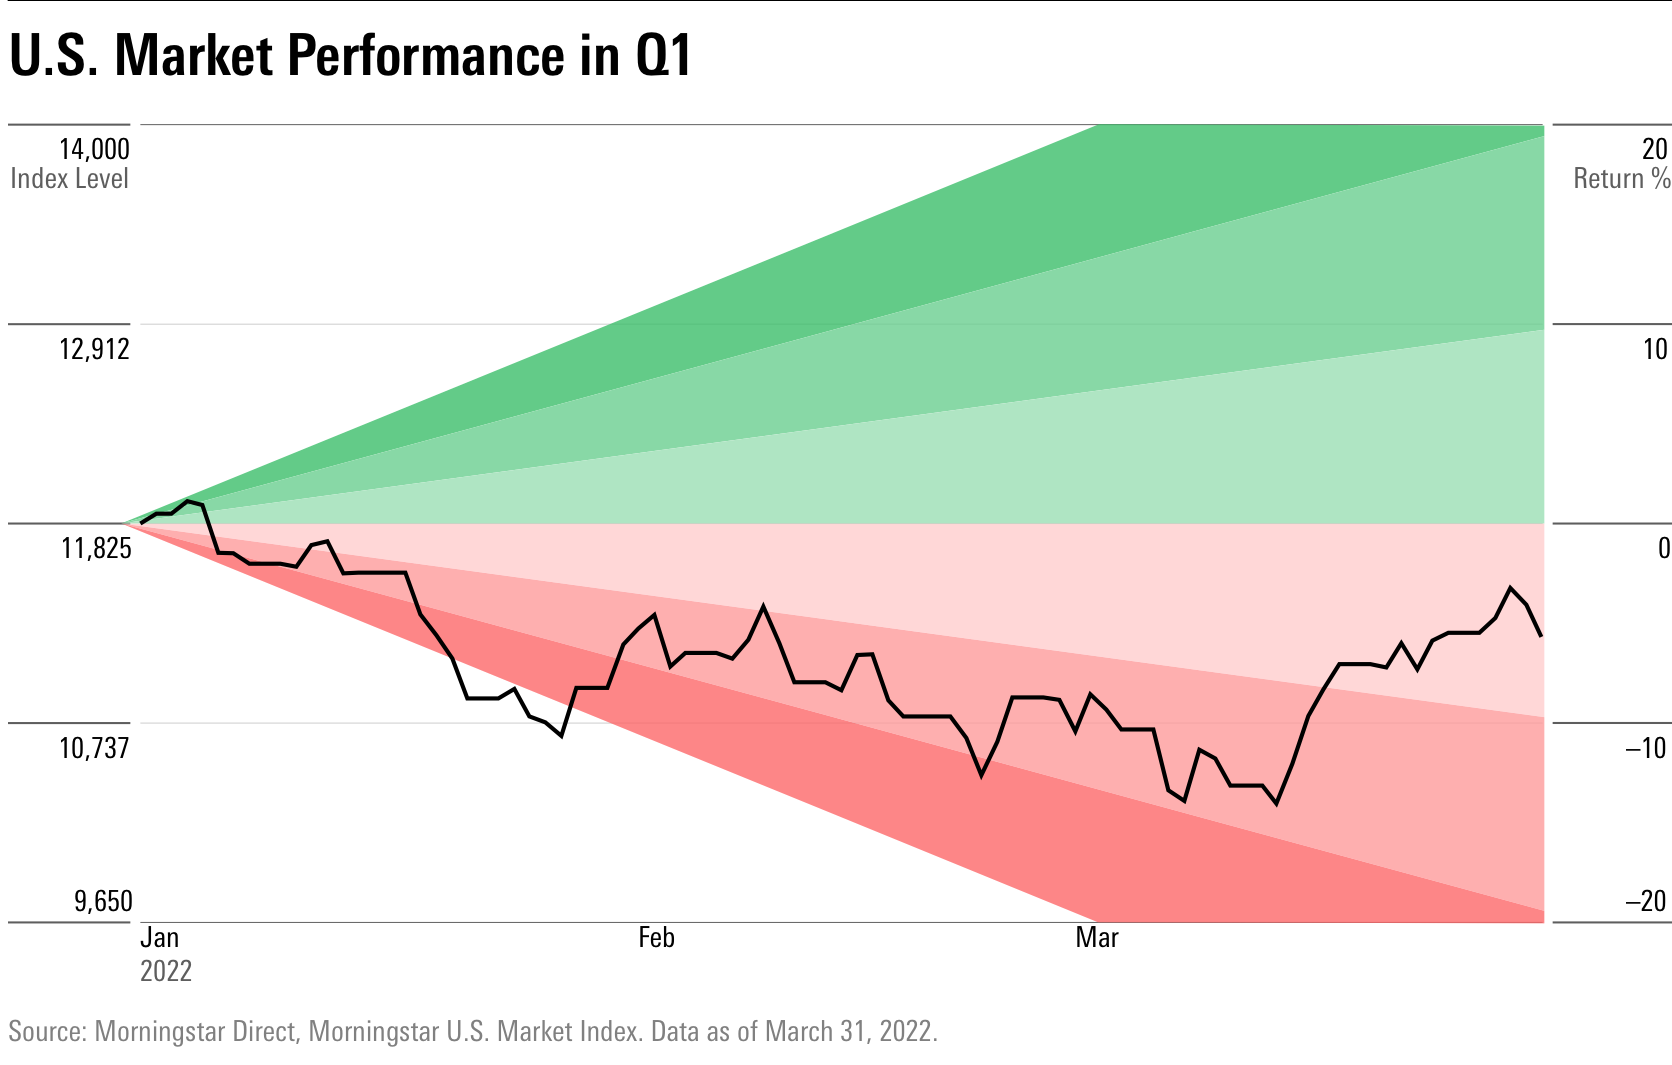
Even with the market’s down performance during the first quarter, the U.S. Market Index was up 12.3% over the last 12 months and up an average of 18.3% per year for the last three years and 15.5% per year for the last five years.
Volatility Jumped Across Markets
Across global financial markets, the first quarter was marked by big swings in prices. The initial spark for the volatility was the sudden shift in expectations around the Fed in the opening days of January, later fueled further by Russia’s war against Ukraine.
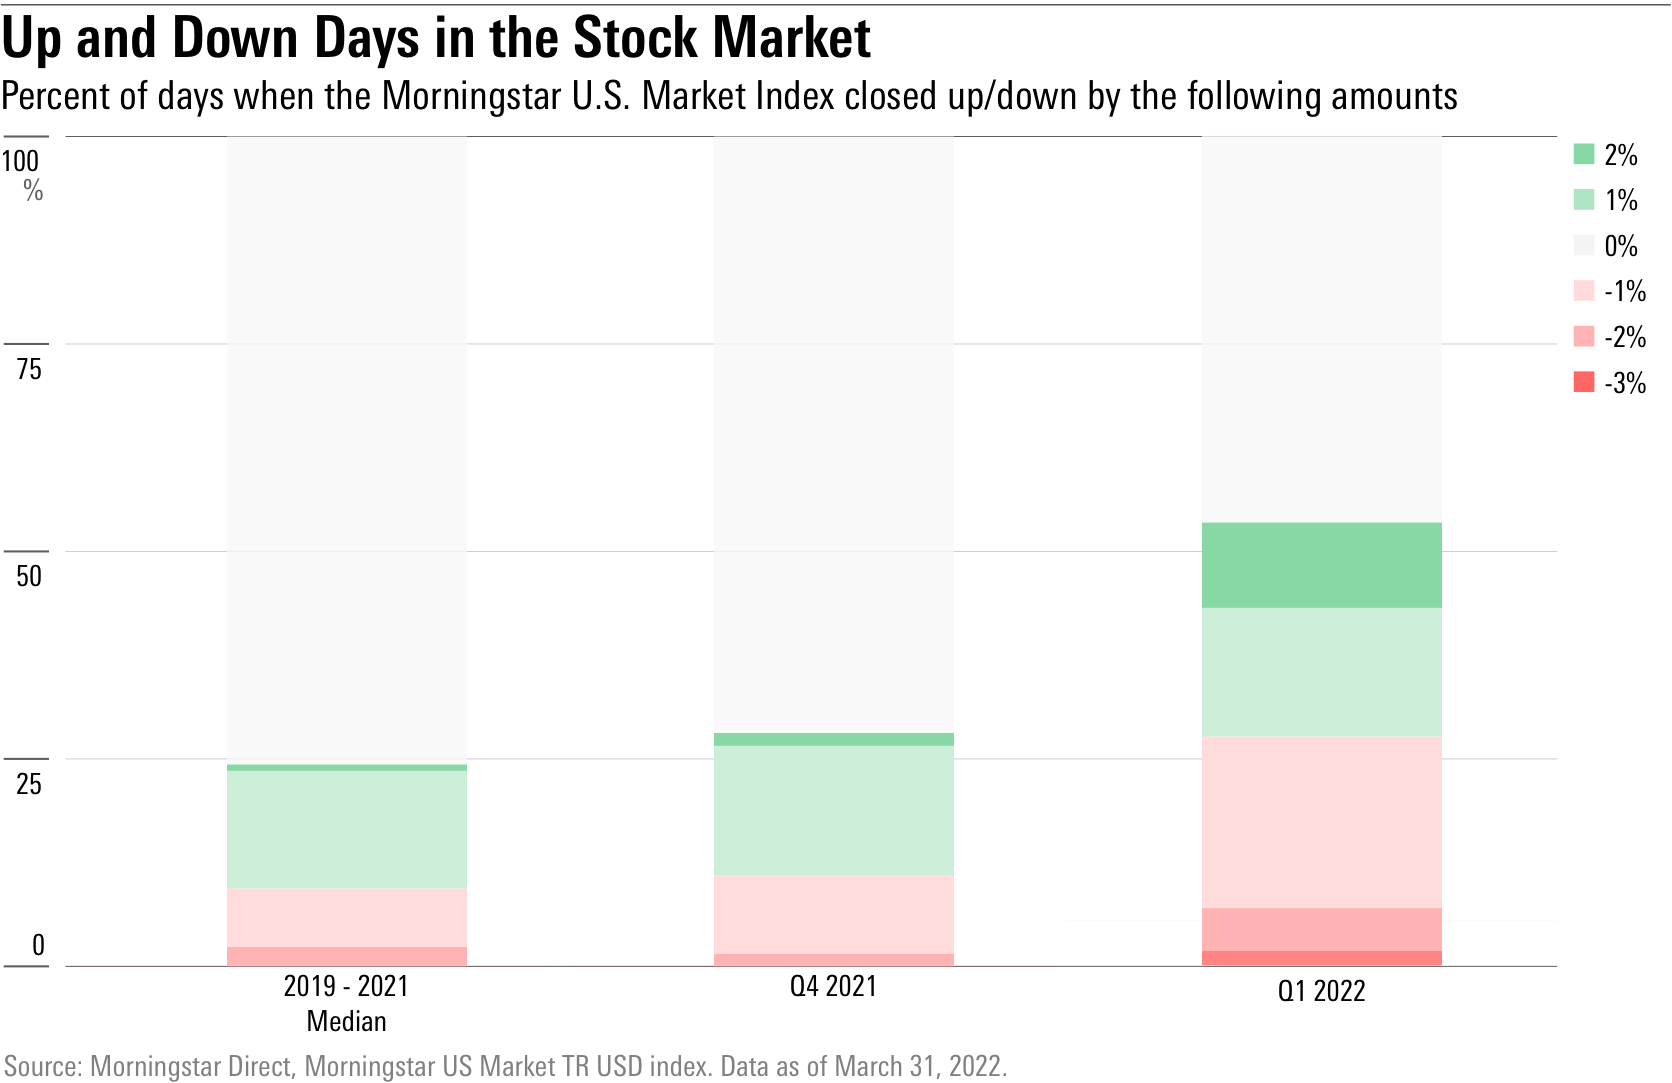
In the stock market, that volatility showed itself in the number of big up or down days, where the quarter was over twice as volatile as the median quarter over the past three years.
The Morningstar US Market Index closed down between 1% to 2% on 13 days, and down 2% to 3% on three days. On March 7, the index lost 3.1% in its biggest one-day drop since the worst of the pandemic-driven bear market in March 2020.
Amid the volatility, there were also a number of sessions where the market saw outsize gains. The Morningstar US Market Index gained 2% to 3% on six days. Those kinds of rallied have typically been seen just once per quarter in the past three years.
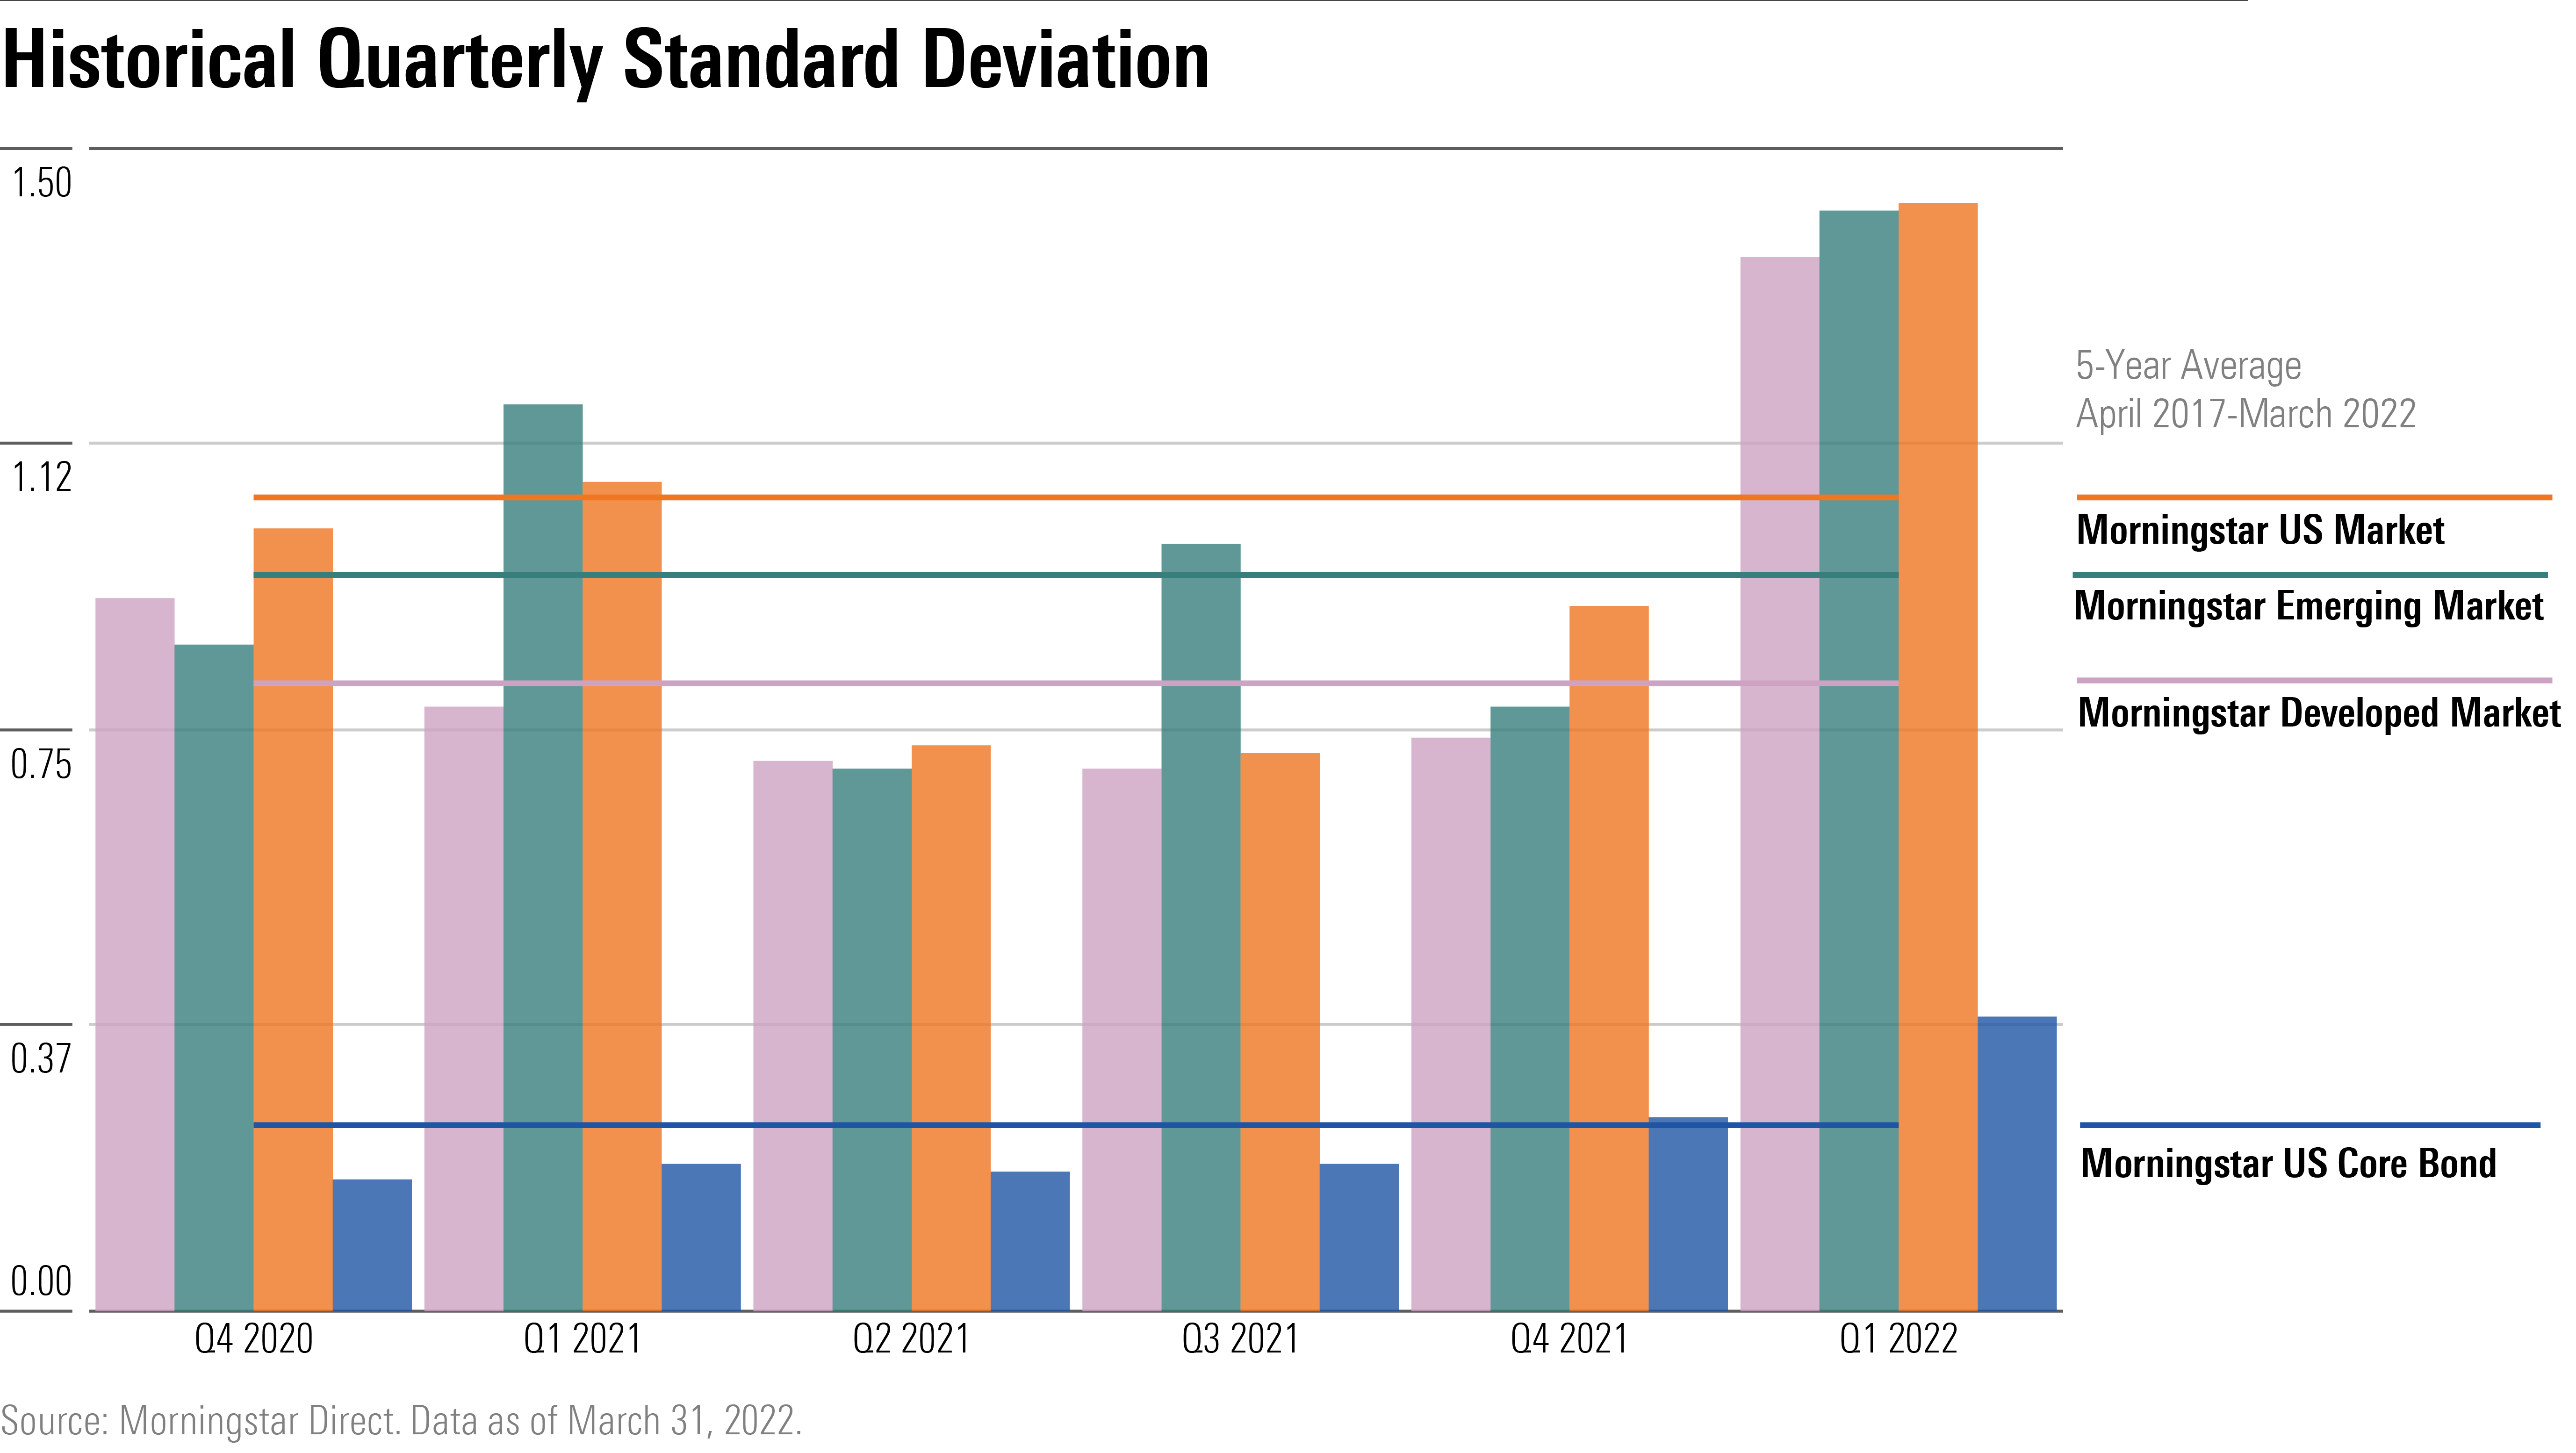
Standard deviation, another common metric investors use to measure volatility, showed the extent of price swings across different asset classes. U.S. and non-U.S. developed-markets stocks, emerging markets, and U.S. bonds all saw an increase in volatility.
Value Stocks Far Outperformed Growth
Within the Morningstar Style Box for stock performance, the gap between value and growth was stark and was significantly in favor of value. The declines in growth stocks were sparked by a combination of high valuations for many names and the jump in interest rates.
Morningstar’s US Value Index rose 2.3% for the quarter, while the Morningstar US Growth Index lost 12%. Mid-value stocks led the quarter with gains of 4.9%, led by Archer-Daniels Midland ADM, up 34.2%, and Valero Energy VLO, up 36.7%. Mid-growth stocks pulled the rest of the market lower with declines of 16%--principally affected by Facebook parent company Meta FB, which lost 33.9%.
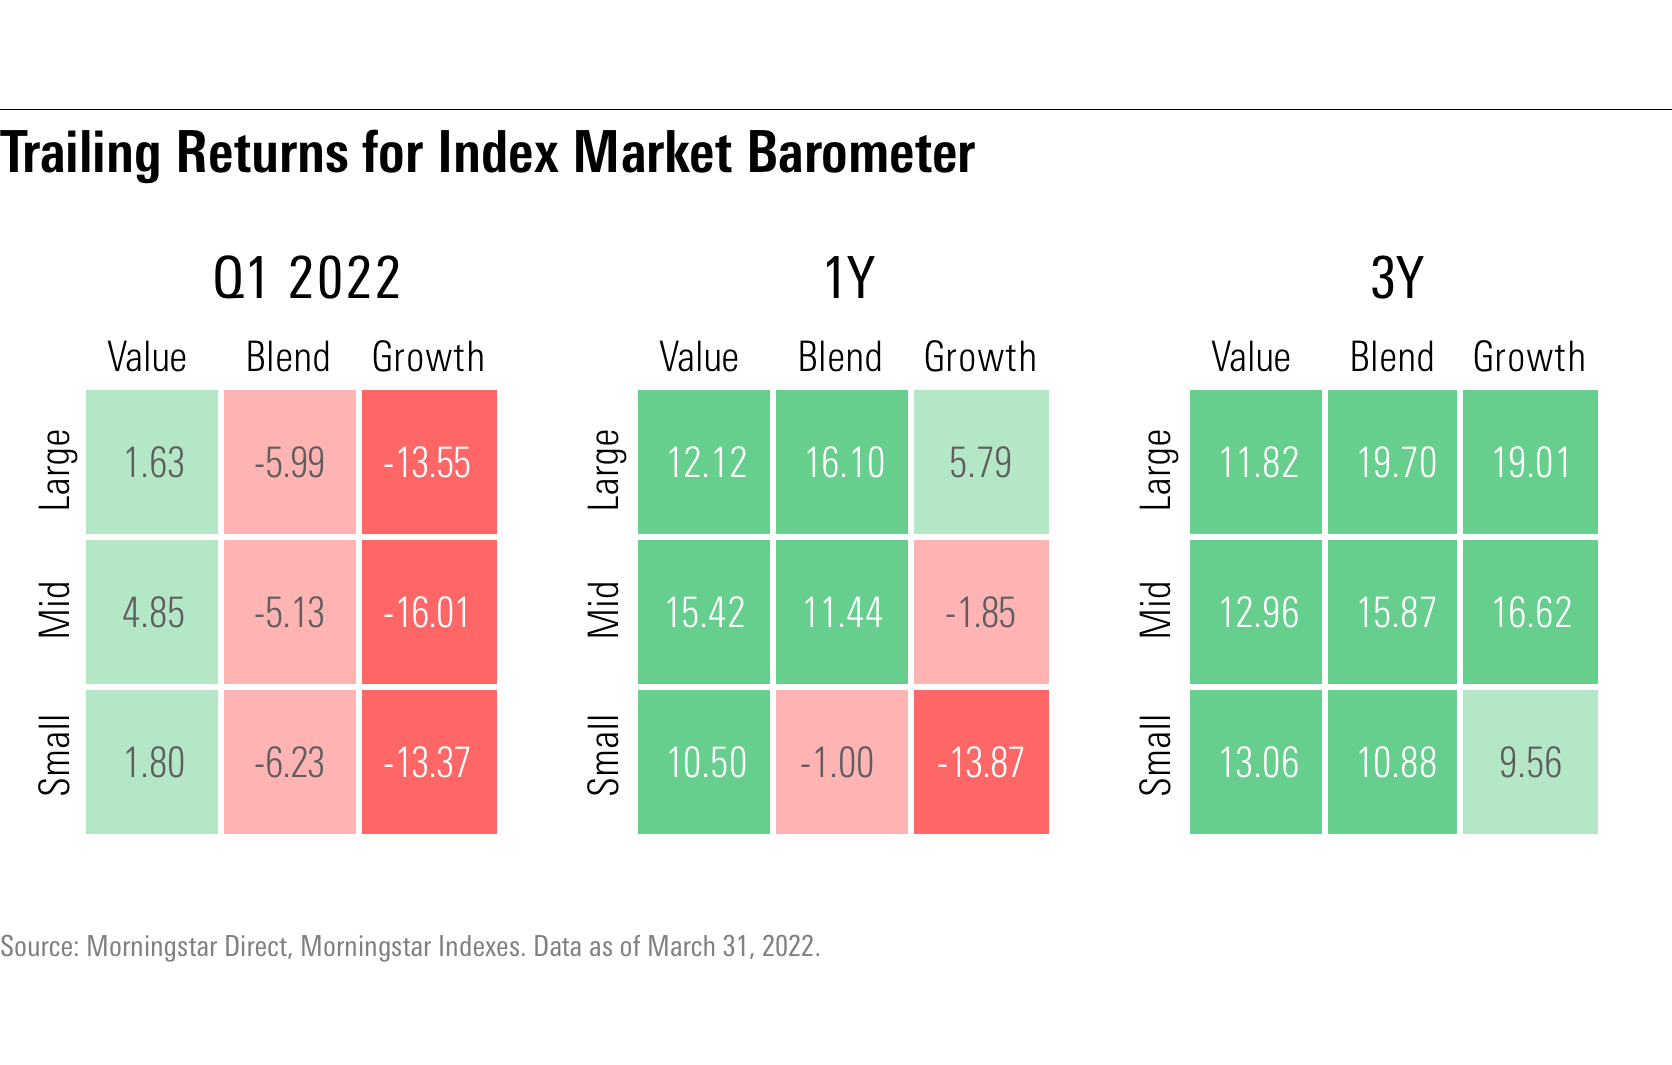
The first-quarter value-growth dynamic continues a trend seen in late 2021. At that time, value stocks began to outpace their growth counterparts in the mid- and small-cap segments after years of lagging in performance. That trend then spread for large-cap stocks in the first quarter of 2022.
First Quarter’s Best and Worst Sectors
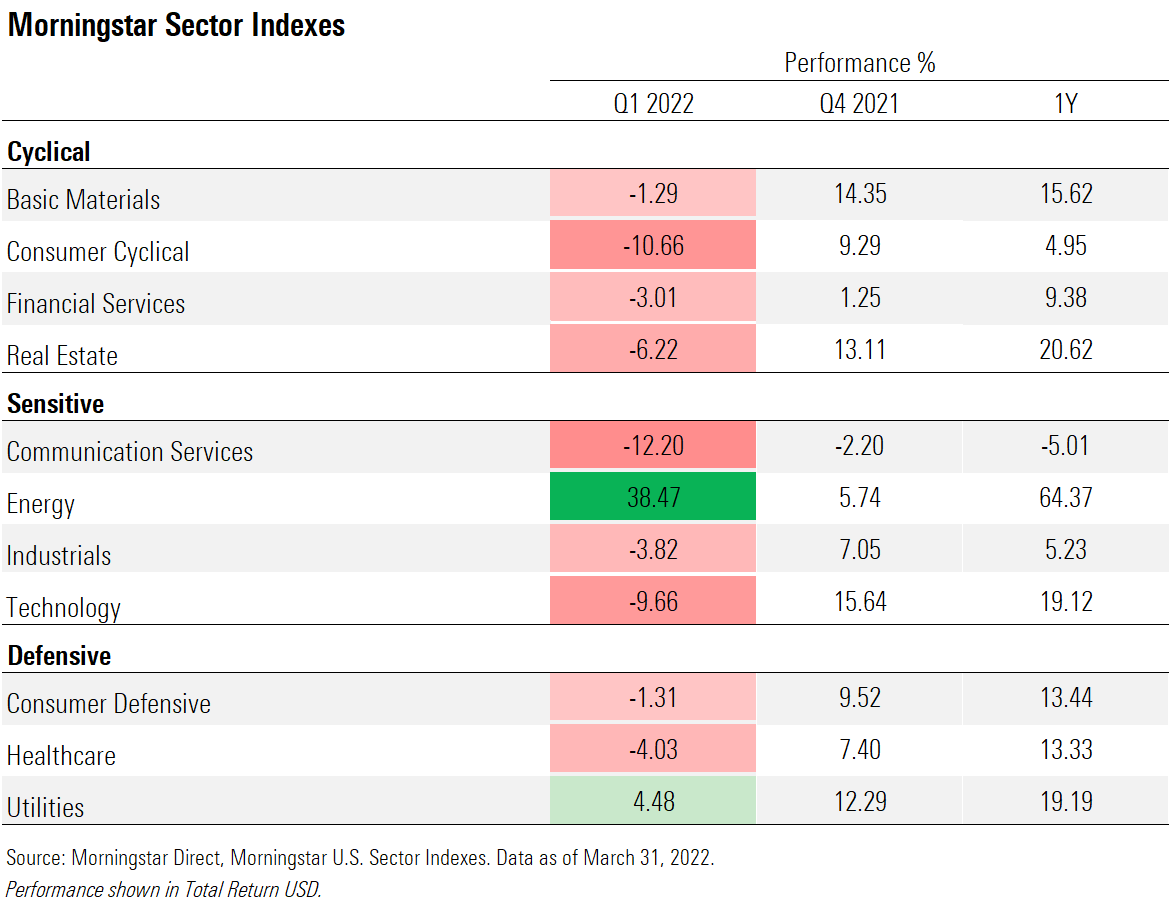
A key factor in the poor performance of growth stocks was losses among communication services stocks. That includes Netflix NFLX down 37.8%, and Disney DIS, which lost 11.5%. While technology stocks finished the quarter among the worst performers, many names recovered from the worst of losses. Microsoft MSFT, for example, finished the quarter down 8.1%, after falling by nearly 18% in early March.
Energy stocks rallied on surging oil prices. Exxon Mobil XOM jumped 36.4%, ConocoPhillips COP 39.6%, and Chevron CVX up 40% in the quarter.
Which Stock Markets Performed Best and Worst Around the Globe?
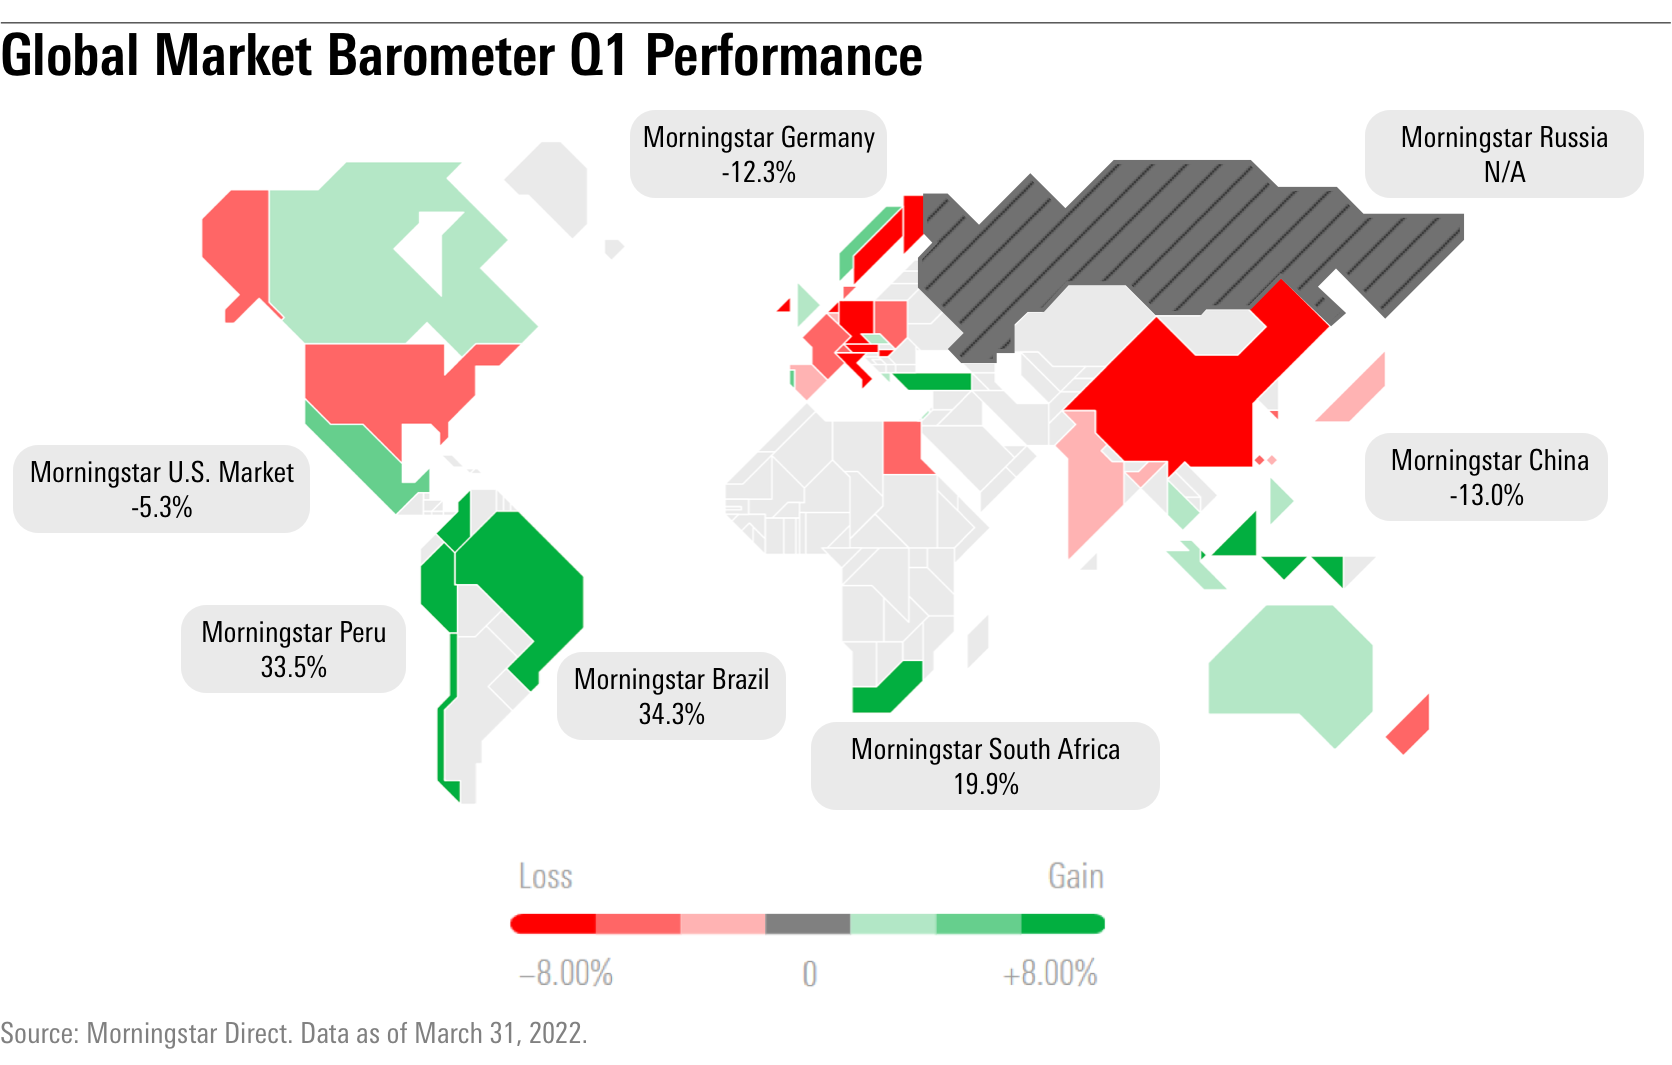
On a global basis it was a mixed picture. Among developed markets, the U.S. landed in the middle of the performance rankings. Germany lost 12% partly due to its exposure to the war in Ukraine, and Japanese shares fell 6.6%. Commodity-exporting countries benefited from the conflict on supply concerns, with Canadian stocks up 4.9% and Australia gaining 6%.
Chinese stock benchmarks fell sharply, with the Morningstar China Index losing 13% in the first quarter. A growing dispute between regulators about accounting and disclosure standards--which may lead to the delisting of some Chinese companies from U.S. exchanges--triggered the decline. Investors were also spooked by a new round of COVID-driven lockdowns that may disrupt the Chinese economy.
Russia’s stock market in late February closed for nearly a month amid sanctions imposed on the country and restrictions remain on trading the country’s stocks. Index providers removed Russian stocks from their indexes and U.S. asset managers have written off their Russian equity holdings as worthless.
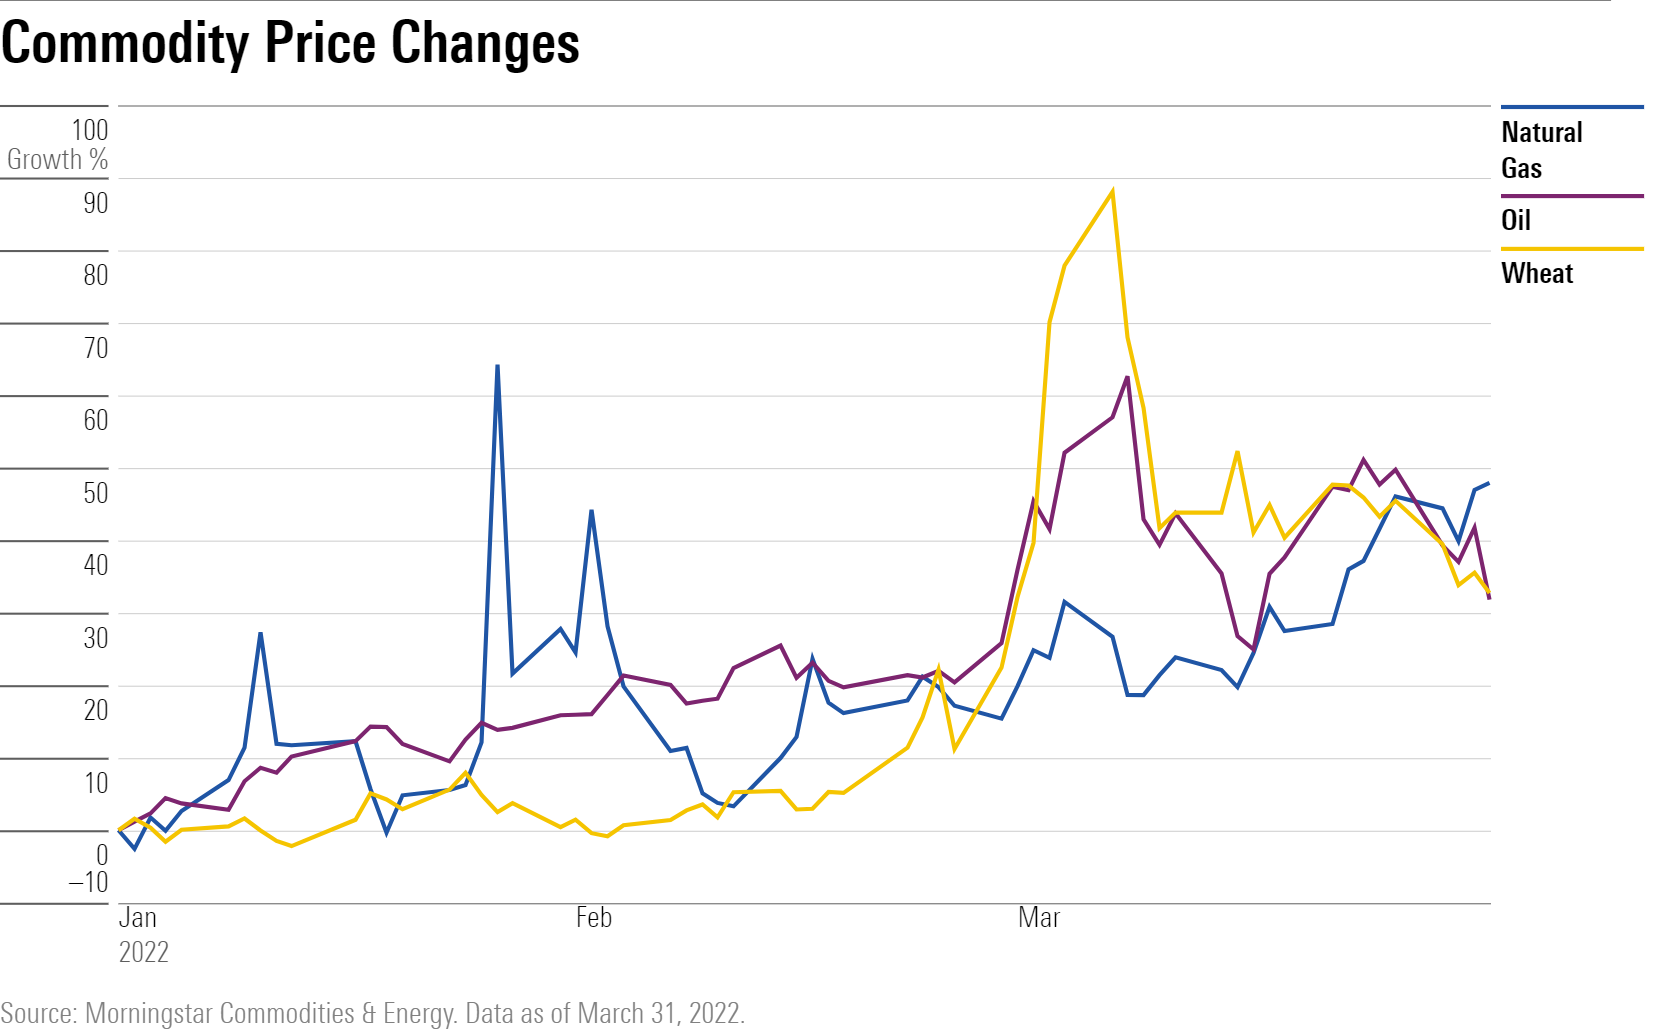
Commodity Prices Posted Big Moves
Oil was in the spotlight throughout the quarter. Prices were already on the rise as demand from a global economy recovering from the pandemic-induced recession outstripped supply. After Russia, a major oil and gas exporter, attacked Ukraine oil hit a 14-year high of $125 per barrel. That was up from $75 at the start of year as traders anticipated that sanctions on Russia would cut supply.
But as it became clear that--at least for now--oil supplies would not be seriously disrupted, oil prices gave back partial gains, a move cemented on the last day of the quarter by President Joe Biden’s announcement that the U.S. would be releasing its oil reserves to help lower gas prices.
Oil ended the quarter down nearly 20% from its high at $100.28. That was still a 33% jump and the third-largest quarterly gain in a decade.
Natural gas futures rose 51% to $5.64 per million British thermal units after the European Union said it would cut back on Russian gas imports. About 40% of Europe’s supply comes from Russia.
Wheat futures jumped after Russia’s invasion of Ukraine. Both countries are among the top five exporters of the commodity in the world. Prices reached an all-time high of $14.25 a bushel on March 7 after rising 85%, but moderated during the last few weeks of the quarter and ended up 31% to $10.06 per bushel.
The author or authors do not own shares in any securities mentioned in this article. Find out about Morningstar’s editorial policies.

/s3.amazonaws.com/arc-authors/morningstar/ba63f047-a5cf-49a2-aa38-61ba5ba0cc9e.jpg)
/cloudfront-us-east-1.images.arcpublishing.com/morningstar/F2S5UYTO5JG4FOO3S7LPAAIGO4.jpg)
/cloudfront-us-east-1.images.arcpublishing.com/morningstar/7TFN7NDQ5ZHI3PCISRCSC75K5U.png)
/cloudfront-us-east-1.images.arcpublishing.com/morningstar/QFQHXAHS7NCLFPIIBXZZZWXMXA.jpg)
:quality(80)/s3.amazonaws.com/arc-authors/morningstar/ba63f047-a5cf-49a2-aa38-61ba5ba0cc9e.jpg)