
What Is a Yield Curve and Why Are Investors Worried?
Here’s why this important bond market indicator is flashing a warning sign.
/s3.amazonaws.com/arc-authors/morningstar/ed88495a-f0ba-4a6a-9a05-52796711ffb1.jpg)

Lately, all eyes are on the yield curve.
We’re not talking about a new type of baseball pitch or a funky traffic sign on a winding mountain pass. We’re talking about the direction of the bond market, the economy, and the potential value of your portfolio.
The yield curve is a fixture of the financial markets used to gauge stages in economic cycles, and in particular, whether the danger of a recession is rising.
What Is the Yield Curve?
The bond market is loaded with jargon and complicated concepts, but this one is a bit more easy to understand.
At its most basic level, the yield curve is a way to visualize the relationship between yields across the different maturities of U.S. government bonds, from 3-month bills all the way to 30-year bonds. The focus is usually on the yields of Treasury notes starting with the two-year and out to the 10-year note.
When the economy is strong and interest rates are stable, the yield curve slopes upward. That’s because shorter-duration bonds usually have lower yields and longer-term bonds have higher yields. Investors typically demand a higher return from longer-dated bonds because of the risks associated with tying up money for longer time periods, especially inflation.
But the yield curve isn’t static. The shape of the yield curve is continually changing along with the ups and downs in the bond market.
What Is an Inverted Yield Curve?
There are basically three ways bond market players describe the yield curve: steepening, flattening or inverted. Steepening is when the gap between short- and long-term yields is rising, and a flattening is when that gap is shrinking, and an inversion is when short-dated bonds yield more than longer term ones.
Now, with inflation running hot and interest rates rising, the spreads on shorter-dated Treasuries are rising faster than longer-dated ones, leading to a narrowing of spreads among the different maturities--aka a flattening.
Investors get antsy when the yield curve flattens because it heightens the risk of an inverted yield curve, in which the yields on shorter-dated Treasuries exceed those of longer-term. And it’s the inverted yield curve that generates the headlines. The reason: its history as a predictor of recessions.
Does an Inverted Yield Curve Predict Recession?
When it comes to the curve, the attention is usually on the difference between the 2-year note yield and the 10-year note yield, sometimes called the “twos-tens spread” or a variation of that lingo.
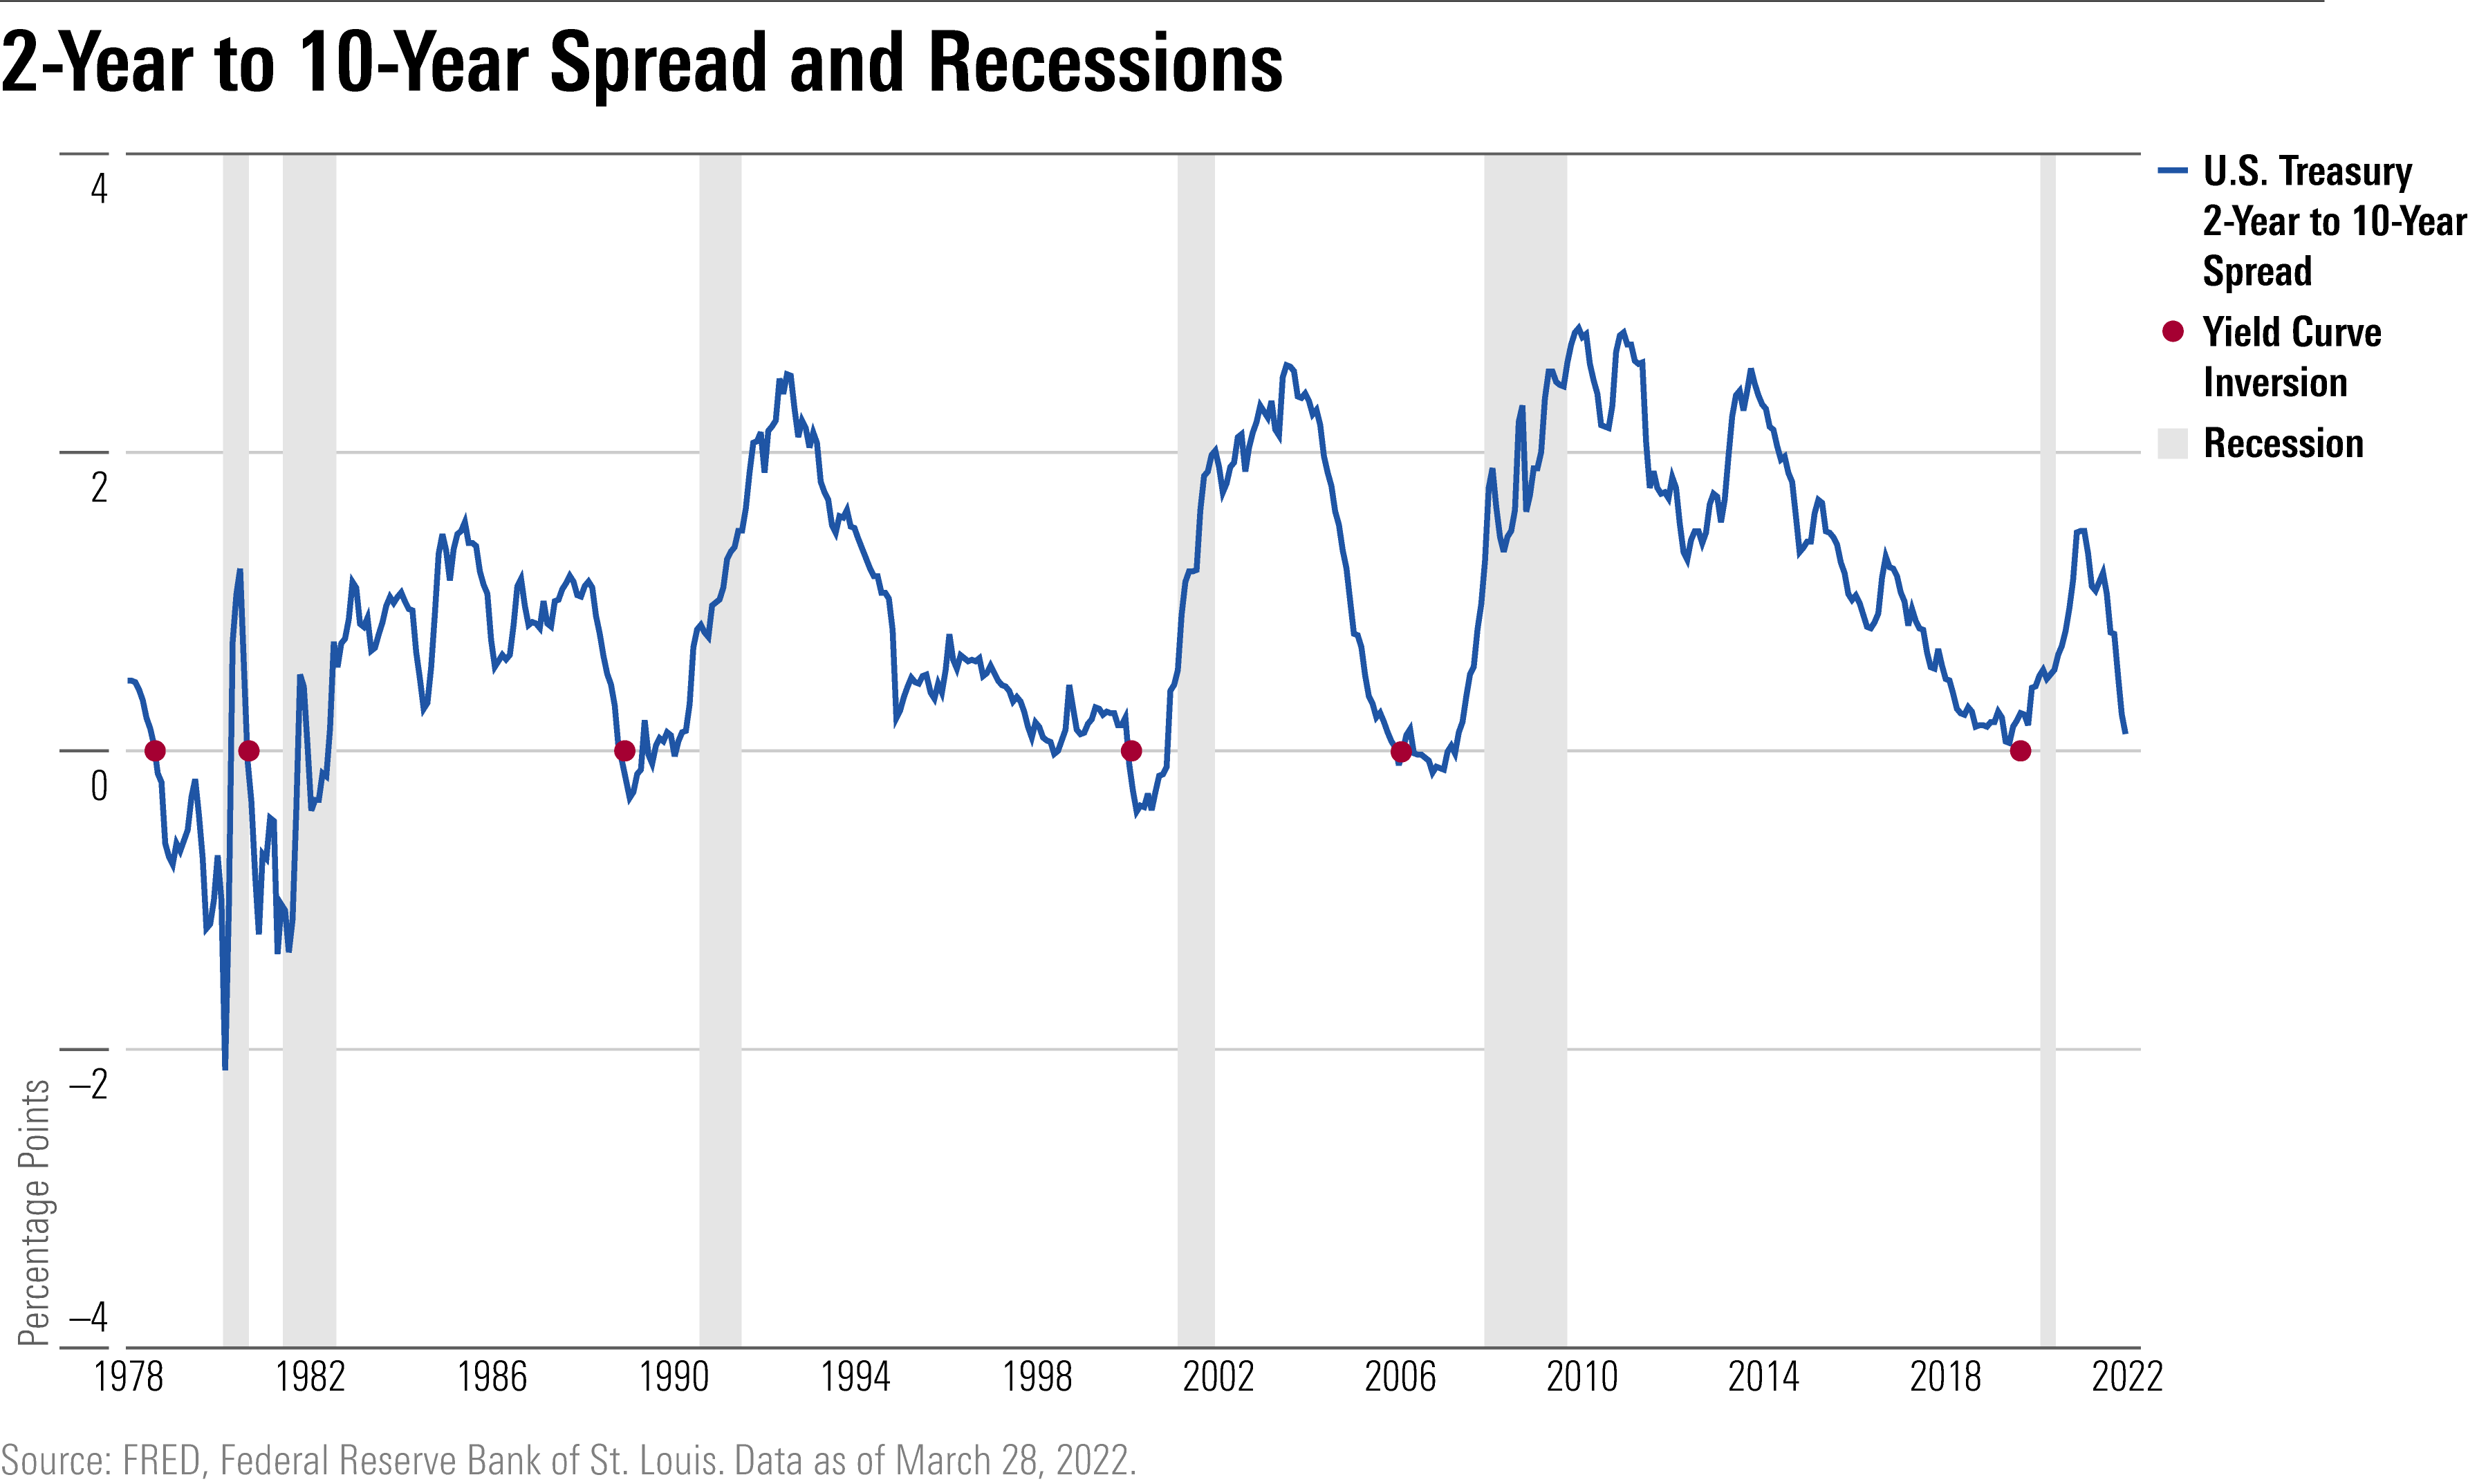
Historically, an inversion on that two-year to 10-year yield relationship has been a reliable harbinger of a looming recession. Two consecutive quarters of negative economic growth--a measure of the gross domestic product--officially designates a recession. In intraday trading Tuesday, the spread between the two-year and the 10-year briefly inverted.
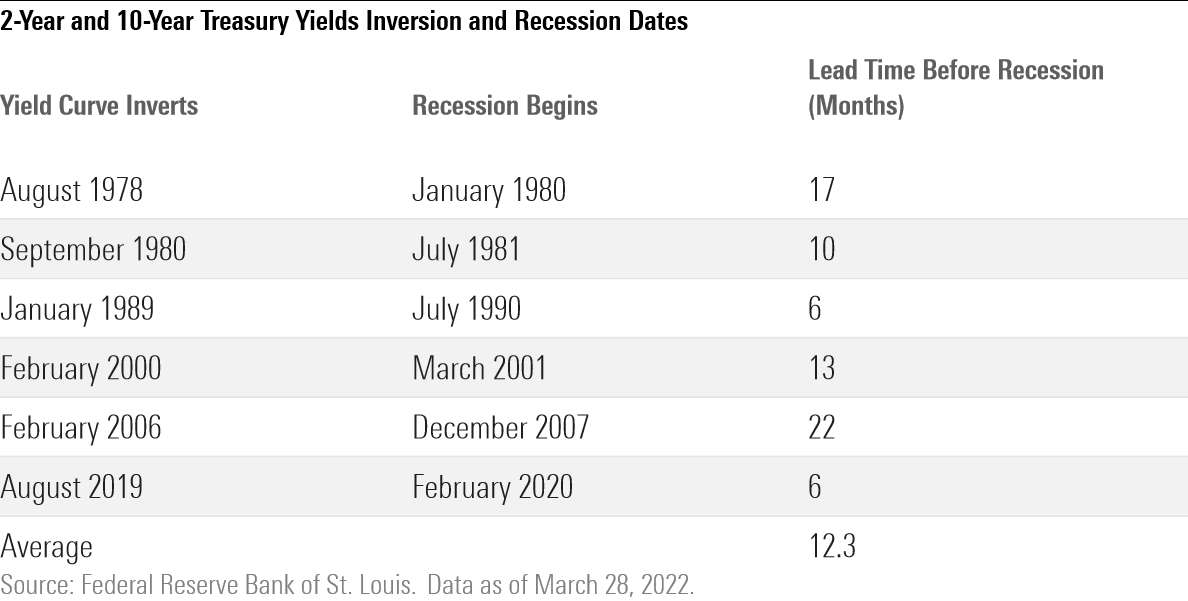
Since 1978, there have been six recessions recorded by the National Bureau of Economic Research, in which the yield curve inverted on average about 12 months prior to the recession’s start, says Ryan Grabinski, investment strategist at Manhattan-based Strategas Research Partners.
Some recessions take longer to evolve and others develop more quickly, as was the case between the August 2019 inversion and the beginning of the last recession in February 2020. In 1998, the yield curve inverted, but a recession was averted as the Federal Reserve moved quickly to cut rates.
However, not all yield curve-inversions lead to recessions, says Dominic Pappalardo, senior client portfolio manager at Morningstar Investment Management. (Economists sometimes joke that the yield curve has predicted 10 of the last five recessions.)
Yet all recessions are preceded by a yield-curve inversion, and that explains the state of nervousness among investors whenever significant flattening occurs.
The path that the yield curve takes to a flattening also matters. A “bear” flattener occurs when short-term rates rise faster than long-term rates, with the two-year Treasury particularly sensitive to changes in the federal-funds rate. That’s been the case in this year as the Fed moved away from the easy-money policies it adopted in response to the pandemic and turned to reining in accelerating inflation. That’s typically negative for the economy and the stock market.
A “bull” flattener happens when long-term rates fall faster than short-term rates because of lower inflation expectations, which results in the Fed lowering short-term rates. That’s generally positive for the economy and the stock market.
What Is the Yield Curve Doing Now?
The yield curve has been flashing warning signals in the past few weeks.
Bond yields have been rising sharply across the market this year as inflation has proved much stickier than expected, fueled in part by the jump in oil and other commodity prices caused by the war in Ukraine.
But yields on shorter-term Treasuries have risen further than longer-dated bonds, with short-term government-issued Treasuries on track to deliver their worst quarterly performance on record after the Federal Reserve raised the federal-funds rate for the first time since 2018. In addition, investors are expecting more aggressive rate increases ahead. That means the yield curve is shifting to reflect the changing economic outlook.
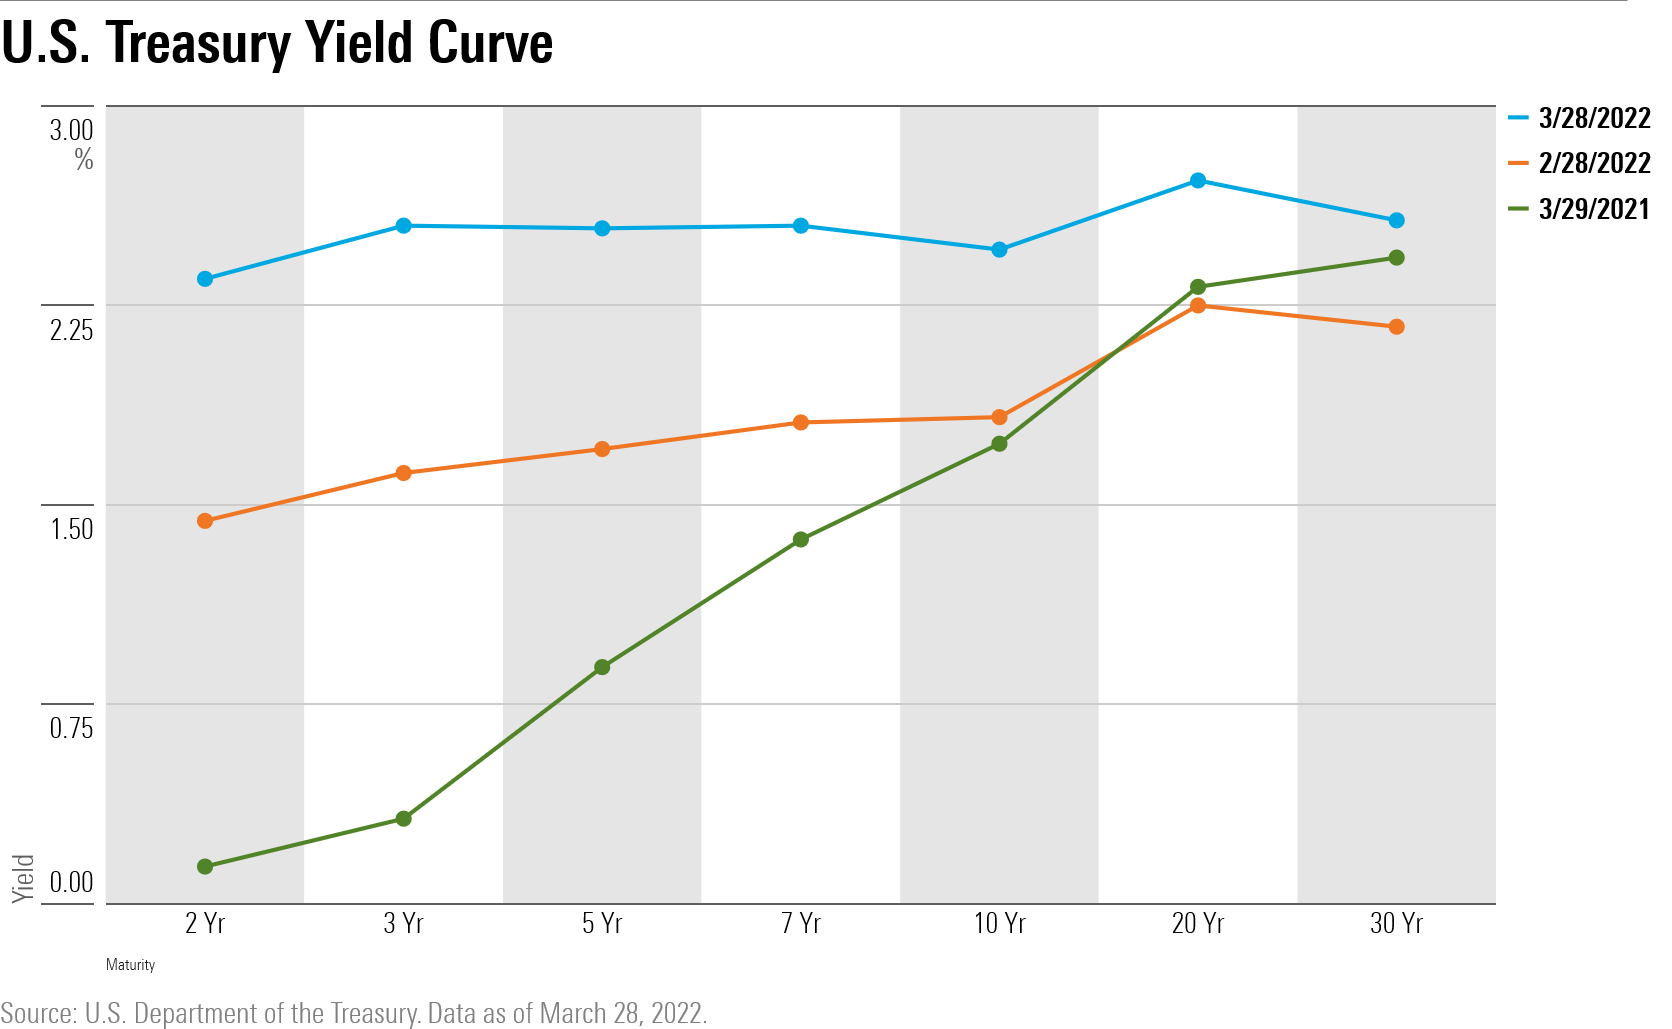
Not only are yields narrowing on the U.S. Treasury two-year note, the three-year, the five-year, the 10-year, and the 30-year Treasury, but some inversions are occurring. The three-year is yielding more than the five-year, 10-year, and 30-year. On March 28, the five-year and the 30-year inverted for the first time since 2006.
“The curve is flattening, a sign that investors are expecting an economic slowdown,’’ Morningstar’s Pappalardo says. “Three weeks ago, the question was when will the Fed hike. Now, the question is when will the Fed stop. Next, it will be when will it have to cut."
/cloudfront-us-east-1.images.arcpublishing.com/morningstar/MFL6LHZXFVFYFOAVQBMECBG6RM.png)
/cloudfront-us-east-1.images.arcpublishing.com/morningstar/HCVXKY35QNVZ4AHAWI2N4JWONA.png)
/cloudfront-us-east-1.images.arcpublishing.com/morningstar/EGA35LGTJFBVTDK3OCMQCHW7XQ.png)
:quality(80)/s3.amazonaws.com/arc-authors/morningstar/ed88495a-f0ba-4a6a-9a05-52796711ffb1.jpg)