
Putting Recent Market Volatility in Perspective
Stocks have been more jittery than usual, but volatility is to be expected.
/s3.amazonaws.com/arc-authors/morningstar/360a595b-3706-41f3-862d-b9d4d069160e.jpg)

A version of this article was originally published on Feb. 7, 2022.
It's been a bumpy ride for investors so far in 2022.
The Morningstar US Market Index was down nearly 19% for the year to date through May 20, 2022, and previously high-flying areas such as growth stocks, technology companies, and momentum names have been hit particularly hard. More than half of the underlying stocks in the Morningstar US Market Index—including widely held names such as Tesla TSLA, Amazon.com AMZN, Meta Platforms FB (formerly Facebook), and Netflix NFLX—are now down 30% or more from their 52-week highs. While broader market benchmarks have been slightly more resilient, growth stocks have officially dipped into correction territory: The Morningstar US Small Growth, US Mid Growth, and US Large Growth indexes were all down at least 30% for the year to date through May 20.
Although the year is off to a more volatile than usual start, the recent market jitters aren't completely unheard of. In this article, I'll look at current market volatility relative to previous norms and suggest some ways for investors to cope.
How Bad Is the Current Market?
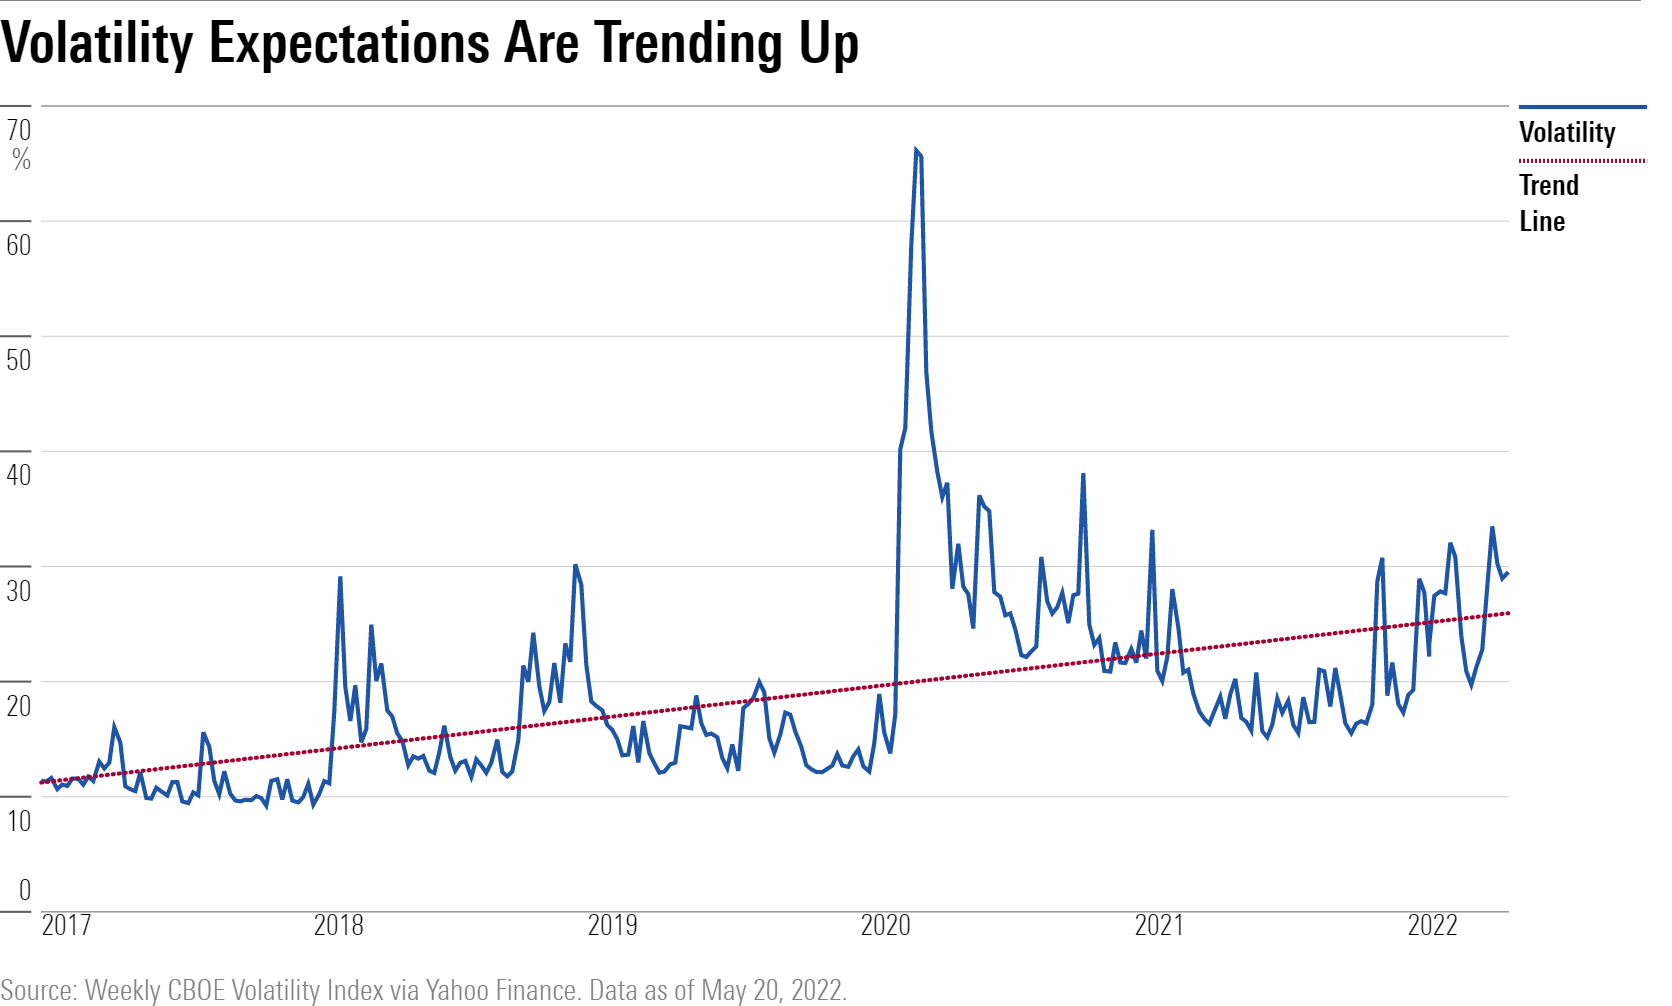
As the chart below shows, volatility has been on an upward trend. The CBOE VIX Index, which measures market expectations for equity-market volatility based on index options for the S&P 500, has trended up after a relatively quiet year in 2021. Markets have been shaken by a few different things: ongoing worries about new coronavirus variants, political instability in Eastern Europe, the sudden resurgence of inflation, and fears that rising interest rates could increase the odds of a recession. As a result, the VIX has recently spiked into the low 30s, compared with a long-term average of about 19.3.
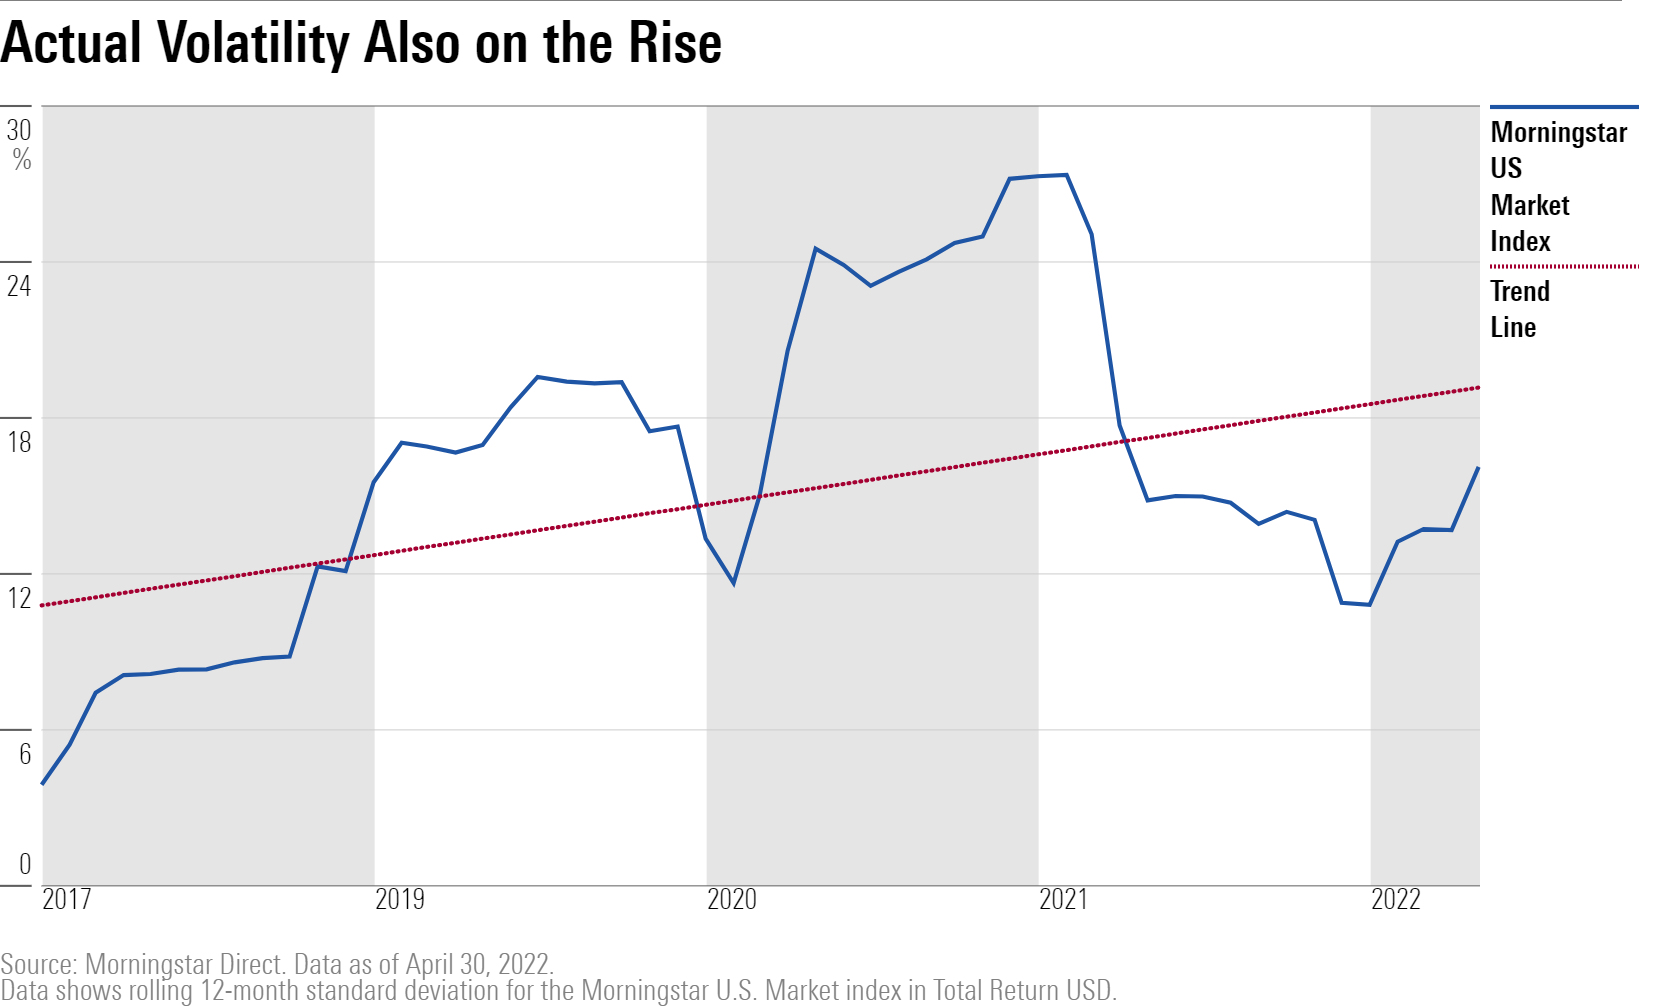
Actual volatility has also increased. After an unusually quiet year during most of 2021, the standard deviation for the Morningstar US Market Index has also started trending higher. The standard deviation stood at 16.10% for the trailing 12-month period through April 30, 2022, compared with 10.77% for calendar 2021.
This volatility has also translated into more frequent losses. Since the market started getting more jittery in November 2021, about half of all trading days have closed with market losses. The number of trading days with losses of 2% or more has also significantly increased.
It's All Relative
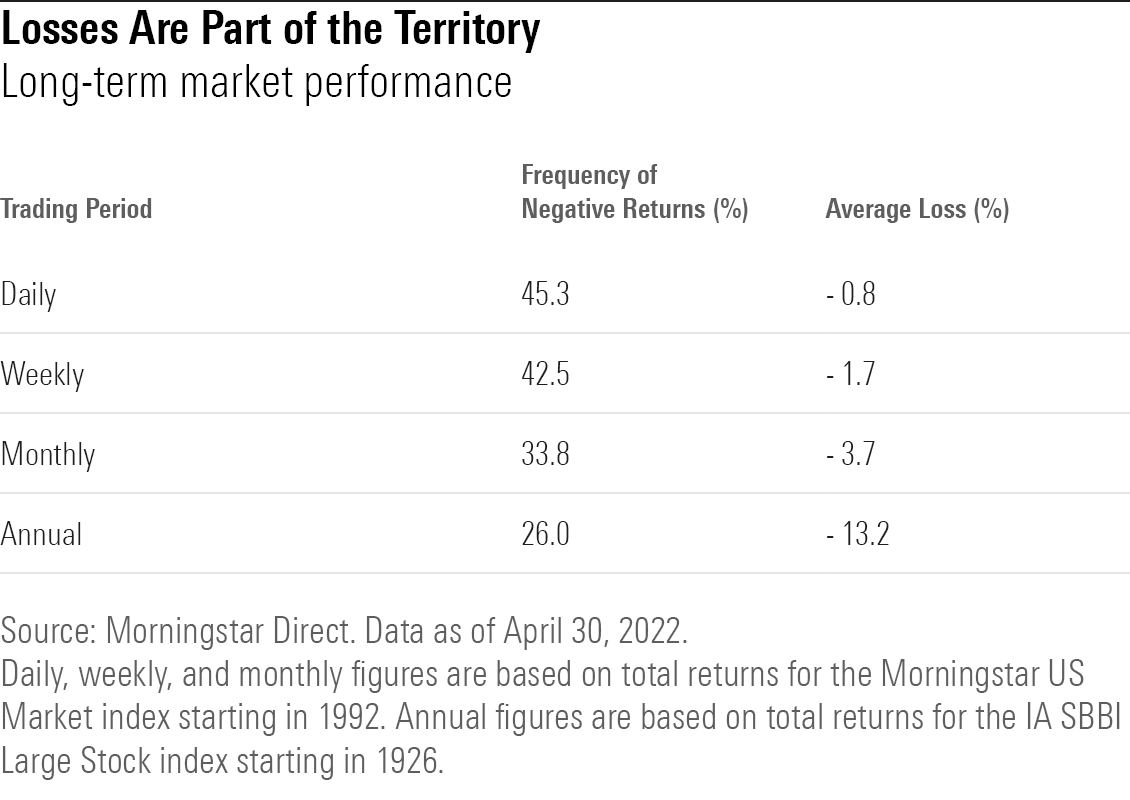
When looked at in the context of longer-term historical averages, though, recent market performance hasn't been that far outside the norm. As the table below illustrates, market losses are actually pretty common. About 45% of trading days finish with negative returns. Losses are less frequent with longer periods but still relatively common. About 42% of weekly trading periods have historically ended with negative returns, and about a third of all monthly trading periods have finished up in the red. Over longer periods, annual returns have been negative about one fourth of the time.
Recent market volatility hasn't been too far outside the usual range. Since November 2021, there have been 73 trading days (out of 203) with negative returns, but only 11 of those days have closed with losses greater than 2%. Volatility probably seems higher partly because we've experienced some more-dramatic intraday swings; in addition, growth stocks have suffered much more frequent and severe losses.
Some investors might also be alarmed by recent market turmoil simply because we haven't seen much of it in the recent past. The novel coronavirus-driven bear market in early 2020 was unusually swift and severe but also surprisingly short-lived. After dropping about 34% from Feb. 19 through March 23, stocks then surged ahead to make a full recovery by August.
After the 2020 rebound, 2021 proved to be another temperate year for equity investors. Market volatility was well below average, with a standard deviation about 20% below the long-term historical average for the year. With a few exceptions (such as the tech, media, and telecom correction that started in 2000, the global financial crisis in 2008, and pandemic-driven uncertainty in early 2020), market volatility was also generally below average over the previous three decades.
Based on past history, periodic market downturns are entirely normal and to be expected. Over longer time periods, the market tends to be self-correcting; certain areas may get frothy and reach bubble status, and overall market valuations may overshoot the mark, but periodic downturns are a way of correcting for the excess. Heading into 2022, the overall market was trading at a 5% premium to the aggregate fair value estimated by Morningstar's equity analysts. After the recent drop, valuations are now looking more reasonable.
Why the Road Ahead Might Remain Bumpy
While valuation risk looks like less of an issue, there's no guarantee that market turmoil will settle down in the short term. It’s a cliche to say that we’re living in unprecedented times, but we really are in a period of flux and regime change. The previous 30 years (1991–2020) were generally marked by declining interest rates and benign inflation, creating a favorable environment for both stocks and bonds. But both measures are now reversing course. After running well below average for several years, inflation has recently been running at an 8.3% annualized rate, its highest level in the past 40 years. The Federal Reserve has signaled that it expects to continue raising interest rates to keep inflation under control, and yields on the 10-year Treasury have trended significantly higher in response.
A fundamental regime change for both interest rates and inflation would have far-reaching implications for many asset classes, and it could take a while for the market to adapt to conditions that are far different from what most investors have grown up with. Indeed, many previously long-running trends have already made dramatic reversals over the past several months. Market leadership has flipped from growth to value; from tech stocks to energy, commodities, and other sectors; and from momentum names to tamer factors such as value, yield, and low volatility. And as both stocks and bonds have slid, the previously stalwart 60/40 portfolio has recently captured more of the downside than we've been accustomed to in recent decades.
What It Means for Your Portfolio
It's also important to keep in mind that, while market turmoil can be unpleasant, it ultimately doesn't matter too much for most long-term investors. (Sequence of returns risk is the exception, because an adverse sequence of returns puts retirees at risk of depleting their portfolios early in retirement and later missing out on an eventual rebound.) Far greater is the risk of permanent capital loss, or the risk of not meeting your long-term financial goals.
As we've covered in previous articles, investors unsettled by market turbulence might want to take as step back to see whether their original investment plans still make sense. If you’re approaching retirement, for example, you might need to derisk your portfolio to mitigate the risk of starting to make withdrawals during an adverse sequence of returns. If you'll need to tap into your portfolio within the next few years (to pay for bigger expenses such as a down payment or upcoming college tuition) or if you're tempted to sell if things get worse, those can also be legitimate reasons to reconsider your portfolio's asset mix.
But if your portfolio's asset mix is still a good fit for your time horizon and ability to take on risk, it's best to tune out the noise and avoid making any major changes: Keep calm and carry on.
/cloudfront-us-east-1.images.arcpublishing.com/morningstar/MFL6LHZXFVFYFOAVQBMECBG6RM.png)
/cloudfront-us-east-1.images.arcpublishing.com/morningstar/HCVXKY35QNVZ4AHAWI2N4JWONA.png)
/cloudfront-us-east-1.images.arcpublishing.com/morningstar/EGA35LGTJFBVTDK3OCMQCHW7XQ.png)
:quality(80)/s3.amazonaws.com/arc-authors/morningstar/360a595b-3706-41f3-862d-b9d4d069160e.jpg)