
The Best and Worst S&P 500 Funds
How much do they differ?
/s3.amazonaws.com/arc-authors/morningstar/1aafbfcc-e9cb-40cc-afaa-43cada43a932.jpg)

A Heated Contest
In recent years, index-fund providers have engaged in price wars, with Fidelity and Schwab noisily reducing their funds' expense ratios. Somewhat more quietly, their major rivals have followed suit. Index funds marketed by Vanguard, BlackRock BLK, and State Street STT have all become progressively cheaper.
Presumably, fund companies slashed their costs not solely from the goodness of their hearts, but also to generate business. Which implies that investors don’t always buy the nearest available index fund. Sometimes they comparison-shop to find the best value. This article conducts that exercise for S&P 500 funds. In addition, it addresses a related question: Is the effort worth it? Are S&P 500 funds substantially different, or is one essentially as good as the next?
Assessing Returns
We’ll start by comparing the funds’ total returns. During the 10-year period from 2011 through 2020, there were 64 share classes of S&P 500 funds: 60 mutual funds and four exchange-traded funds. Exhibit 1 shows the median annualized return for those 64 funds, along with the performance for the 10th and 90th percentiles.
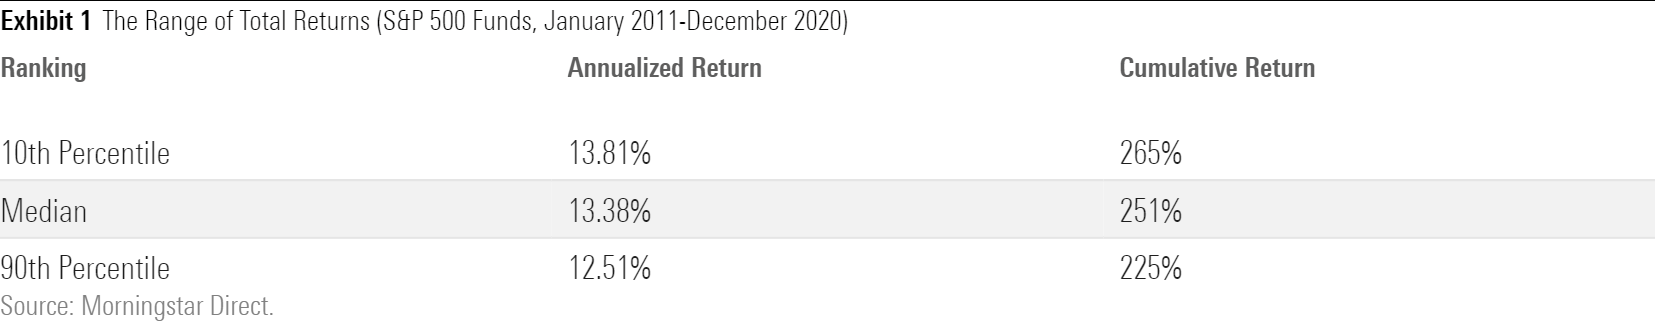
Now that’s real money. The 10th-percentile fund beat the 90th-percentile fund by 1.3 percentage points per year. Over the decade, it outdid its rival by 40 percentage points: $4,000 on an initial $10,000 investment. As Jack Bogle never tired of reminding us, time would greatly multiply that victory margin. Should an investor be so fortunate as to enjoy a second decade of such gains, the 10th-percentile fund would best the 90th-percentile fund by a whopping $27,300.
The gap is bigger than I expected. There are only two ways for index funds to diverge. One way comes from differing expense ratios, and the other from tracking error, which occurs when funds fail to match their index’s performance. It seems unlikely that one index fund would cost 1.3 percentage points more than another. However, it seems even less likely that an S&P 500 fund’s tracking error would be anywhere near that large.
Expenses and Tracking Errors
Easy enough to determine the causes. Once more, I sorted the 64 funds, this time by their costs, which I calculated by averaging the expense ratios the funds had posted over each of the decade’s 10 years.
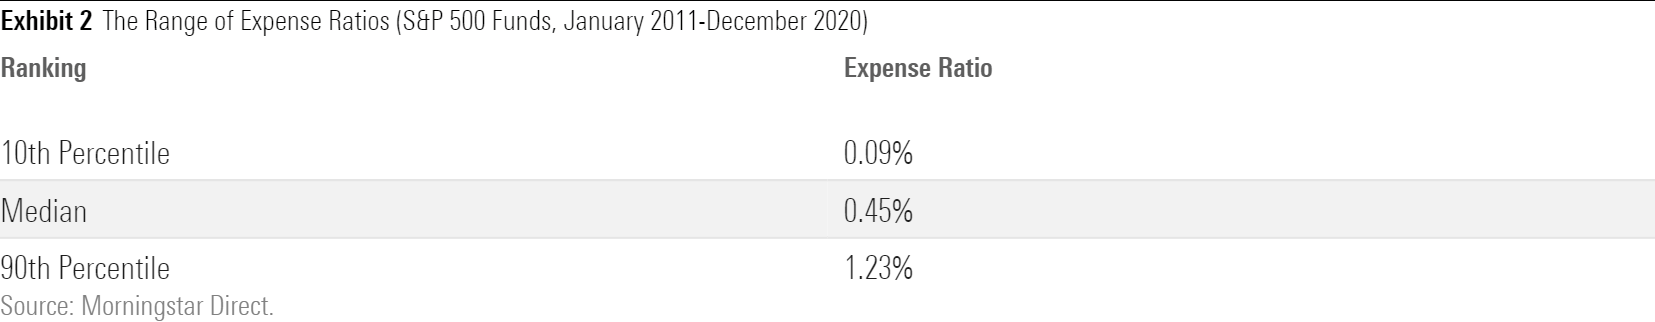
Costs mattered. To my surprise, the 10th-percentile fund was a full percentage point cheaper than the 90th-percentile fund. I knew that during indexing’s early days that several fund companies had launched high-cost offerings, but I assumed such funds had long since expired. Apparently not. Such an expense handicap is an impassable obstacle. No amount of adroit index-fund management can overcome anything approaching the size of that deficit.
Still, the expense-ratio findings did not exactly match those of the total returns. With returns, the 10th-percentile fund was 130 basis points better than the 90th-percentile fund, while when the sorting was done with expenses, the margin was smaller, at 107 basis points. In other words, tracking error was also a factor.
On to that effect. For each calendar year, I added a fund’s total returns to its expense ratio, thereby computing its before-cost performance. I then compared that result with the S&P 500’s return. The absolute value of the difference between those two numbers is the tracking error: the gap between what the fund should have achieved, absent its costs, and how it really performed. Adding each year’s tracking error and dividing by 10 yielded each fund’s average tracking error.
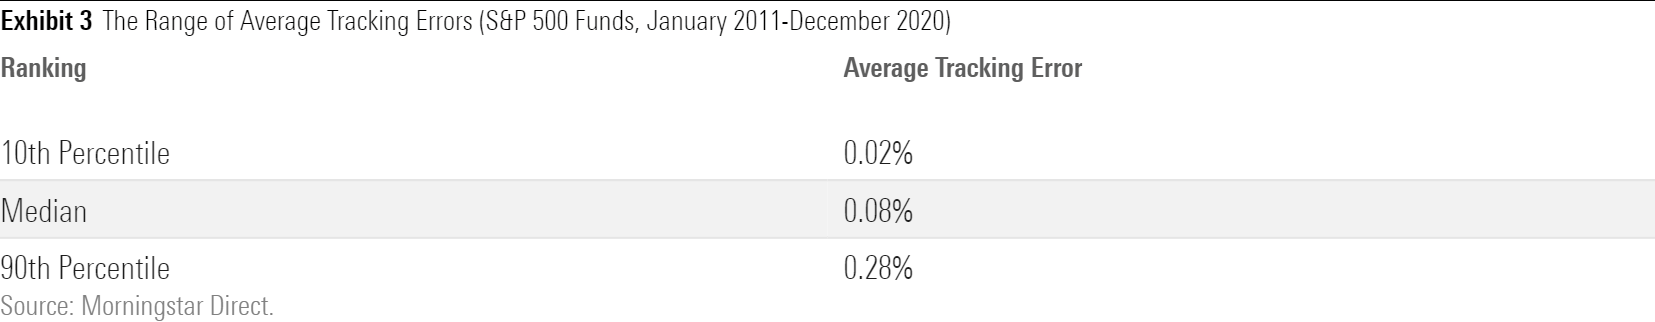
Before paying their operating costs, the leading S&P 500 funds almost exactly emulated their benchmarks. (The average tracking error for the most precise fund, iShares Core S&P 500 ETF IVV, was less than 1 basis point.) However, one S&P 500 fund in five recorded an annual tracking error above 15 basis points. While that is not a huge variance, it’s worth noting that index-fund price wars are conducted for less.
(Technical note: Some of the tracking errors cited for the higher-cost funds are exaggerated, because the funds’ fiscal years do not run from January through December. This leads to a slight mismatch when allocating costs, thereby increasing the tracking-error results.)
Leaders and Laggards
It’s time to name names. To identify the best and worst S&P 500 funds, I summed the three rankings of: 1) total return, 2) expense ratios, and 3) tracking error. By this method, the best fund was the one that posted the lowest overall score, the second-best the second-lowest score, and so forth. For this exercise, I used only one share class per fund, so the list wouldn't be dominated by a couple of funds.
Exhibit 4 contains the five highest-scoring and five lowest-scoring funds.
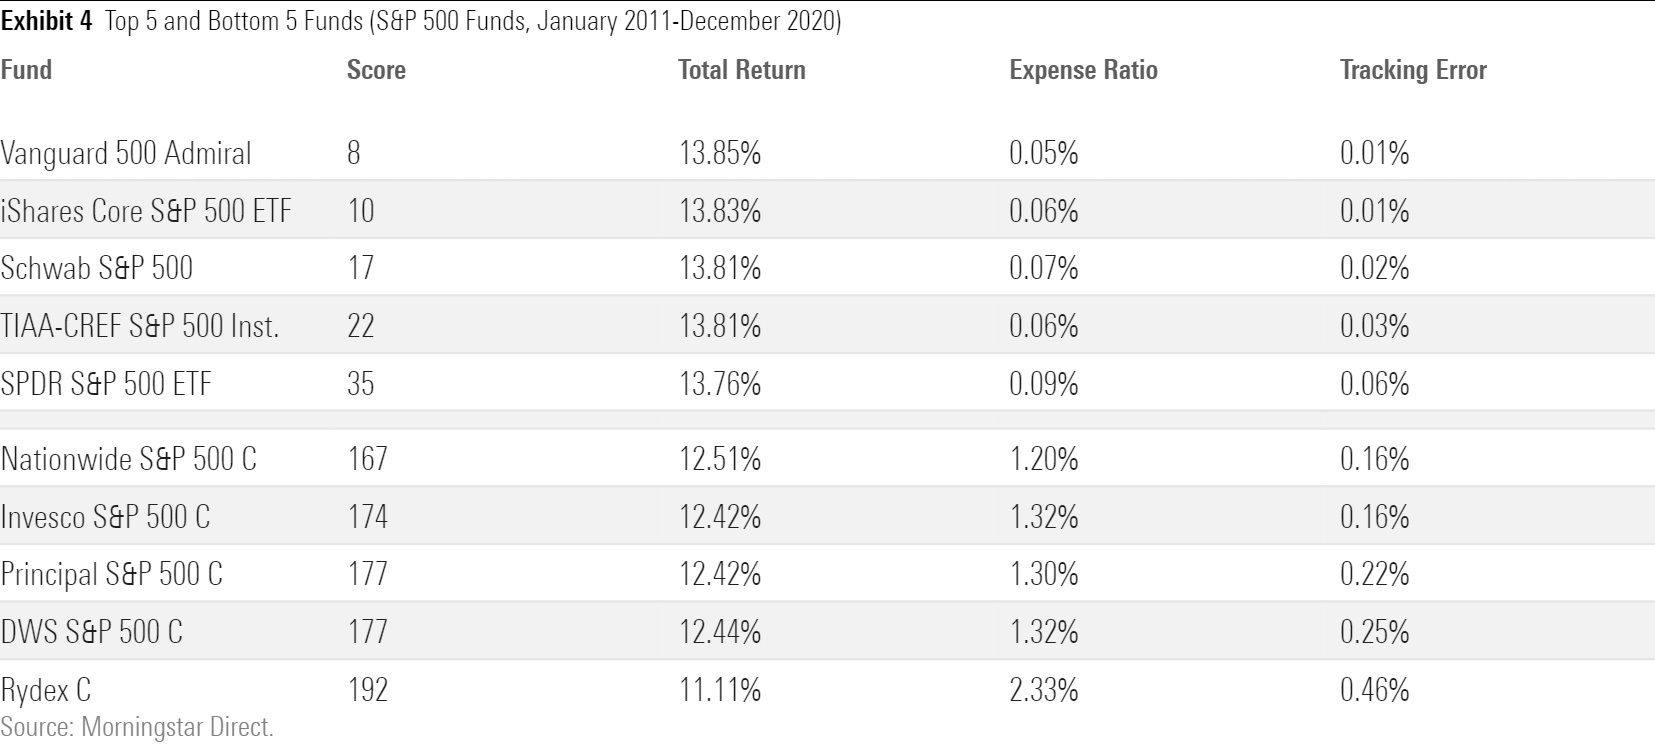
This story is easy to summarize. Aside from TIAA-CREF S&P 500 Index TISPX, which contains $8 billion, all the top funds are huge. Whereas actively run stock funds often struggle with success, size benefits S&P 500 funds. Having a giant asset base permits them to hire the necessary staff while also keeping their costs low. In addition, because their portfolios are largely static, their bulk rarely hampers their trading.
(Another technical note: Fidelity is missing from this list because the organization was a latecomer to indexing. Its first S&P 500 fund, Fidelity 500 Index FXAIX, launched a few months too late to qualify for this study. (Edit: Actually, I was wrong about Fidelity being a latecomer to indexing. The company launched an S&P 500 index fund in 1988. However, that fund was merged into a newer fund in 2018, thereby eliminating its previous track record--at least according to Morningstar's database.)
The bottom funds, in contrast, are relatively small. More to the point, they all consist of C shares. The share-class structure is why their rents are so damn high. Typically, C shares carry ongoing annual 12b-1 fees of 1%. That amount, of course, is unsustainably high for an index fund. (True, financial advisors may place a client into a cheaper fund, charge their own separate fee, and arrive at the same place as if they had recommended the C shares. But that is a topic for another column.)
The list requires some caveats. First, because the leading funds continue to cut their expense ratios, their ranking may shift. For example, although fourth-cheapest overall over the trailing decade, Schwab S&P 500 Index SWPPX now boasts the lowest expense ratio of the group, at 0.02%. Second, aside from Rydex, each fund on the laggards’ list offers a perfectly acceptable institutional share class. The main problem lies with the share-class structure, not the provider.
The lesson for investors is straightforward. There certainly are meaningful differences between S&P 500 funds. Randomly selecting among all share classes of such funds would be imprudent. An unfortunate choice could cost the investor more than 1 percentage point per year of total return. For practical purposes, however, the lowest-cost share classes from the industry leaders are one and the same. Invest in any of them with equal confidence.
John Rekenthaler (john.rekenthaler@morningstar.com) has been researching the fund industry since 1988. He is now a columnist for Morningstar.com and a member of Morningstar's investment research department. John is quick to point out that while Morningstar typically agrees with the views of the Rekenthaler Report, his views are his own.
The opinions expressed here are the author’s. Morningstar values diversity of thought and publishes a broad range of viewpoints.
/cloudfront-us-east-1.images.arcpublishing.com/morningstar/HDPMMDGUA5CUHI254MRUHYEFWU.png)
/cloudfront-us-east-1.images.arcpublishing.com/morningstar/OMVK3XQEVFDRHGPHSQPIBDENQE.jpg)
:quality(80)/s3.amazonaws.com/arc-authors/morningstar/1aafbfcc-e9cb-40cc-afaa-43cada43a932.jpg)