
These ESG Funds Have Style
A look at how ESG integration interacts with style biases.
/s3.amazonaws.com/arc-authors/morningstar/c00554e5-8c4c-4ca5-afc8-d2630eab0b0a.jpg)

Interesting things happen when funds mix styles or factors with the integration of environmental, social, and governance considerations. Here, I will examine a pair of ESG funds to illustrate the issues that investors should consider when vetting funds that overlay ESG considerations on style or factor tilts.
Calvert US Large-Cap Value Responsible Index CFJIX and Calvert US Large-Cap Growth Responsible Index CGJIX are the pioneering ESG asset manager's answer to the small but growing market of funds that mix ESG with styles or factors. In vetting the duo, I will employ the framework that we've shared previously for analyzing ESG index strategies. The same principles outlined in this framework apply to ESG index funds that use different ESG criteria on the same starting universe, or the same criteria on different universes. In both cases, there are trade-offs between market representation and ESG integration. ESG style and factor funds are no exception. That said, their style or factor focus can lead to more significant active risk.
Index Construction
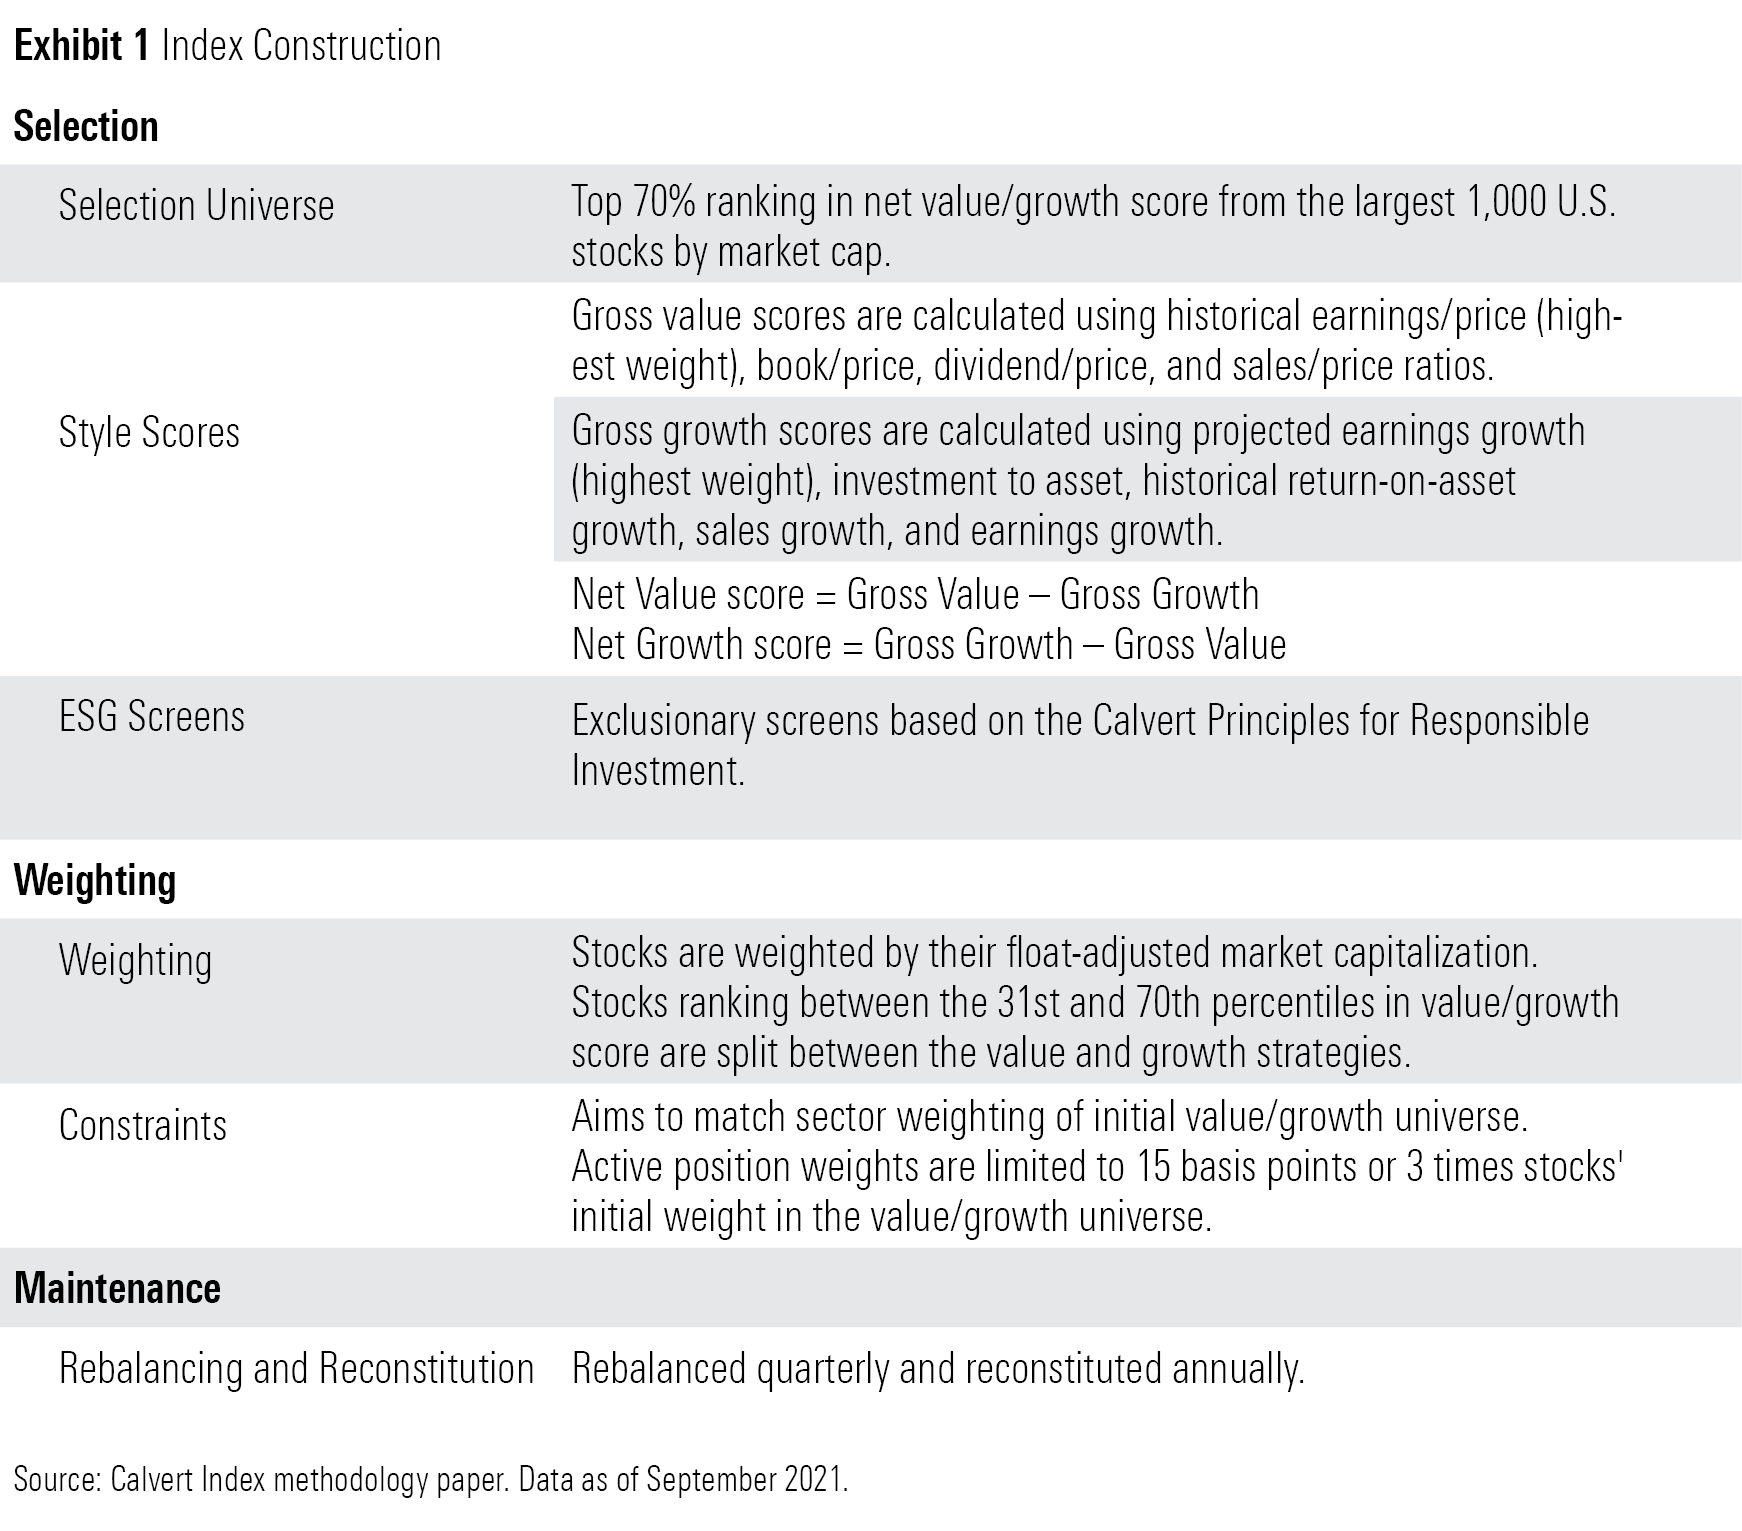
Exhibit 1 lays out the index construction process for both funds' benchmarks. Calvert starts with the 1,000 largest U.S. stocks, splits them into two ESG-agnostic groups of value and growth stocks, then applies its ESG criteria to arrive at the final lineups.
Screening for Style
Calvert constructs its own style scores to sort value and growth stocks. It calculates z-scores for each of the value and growth factors and combines them into a gross value and growth score. The trailing 12-month earnings/price ratio carries the most weight in the gross value score, while projected short-term earnings-per-share growth has the most sway in the gross growth score. A net score is then calculated as the difference between the two gross scores.
Stocks ranking in the top 70th percentile by their net value/growth score are chosen for the respective value/growth initial universes. The top 30% by net value score belong exclusively to the value universe and vice versa. The middle 40%, stocks that simultaneously exhibit both value and growth traits, are split across the value and growth indexes.
This construction process is fairly similar to the construction of the Russell style index suite, although the ingredients are slightly different. Calvert's value and growth measures are most similar to S&P's style index suite. Both use multiple price and growth ratios for their style scores, compared with just three metrics for the Russell indexes. More does not mean better, however, only that we can expect differences among them.
Screening for Green
Once the value and growth universes are created, Calvert applies exclusionary ESG screens to weed out companies that do not adhere to the Calvert Principles of Responsible Investing. A separate investment committee oversees these criteria.
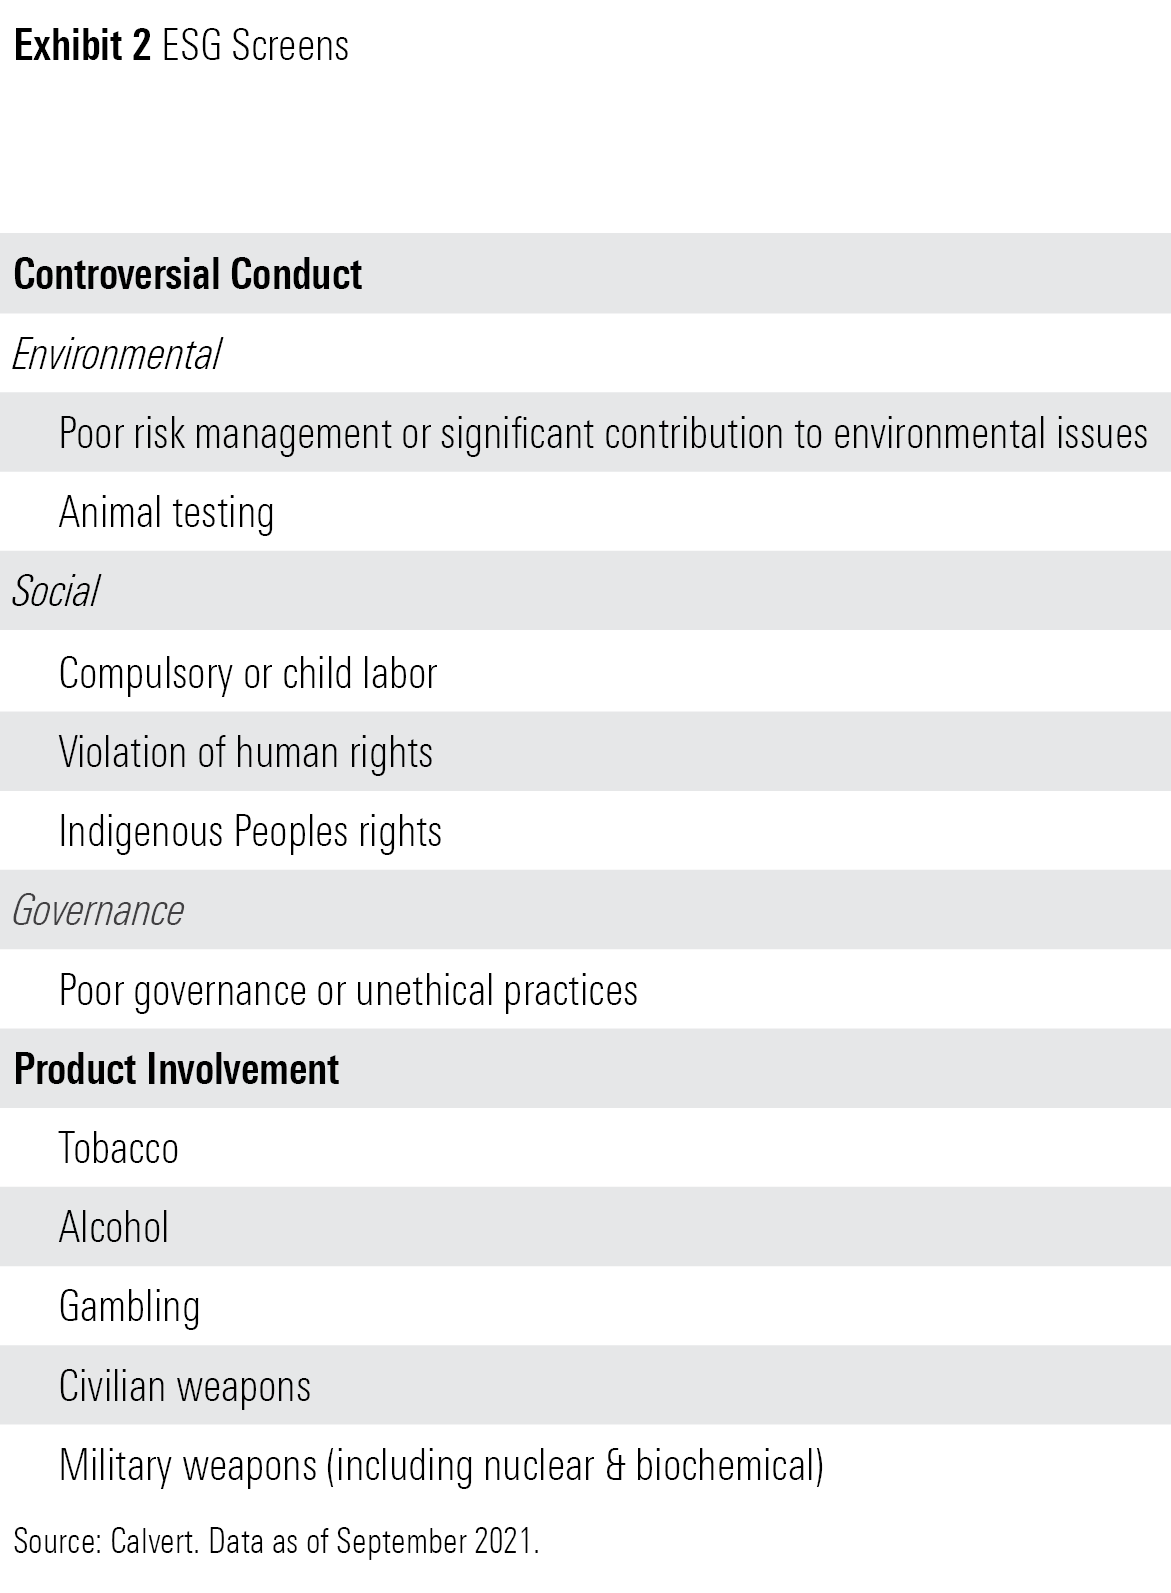
The topics above provide a general guideline for Calvert's research team to develop a sector-specific framework. They assess ESG risks most relevant to the sector and determine which companies do not make the cut, based on their risk exposures and ability to manage them. Once such names are removed, the stocks that remain are market-cap-weighted. The funds' active share tends to be low relative to their selection universes and much lower versus ESG indexes that employ best-in-class strategies and overweight stocks with better ESG profiles.
While Calvert does not explicitly mandate the exclusion of any particular sectors, both the value and growth strategies have very little energy and real estate exposure compared with the category index. Many energy stocks fail to meet Calvert's blanket environmental issue terms, while real estate stocks are underrepresented on account of the lack of sufficient ESG data for REITs. This difference is more striking for Calvert US Large-Cap Value Responsible Index, given that value funds tend to gravitate toward these sectors more than growth funds.
Weight and Maintain
The Calvert indexes weight stocks by their float-adjusted market cap, subject to sector and individual position weight constraints. The portfolios aim to closely mimic the sector composition of the initial value and growth universes. They also limit active weights on individual positions to the lower of 0.15% of the portfolio or 3 times a stock's weight in the initial universe. Stocks' float-adjusted market caps are adjusted using a scaled percentile rank to make up for the fact that each index excludes the bottom 30% of stocks based on their value/growth scores.
What Comes Out in the Wash?
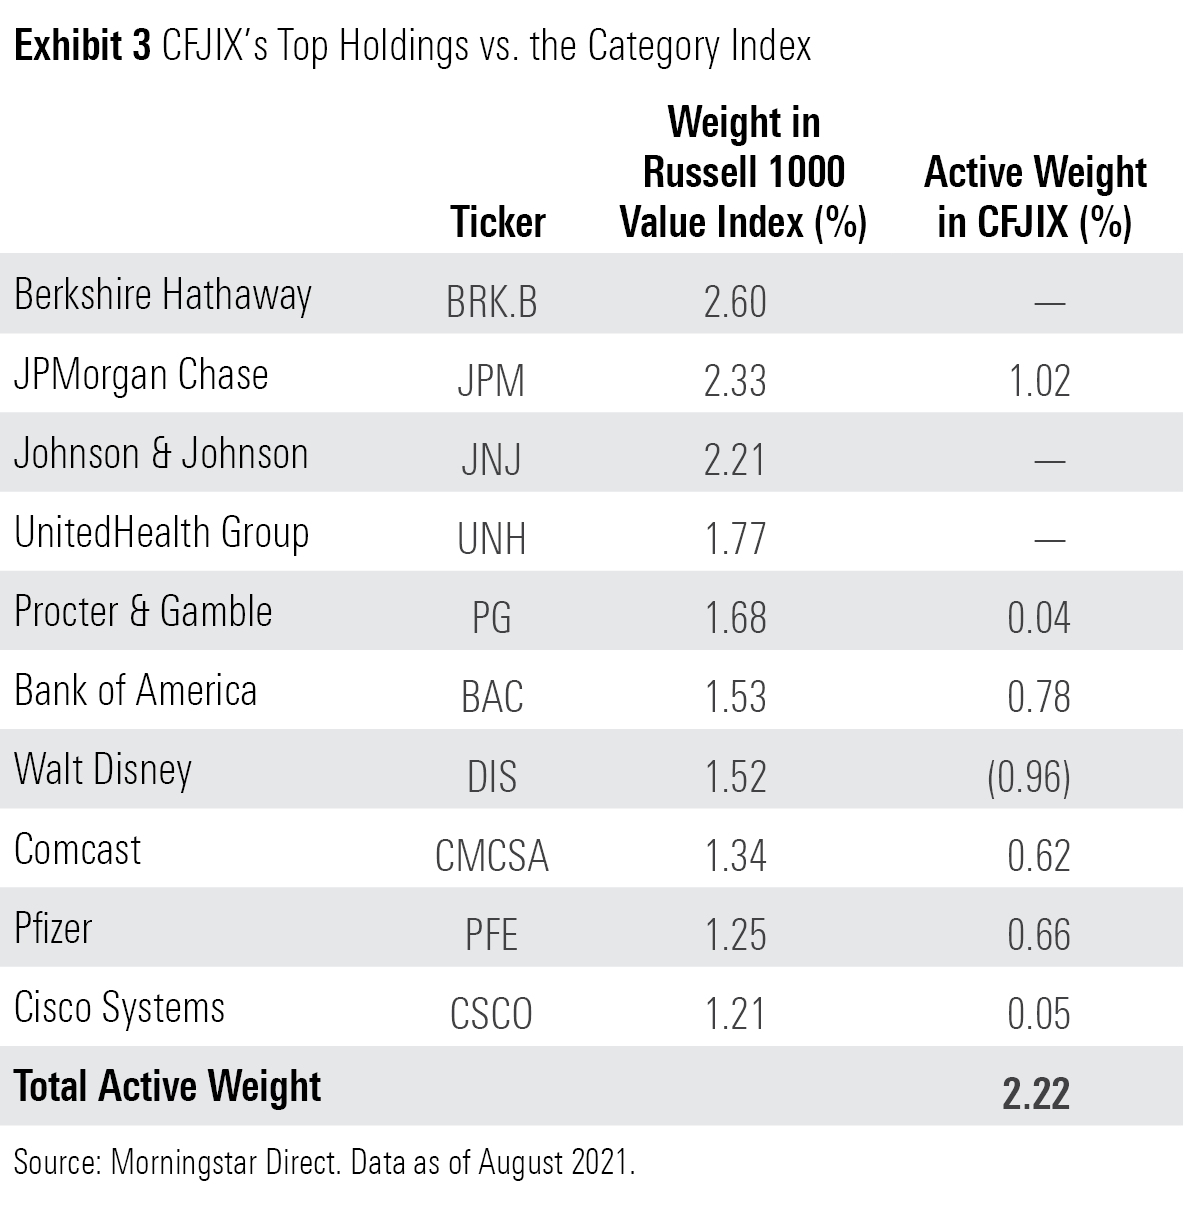
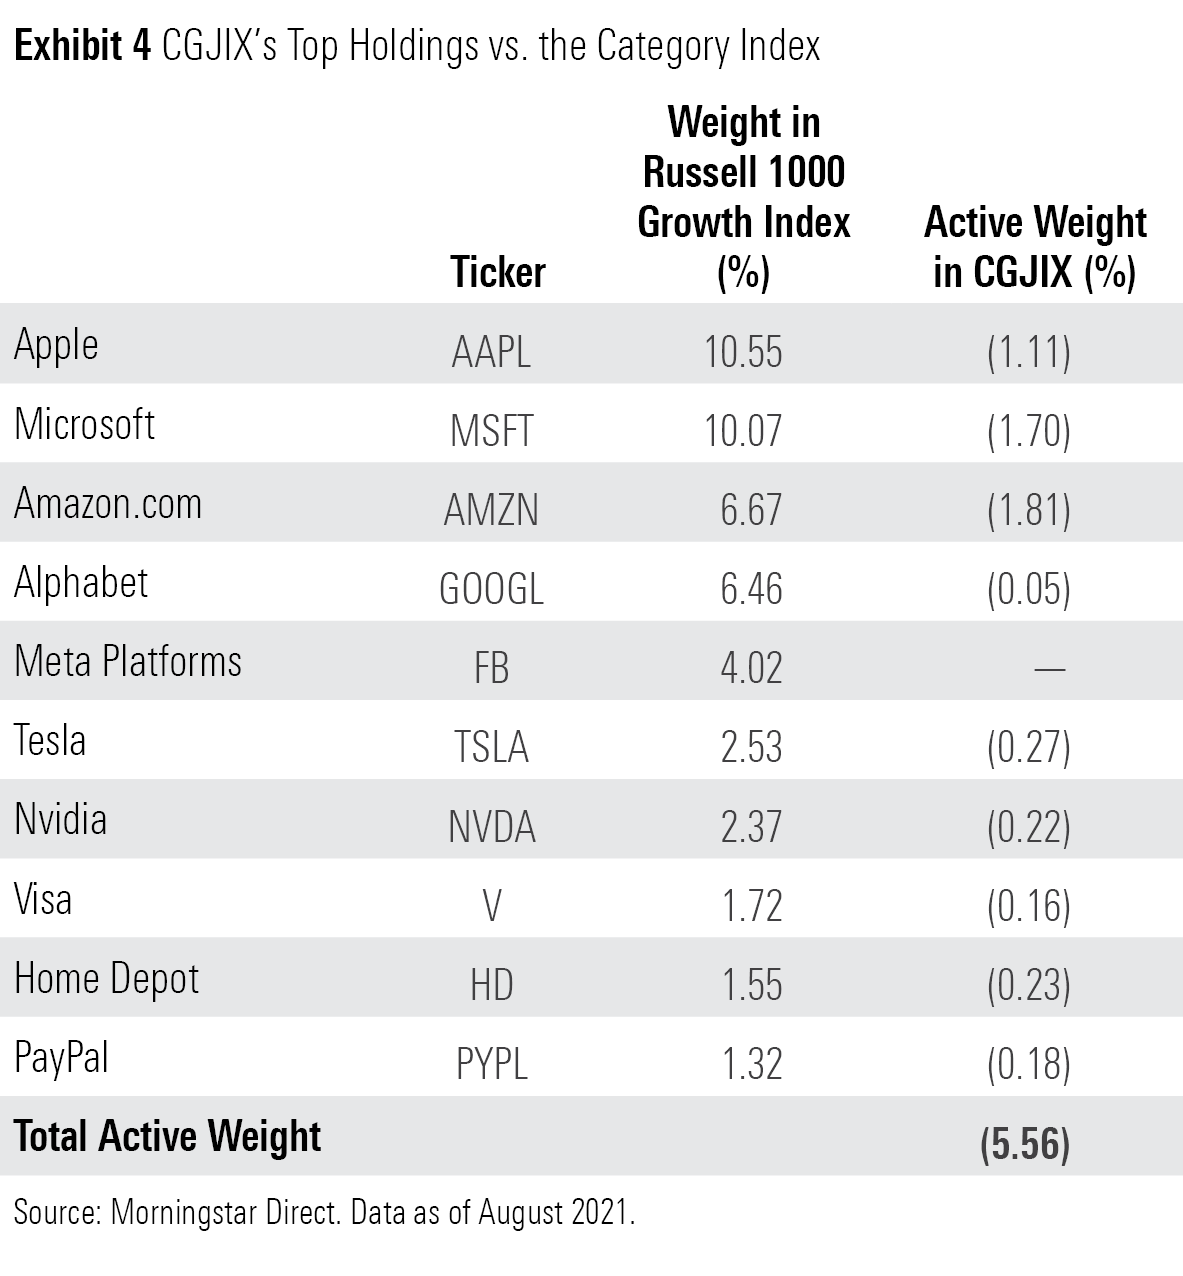
Exhibits 3 and 4 display the top holdings of each ESG portfolio compared with their respective category indexes. Calvert US Large-Cap Value Responsible Index excludes more prominent holdings from the category index than the growth strategy, overweighting the remaining large-cap stocks as a result. This level of concentration is not uncommon in market-cap-weighted ESG strategies. When large firms with bad ESG bona fides get cut, market-cap-weighting naturally pulls the fund more toward the industry giants that make the cut. The stricter the screen, the greater the effect, as more holdings are left out.
On the other hand, the Calvert US Large-Cap Growth Responsible Index is currently less concentrated than its category index as it underweights all of the index's top 10 holdings (except for Meta Platforms FB [formerly Facebook], which it excludes). This is likely an artifact of the fund's broader lineup. It owned 565 stocks versus the Russell 1000 Growth's 501 as of August 2021. Calvert's weight constraints are also a factor.
Certain sectors are less ESG-friendly and more correlated with investment factors than others, so the same ESG criteria can impact portfolios differently across the style spectrum.
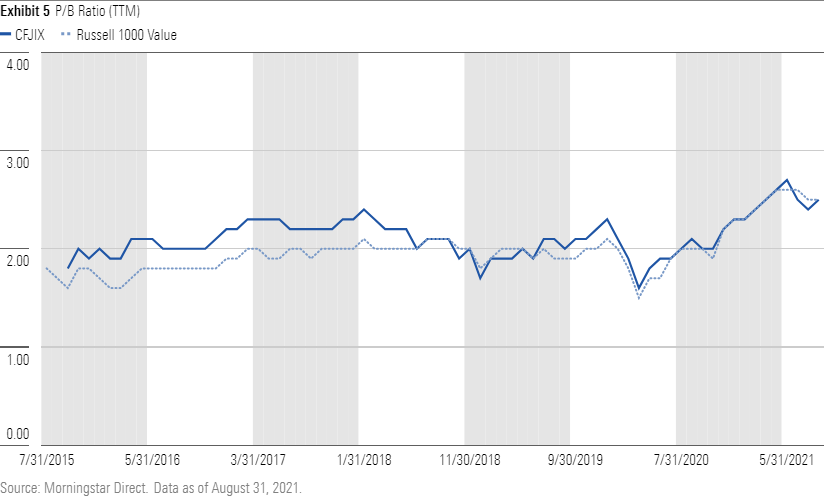
For example, Calvert US Large-Cap Value Responsible Index has been consistently underweight real estate and energy stocks and overweight financials. As of August 2021, its stake in financial stocks was 7.4 percentage points higher than the Russell 1000 Value Index's, while its energy and real estate stakes were 4.2 and 4.3 percentage points lower, respectively. Prior to June 2018, it was overweight in technology and consumer discretionary stocks and light on financials. This meant its valuation profile was slightly rich relative to the Russell 1000 Value Index.
Calvert US Large-Cap Growth Responsible Index's sector tilts tend to be slighter than those of Calvert US Large-Cap Value Responsible Index. The fund has historically been a bit underweight in technology and communication-services stocks while loading up on healthcare names.
As a result, the value strategy's active share tends to run higher the growth strategy. As of August 2021, Calvert US Large-Cap Value Responsible Index had a 49% active share against the Russell 1000 Value Index, while Calvert US Large-Cap Growth Responsible Index's active share against the Russell 1000 Growth Index was just 24%.
Is Grass Greener on the ESG Side?
Can these ESG-screened style indexes do better than their conventional peers? It's hard to say. We have little data to deal with in this case. And the little we do have doesn't suggest a predictable pattern of impact that the indexes' combined ESG/style focus might have on long-term risk and returns. While the funds have a slightly longer history than a large number of ESG strategies, their life spans don't encompass a full market cycle.
Since their inceptions in June 2015, Calvert US Large-Cap Value Responsible Index has outperformed the Russell 1000 Value Index by 0.97% on an annualized basis, while Calvert US Large-Cap Growth Responsible Index has underperformed the Russell 1000 Growth Index by 0.80% annualized. For comparison, the funds' core counterpart, Calvert US Large-Cap Core Responsible Index CISIX, outperformed the Russell 1000 Index by 46 basis points annualized over this same period.
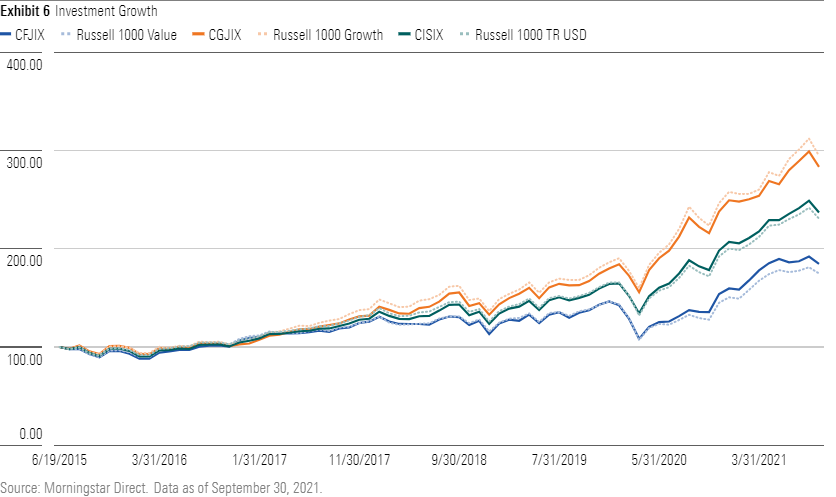
As growth stocks have led the market over the past few years, Calvert US Large-Cap Growth Responsible Index's underweighting and exclusion of top growth names did not play out well. Treading lightly in Apple AAPL and Moderna MRNA proved costly. On the other hand, Calvert US Large-Cap Value Responsible Index favored growth-oriented market leaders in technology such as Microsoft MSFT, which was a major contributor to its excess returns versus the category index. Being underweight energy stocks also helped.
The market will not always be this way, however, and these active bets will not always pan out. For example, in 2018, the absence of energy stocks and Berkshire Hathaway BRK.B from Calvert US Large-Cap Value Responsible Index's portfolio was the main reason it lagged the category index by 1.8 percentage points. On the other hand, Calvert US Large-Cap Growth Responsible Index outperformed the Russell 1000 Growth Index by 2.3 percentage points that year. This is thanks to its positions in communications-services and healthcare stocks like Alphabet GOOGL and Merck MRK.
These funds' track records highlight a common feature of all ESG funds: ESG incorporation introduces active risk. These funds' ESG screens add another layer of active risk on top of their style orientations. While the ESG screens in this instance are purely exclusionary, the funds' style tilts narrow their starting universe and can ratchet up the level of active risk in the process.
More Than Just Style
ESG index strategies will inevitably court more active risk than their ESG-agnostic counterparts. The intersection of style and ESG takes on incrementally more active risk than considering either in isolation.
But after all is said and done, these funds still own broad cross sections of their selection universes, let the market do the heavy lifting when it comes to weighting stocks, and charge low fees. The modest increment of active risk they take on because of their dual ESG and style mandates is unlikely to swamp those benefits, which is why we've awarded them with Morningstar Analyst Ratings of Bronze.
Editor's note: An earlier version of this article described Calvert's ESG process as exclusionary. The article was updated to reflect more nuances in its approach.
Disclosure: Morningstar, Inc. licenses indexes to financial institutions as the tracking indexes for investable products, such as exchange-traded funds, sponsored by the financial institution. The license fee for such use is paid by the sponsoring financial institution based mainly on the total assets of the investable product. Please click here for a list of investable products that track or have tracked a Morningstar index. Morningstar, Inc. does not market, sell, or make any representations regarding the advisability of investing in any investable product that tracks a Morningstar index.
/cloudfront-us-east-1.images.arcpublishing.com/morningstar/ZKOY2ZAHLJVJJMCLXHIVFME56M.jpg)
/cloudfront-us-east-1.images.arcpublishing.com/morningstar/IGTBIPRO7NEEVJCDNBPNUYEKEY.png)
/cloudfront-us-east-1.images.arcpublishing.com/morningstar/HDPMMDGUA5CUHI254MRUHYEFWU.png)
:quality(80)/s3.amazonaws.com/arc-authors/morningstar/c00554e5-8c4c-4ca5-afc8-d2630eab0b0a.jpg)