
Top 10 Holdings of Our Ultimate Stock-Pickers' Index
We examine the biggest contributors to -- and detractors from -- the performance of the index during the past year.
/s3.amazonaws.com/arc-authors/morningstar/4ef98a5a-6be5-4127-a335-3568837ad0cd.jpg)
/s3.amazonaws.com/arc-authors/morningstar/e03383eb-3d0b-4b25-96ab-00a6aa2121de.jpg)
Fund investors would like to see the manager of the actively managed funds they own beat the market every year, but they've been left wanting for well over a decade. The lack of consistent outperformance by large-cap active managers (the main contributors to the Ultimate Stock-Pickers concept) has been well documented by Morningstar's Active/Passive Barometer. For the 20 years ending in December 2020, our researchers noted that just 11.3% of large-cap managers had managed to both survive and outperform the S&P 500. Over the most recent five years, the percent of actively managed large cap funds that have outperformed the S&P 500 is consistent across investing styles. A mere 16.5% of large-cap blend managers have outperformed their index over the past five years versus 20.3% of large-cap value managers and 20.6% of large-cap growth managers.
Even though five-year results have been lacking for active management, about 34.4% of large-cap growth funds have still managed to outperform the S&P 500 benchmark in 2020. We saw a marked improvement in managers' results in the large-cap value category, which overperformed compared with 2019. Morningstar's large-cap index (MLCP) has posted year-to-date returns of 17.08%.
The fund managers represented in our Ultimate Stock-Pickers concept have had their own issues with relative long-term performance. Only three of our 21 top fund managers were beating the S&P 500 on a 10-year basis at the end of last week. Our fund managers' performance in 2021 isn't looking much better, as only seven of our 21 fund managers beat the S&P 500 year to date. Vanguard PrimeCap VPMCX and Akre Focus Retail AKREX are the only two funds that have managed to beat the S&P 500 for both periods measured.
As a reminder, we devised the Ultimate Stock-Pickers concept as a stock-picking screen, not as a guide for finding fund managers to add to an investment portfolio. Our primary goal has been to identify a sufficiently broad collection of stock-pickers who have shown an ability to beat the markets over multiple periods (with an emphasis on longer-term periods). We then cross-reference these managers' top holdings, purchases, and sales against our own stock analysts' recommendations regularly, allowing us to uncover securities that investors might want to investigate further. There will always be limitations to our process. We try to focus on managers that our fund analysts cover and on companies that our stock analysts cover, which reduces the universe of potential ideas that we can ultimately address in any given period. This emphasis is also the main reason why we focus so much attention on large-cap fund managers, as they tend to be covered more broadly on the fund side of our operations, and their stock holdings overlap more heavily with our active stock coverage. That said, by limiting themselves to the largest and most widely followed companies, our top managers may miss out on some big ideas on small companies that have the potential to generate greater outperformance in the long run.
Overall, 2020 was a challenging year for stocks given the COVID-19 pandemic. After a sharp drop in the second quarter, the market bounced back, almost impervious to the pandemic-induced business slowdowns across the globe. However, the last few months have seen the global economy recovering from the economic headwinds brought on by the COVID-19 pandemic. This market recovery has been buoyed by a largely successful COVID-19 vaccine rollout in the United States. Even so, certain industries remain hard-hit (e.g., tourism, in-person shopping), though governments worldwide continue to take steps to mitigate the economic impact. With economic activity resuming and dollars flowing into the global equity markets, we currently see the broad U.S. equity market as marginally overvalued and trading above par with our analysts' fair value estimates.
Taking a look at the cyclically adjusted price/earnings, or CAPE, ratio, which divides the current market price by the average of 10 years of earnings (adjusted for inflation), it currently stands at around 36.95, above where it was when we wrote the last article (33.46). This ratio is compared with a historical mean of 16.82 and median of 15.83, with Shiller relying on market data from both estimated (1881-1956) and actual (1957 onward) earnings reports from companies represented in the S&P 500 Index. Today's levels are higher than levels seen before the Great Financial Crisis and Black Tuesday. The CAPE ratio is generally used to assess potential returns from equities over longer time frames, with higher-than-average CAPE values implying lower-than-average long-term annual returns going forward, which is what we're gleaning from the current ratio. While not intended to indicate impending market crashes, it has provided warning signs for investors in the past.
Our own Morningstar Ultimate Stock-Pickers index has not been immune to the trend of underperformance of active management, as it still trails the S&P 500 Index year to date.
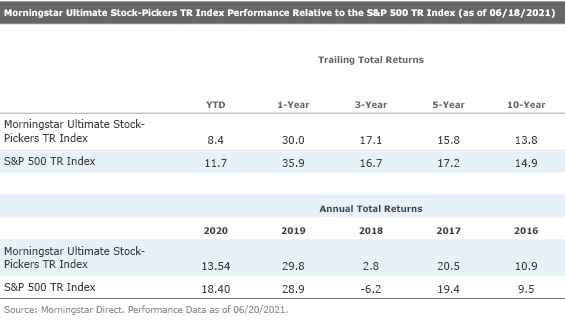
Aside from tracking the holdings, purchases, and sales, and the ongoing investment performance of our Ultimate Stock-Pickers, we also follow the makeup and results of the Morningstar Ultimate Stock-Pickers TR Index. For those who may not recall, the Ultimate Stock-Pickers index was set up to track the highest-conviction holdings of 25 different managers, a list that includes our 21 top fund managers as well as the investment managers of four insurance companies—Berkshire Hathaway BRK.A/BRK.B, Markel MKL, Alleghany Y, and Fairfax Financial FRFHF. It is constructed by taking all the stock holdings of our Ultimate Stock-Pickers that are not only covered by Morningstar stock analysts but have either a low or medium uncertainty rating and ranking them by their Morningstar Conviction Score. The Morningstar Conviction Score is made up of three factors:
- The overall conviction (number and weighting of holdings)
- The relative current optimism (holdings being purchased)
- The relative current pessimism (holdings being sold)
The index is composed of three sub-portfolios—each containing 20 securities—that are reconstituted quarterly on a staggered schedule. As such, one third of the index is reset every month, with the 20 securities with the highest-conviction scores making up each sub-portfolio when they are reconstituted. This structure means that the overall index can hold anywhere between 20 and 60 stocks at any given time (because some stocks may remain as the highest-conviction score holders in any given period, meaning there can be overlaps in the holdings, reducing the total number of different stocks held). In reality, the index is usually composed of 35 to 45 securities, holding 40 stocks in all at the end of May. These stocks should represent some of the best investment opportunities that have been identified by our Ultimate Stock-Pickers in any given period. It can also have more concentrated positions than one might find in a typical mutual fund, with the top 10 (25) holdings in the index accounting for 33.4% (60.2%) of the total invested portfolio at the end of last month. The size and concentration of the portfolio do change, though, as this is an actively managed index that tries to tap into our top managers' movements and conviction levels over time.
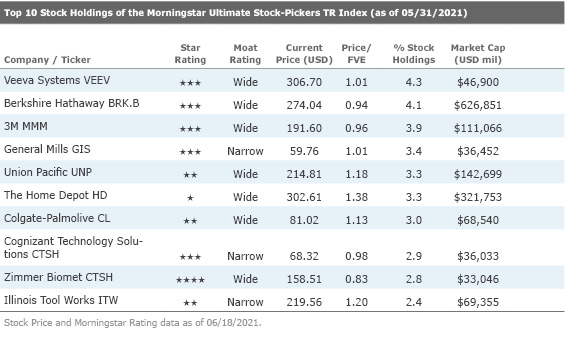
Looking at the top 10 stock holdings of the Morningstar Ultimate Stock-Pickers index at the end of November, there is currently only one name trading at approximately a 10% or more discount to our analysts' fair value estimates. This company is wide-moat rated Zimmer Biomet Holdings ZBH, which currently trades at a 17% discount to analyst Debbie Wang’s fair value estimate of $192 per share. As this company is both undervalued and a top stock holding on our index, we believe it merits further discussion.
Zimmer Biomet designs, manufactures, and markets orthopedic reconstructive implants as well as supplies and surgical equipment for orthopedic surgery. With the acquisitions of Centerpulse in 2003 and Biomet in 2015, Zimmer holds the leading share of the reconstructive market in the United States, Europe, and Japan. Wang asserts that specifically with the addition of smaller competitor Biomet, Zimmer is the undisputed king of large joint reconstruction, by far. We expect favorable demographics, which include aging baby boomers and rising obesity, to fuel solid demand for large-joint replacement that should offset price declines.
Wang lays out her opinion on Zimmer’s strategy, which appears to be two-pronged. First, the company focuses on cultivating close relationships with orthopedic surgeons who make the brand choice. High switching costs and high-touch service keep the surgeons closely tied to their primary vendor, and the surgeons bring in enough profitable procedures to keep hospital administrators at bay. This close relationship and vendor loyalty also explain why market share shifts in orthopedic implants are glacial, at best. As long as Zimmer can launch comparable technology within a few years of its rivals, it can remain in a strong competitive position.
The second part of Zimmer’s strategy has been its aim to accelerate growth through innovative products and improved execution. The latter is critical, in our view, to realizing the firm’s potential.
With regard to the company’s economic moat, Wang believes that Zimmer's wide economic moat stems from two major sources. First, there are substantial switching costs for orthopedic surgeons. The extensive instrumentation, or tool sets, used to prepare bones and install implants are specific to each company. The learning curve to become proficient in using one company's instrumentation is significant. Second, she believes that Zimmer's moat also involves intangible assets, including intellectual property that protects the product portfolio, which is characterized by evolutionary changes to technology because new generations of products rely on intellectual property established by earlier iterations of those devices.
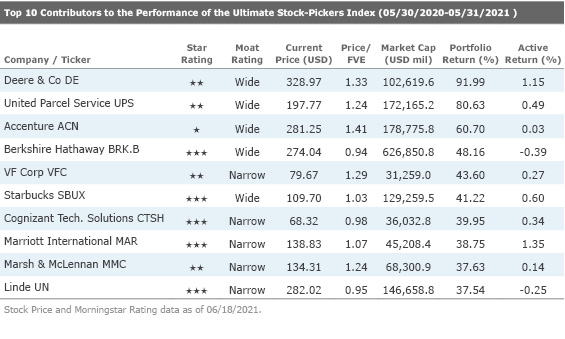
Looking at the year-over-year performance of the Morningstar Ultimate Stock-Pickers Index, some of the highest-performing standouts came from the industrials sector, which supplied the top two names to the Top 10 Contributors list. We note that Berkshire Hathaway, and Cognizant Technology CTSH appeared on both the Top 10 Holdings and Top 10 Contributors list this quarter. We find it pertinent to discuss United Parcel Service UPS, a top contributor to the Index’s performance.
Morningstar analyst Matthew Young believes UPS is overvalued—the stock currently trades at a 24% premium to Young’s $160 per share fair value estimate. To give a brief overview, UPS is the world's largest parcel delivery company. The firm manages a massive fleet of more than 500 planes and 100,000 vehicles, along with many hundreds of sorting facilities, to deliver an average of about 22 million packages per day to residences and businesses across the globe. UPS' domestic U.S. package operations generate 61% of total revenue while international package operations make up 20%.
UPS is the giant among global small-parcel delivery companies, and it’s one of three commercial providers that dominate the marketplace; FedEx FDX and UPS are the major U.S. incumbents, while DHL Express leads in Europe. Young notes that despite its unionized workforce and asset intensity, UPS produces operating margins well above those of its competitors, thanks in large part to its leading package density—it's been around much longer than FedEx in the U.S. ground market. Further, favorable e-commerce trends should remain a longer-term top-line tailwind for UPS' U.S. ground and express package business. That said, growth won't be costless; UPS is amid an operational transformation initiative aimed at mitigating the challenges of a rising mix of lower-margin business-to-consumer deliveries.
Young also sees risk with Amazon’s AMZN insourcing more of its own last-mile delivery needs. He believes that Amazon’s move removes some incremental growth opportunities for UPS while creating risk that Amazon decides to take in-house the shipments it currently sends though UPS—the retailer now makes up about 13% of UPS’ total revenue. However, at the same time, Young asserts that Amazon still very much needs UPS’ capacity and taking that all in-house would require a staggering level of incremental investment.
On the economic moat front, Young views UPS as a wide-moat company. He believes that its competitive advantages are rooted in cost advantage and efficient scale. Young views UPS’ scale to keep many competitors at bay. In the case of UPS, a new entrant would have no choice but to replicate UPS’ sprawling asset base in the absence of economic package flow, yielding a long period of painful losses. This creates a major barrier to rational would-be entrants, which should have minimal incentive to enter. Further, scale-based cost advantages also arise for UPS due to immense network processing scale and substantial package density. UPS enjoys considerably lower unit and marginal costs than a potential new entrant because it processes millions of packages over a massive far-reaching delivery network that’s marked by high fixed costs.
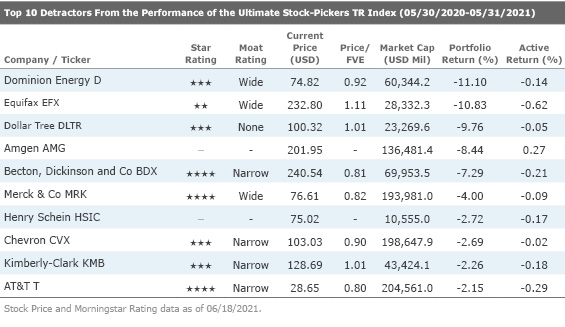
While lists of top-performing stocks are often composed of stocks that have already run up, our top detractors' list can sometimes be a good area to pick through the wreckage. Although these names might not be performing well, it is possible that there could be some value plays in the long run. From our current list, we will highlight wide-moat rated Dominion Energy D, which is trading at an 8% discount to Morningstar analyst Charles Fishman’s fair value estimate of $81.
Dominion Energy is an integrated energy company with approximately 30 gigawatts of electric generation capacity and more than 93,000 miles of electric transmission and distribution lines. Since 2010, Dominion has focused on the development of projects with conservative strategies, exited the exploration and production business, sold or retired no-moat merchant energy plants, and made plans for significant investments in moaty utility infrastructure.
With regard to the company’s ability to generate excess returns on capital, Fishman contends that a regulated utility can establish a wide economic moat if it operates in a constructive regulatory environment and its nonutility businesses have sustainable competitive advantages. Over 85% of Dominion’s earnings come from regulated gas and electric utilities with some of the most constructive regulation and attractive growth potential in the country. Fishman believes that electric transmission is a wide-moat business due to its efficient scale competitive advantage. Once a transmission line is constructed, there is little incentive for competitors to enter a market. In addition, the Federal Energy Regulatory Commission prevents new transmission from being built unless there is a demonstrated economic need to do so. Because of the monopoly status, FERC regulates the rates that can be charged, but it generally allows companies to earn a return on their capital well above their cost of capital.
Further, Fishman believes that Dominion's overall moat trend is stable. This stable trend rating is based on Dominion's wide-moat businesses having stable moat trends. Fishman does not expect any material changes to FERC's electric transmission regulatory framework in the foreseeable future. In addition, projects like Cove Point have long-term contracts with creditworthy counterparties. Thus, the moat trend for these infrastructure businesses is stable.
Additional information provided by Justin Pan, Morningstar associate equity research analyst.
Disclosure: Malik Ahmed Khan, Justin Pan, and Eric Compton have no ownership interests in any of the securities mentioned above. It should also be noted that Morningstar's Institutional Equity Research Service offers research and analyst access to institutional asset managers. Through this service, Morningstar may have a business relationship with fund companies discussed in this report. Our business relationships in no way influence the funds or stocks discussed here.
/cloudfront-us-east-1.images.arcpublishing.com/morningstar/PLMEDIM3Z5AF7FI5MVLOQXYPMM.jpg)
/cloudfront-us-east-1.images.arcpublishing.com/morningstar/I53I52PGOBAHLOFRMZXFRK5HDA.jpg)
/cloudfront-us-east-1.images.arcpublishing.com/morningstar/CEWZOFDBCVCIPJZDCUJLTQLFXA.jpg)
:quality(80)/s3.amazonaws.com/arc-authors/morningstar/4ef98a5a-6be5-4127-a335-3568837ad0cd.jpg)
:quality(80)/s3.amazonaws.com/arc-authors/morningstar/e03383eb-3d0b-4b25-96ab-00a6aa2121de.jpg)