
Key Statistics About Income and Wealth for the U.S. LGBTQ+ Population
Homeownership rates are lower and poverty rates are higher, especially for transgender people and LGBTQ+ people of color.
/s3.amazonaws.com/arc-authors/morningstar/66112c3a-1edc-4f2a-ad8e-317f22d64dd3.jpg)

Nearly eight years ago, the Supreme Court’s ruling in the Obergefell v. Hodges case guaranteed the right of same-sex couples to marry. It was a watershed event.
While marriage can benefit many people’s financial lives, LGBTQ+ people remain at a disadvantage relative to heterosexual people in terms of income and wealth, on average. Average incomes are lower and poverty rates are higher, especially for transgender people and LGBTQ+ people of color. Ownership rates of financial assets, including retirement accounts and homes, are correspondingly lower.
In the spirit of Pride month (June) and to illuminate the financial challenges that some people in the LGBTQ+ community are facing, we’ve compiled statistics about LGBTQ+ income, wealth, and financial wellness. These statistics also highlight the intersection of different facets of personal identity like age, race, and gender.
You’ll notice some differences in the terminology used. For example, Morningstar uses LGBTQ+, but other variations appear depending on the language in the data sources we reference.
LGBTQ+ Demographics
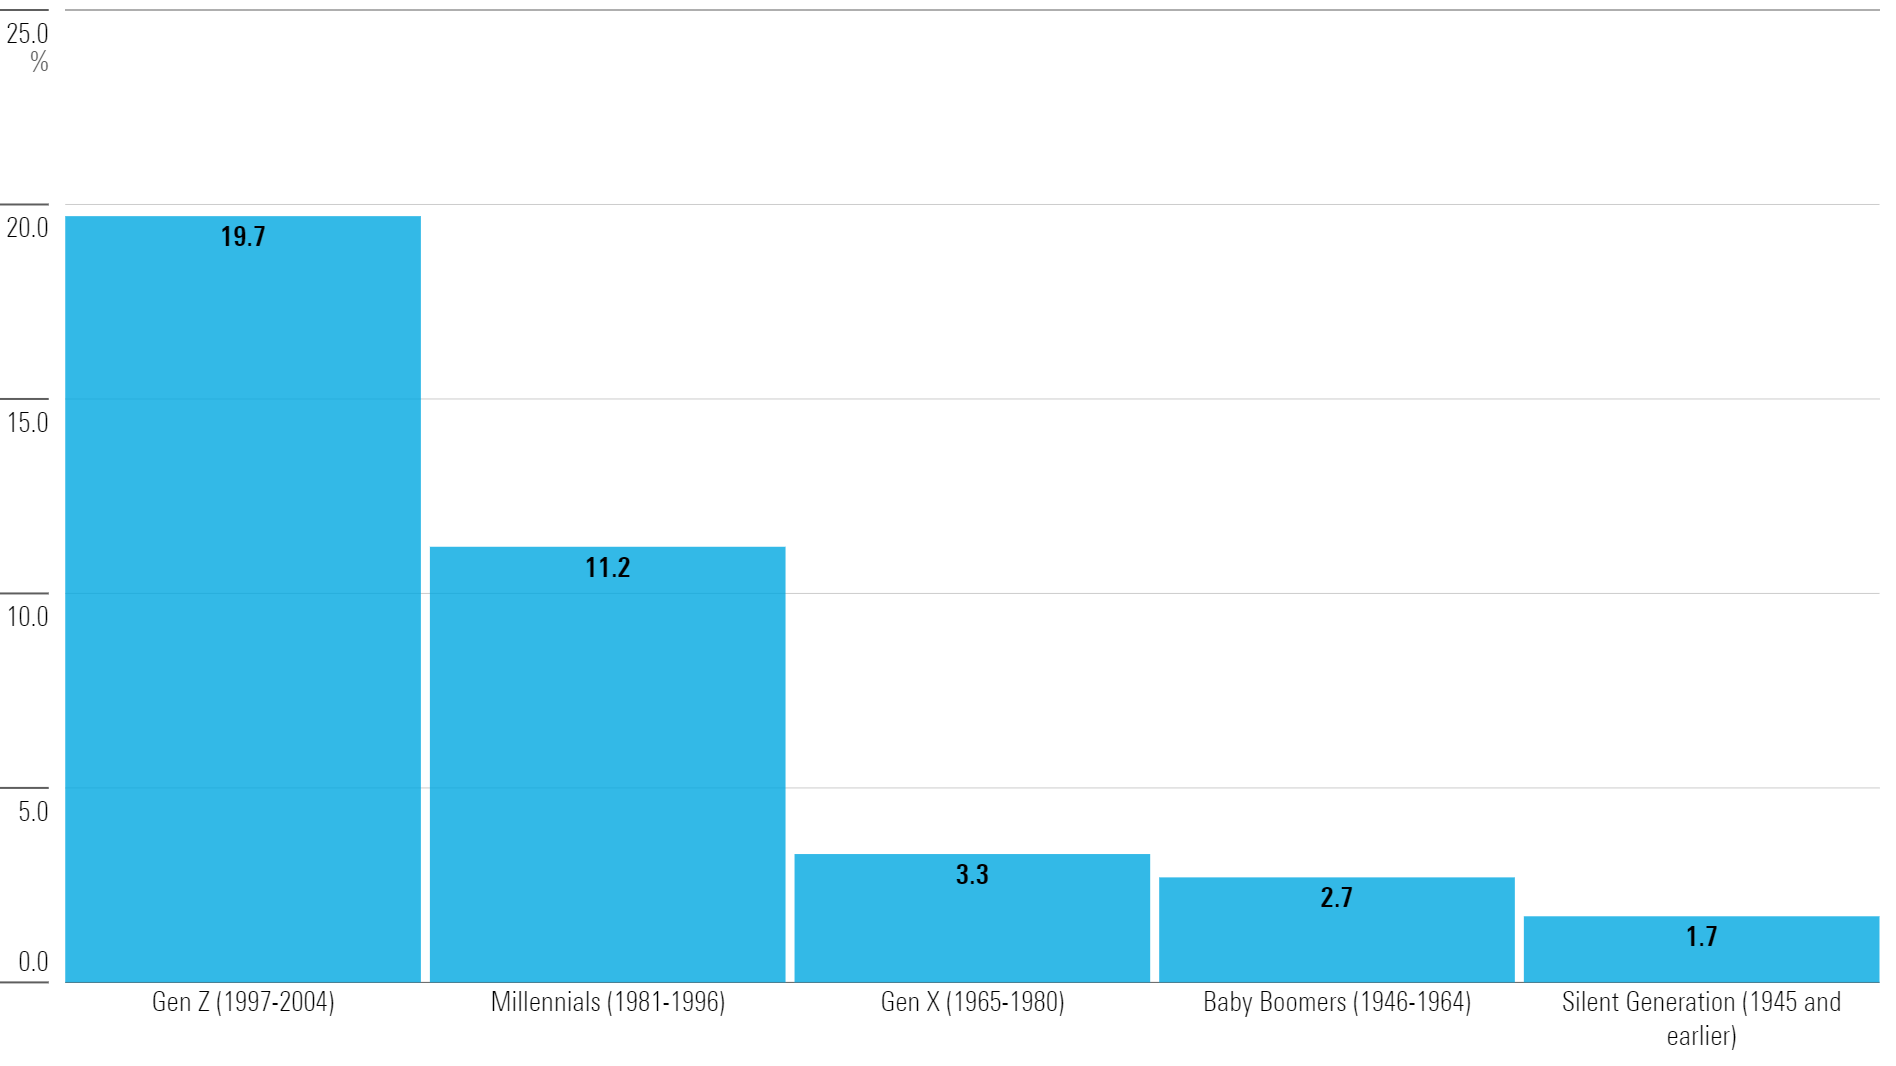
In a 2022 Gallup survey on LGBT identification, 7.2% of U.S. adults identified as LGBT, double the 3.5% reported in 2012 when Gallup first started collecting this data. The survey found higher reported LGBT identification among younger generations. This skew likely impacts metrics of financial health and homeownership relative to non-LGBT adults.
Percentage of U.S. Adults Who Identify as LGBT by Generation
Among U.S. LGBT adults in the 2022 Gallup survey,
- 58.2% identified as bisexual.
- 20.2% identified as gay.
- 13.4% identified as lesbian.
- 8.8% identified as transgender.
- 6.0% volunteered another non-heterosexual preference, such as queer.
A 2019 Pew Research Survey of U.S. adults found that gay, lesbian, or bisexual people are more likely to be single than heterosexual people.
- 47%: Percentage of gay, lesbian, and bisexual people who were single, 2019.
- 29%: Percentage of heterosexual people who were single, 2019.
In the 2021 American Community Survey from the U.S. Census Bureau, a higher percentage of domestic opposite-sex couples had children in the household compared with same-sex couples.
- 15.0% of same-sex couple households had children under 18.
- 37.8% of opposite-sex couple households had children under 18.
LGBTQ+ Income, Poverty, and Financial Stress
The 2021 American Community Survey from the U.S. Census Bureau found that same-sex couple households had a higher median income than opposite-sex couple households, but both partners in same-sex couples were more likely to be employed. Male-male couples had the highest median income.
- $103,000: Median household income for same-sex couples.
- $116,800: Median household income for male-male couples.
- $92,470: Median household income for female-female couples.
- $102,800: Median household income for married opposite-sex couples.
- 61.2%: Percentage of same-sex couple households where both partners were employed.
- 49.1%: Percentage of opposite-sex couple households where both partners were employed.
A 2021 study from the Williams Institute at the UCLA School of Law found that poverty rates among U.S. adults were higher among LGBT people than straight cisgender people.
Poverty Rates Among U.S. LGBT and Straight Cisgender People
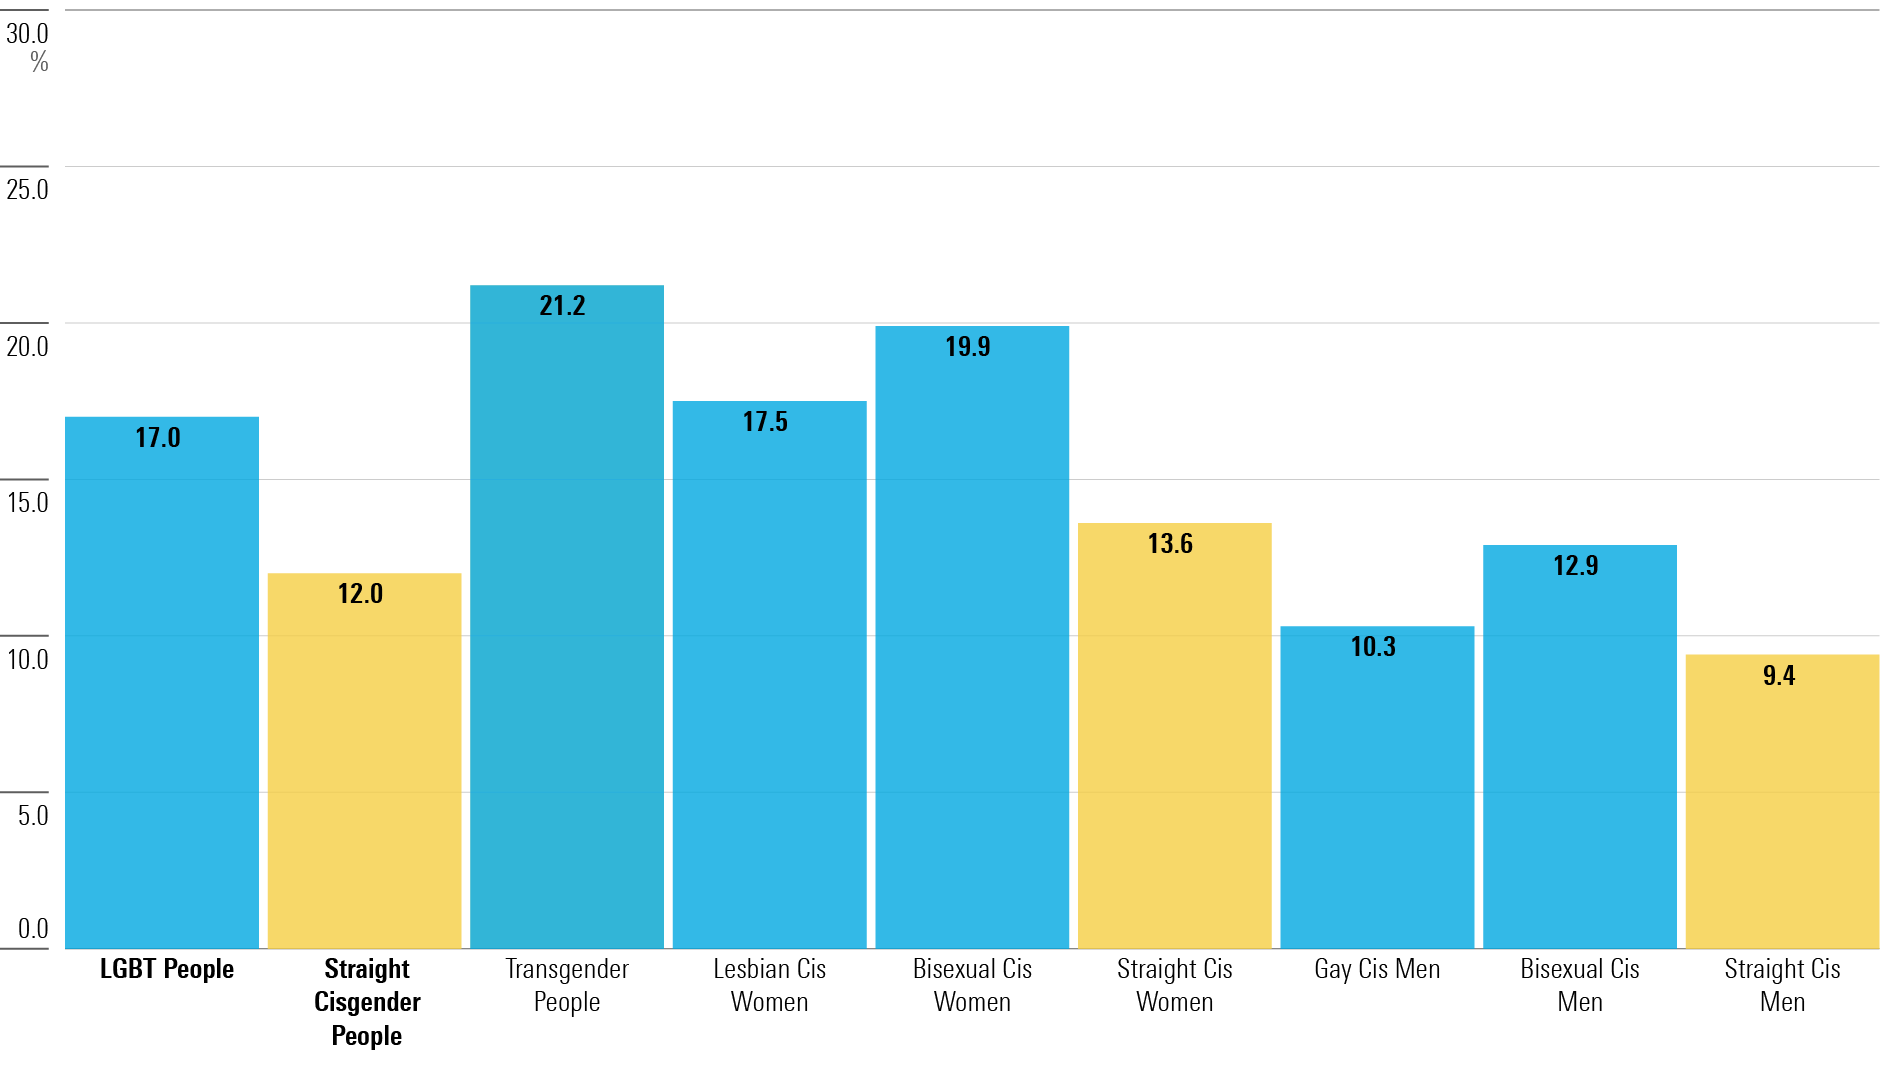
Poverty rates were highest among transgender people. Women and people of color also had higher poverty rates.
- 13%: Poverty rate for white LGBT people, 2021.
- 7.4%: Poverty rate for white straight cisgender people, 2021.
- 24.7%: Poverty rate for LGBT people of color, 2021.
- 20.2%: Poverty rate for straight cisgender people of color, 2021.
The Federal Reserve’s 2022 Survey of Household Economics and Decisionmaking found that LGBTQ+ adults have less confidence in their financial situation than adults who do not identify as LGBTQ+.
- 65%: Percentage of adults identifying as LGBTQ+ who stated they are doing at least financially OK.
- 75%: Percentage of adults who do not identify as LGBTQ+ and stated they are doing at least financially OK.
LGBTQ+ Housing and Homeownership
Housing security and psychological safety are critical building blocks of economic prosperity. The risk of homelessness among LGBT young adults (ages 18-25) is 2.2 times greater than non-LGBT young adults, according to a 2019 study by the Center for LGBTQ Economic Advancement and Research.
The Williams Institute at the UCLA School of Law found that fewer LGBT adults own their homes compared with non-LGBT adults.
Homeownership Rates Among LGBT and Non-LGBT Adults and Couples
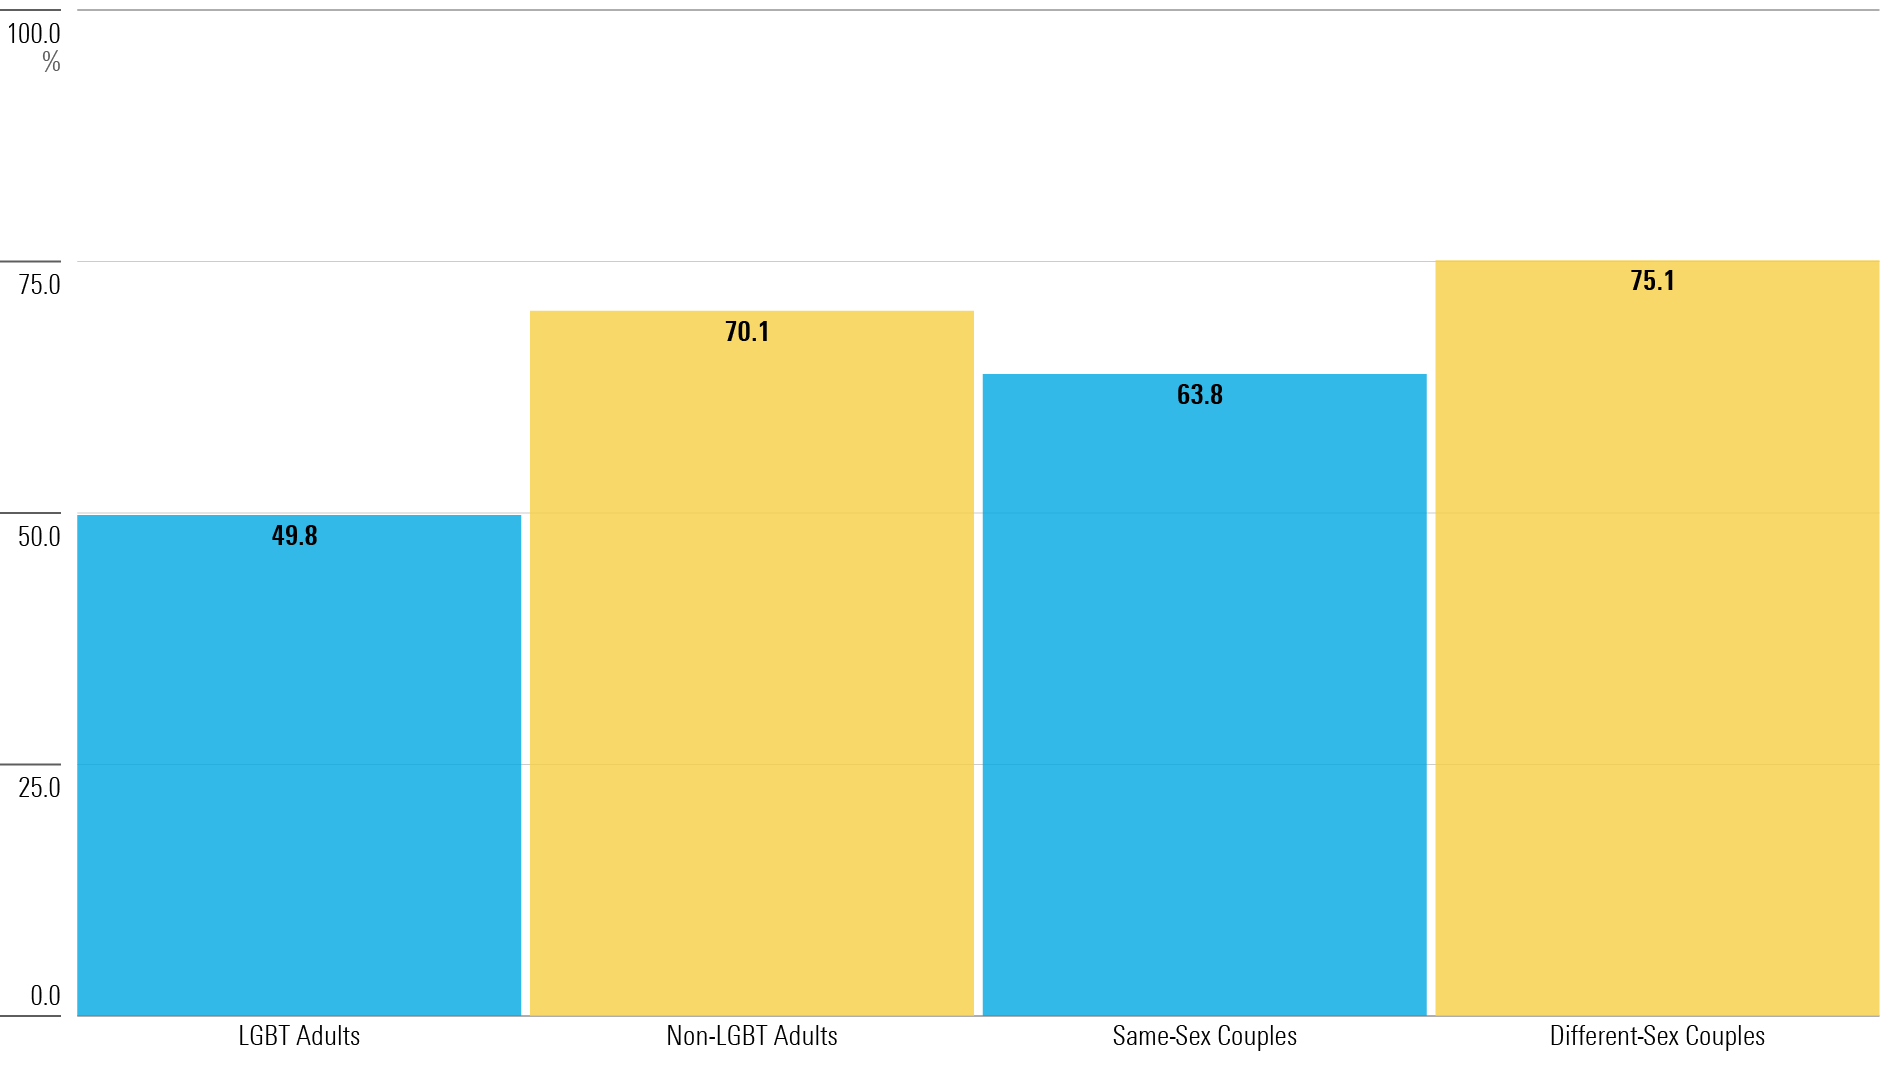
While homeownership rates may be affected by where different groups are more likely to live, whether in metropolitan or nonmetropolitan areas, LGBT homeowners reported having higher monthly mortgage payments compared with non-LGBT peers across the board.
- 54.5% of LGBT homeowners were paying more than $1,250 per month to their mortgage, 2019.
- 45.5% of non-LGBT homeowners were paying more than $1,250 per month to their mortgage, 2019.
LGBTQ+ Retirement Assets and Retirement Preparedness
Across income groups, LGBT adults are less likely to be confident in having enough to live comfortably throughout retirement, according to the Employee Benefit Research Institute. LGBT adults also estimated later retirement ages than non-LGBT adults. Among retired survey participants,
- 60% of LGBT retirees retired earlier than planned.
- 47% of non-LGBT retirees retired earlier than planned.
The percentage of individuals participating in retirement savings products was lower than the general population, according to a 2019 study by the Center for LGBTQ Economic Advancement & Research.
- 49.8%: Percentage of LGBT individuals who have assets in a 401(k) or other employer-sponsored retirement plan.
- 58.0%: Percentage of people in the general population with assets in a 401(k) or other employer-sponsored retirement plan.
- 28.5%: Percentage of LGBT individuals who have assets in an IRA.
- 37.7%: Percentage of people in the general population with assets in an IRA.
Aside from managing day-to-day finances in retirement, LGBTQ adults planning for retirement noted different priorities compared with non-LGBTQ adults. LGBTQ Americans are more likely to cite developing a strategy for reducing debt, purchasing a home, starting a business, and establishing/growing a family through adoption or having children as secondary goals for retirement planning. Non-LGBTQ Americans are more likely to say developing a strategy for drawing income in retirement and being able to leave an inheritance to their children or other family members as secondary goals for retirement planning.
A version of this article was previously published on June 4, 2021.
The author or authors do not own shares in any securities mentioned in this article. Find out about Morningstar’s editorial policies.
:quality(80)/cloudfront-us-east-1.images.arcpublishing.com/morningstar/DJVWK4TWZBCJZJOMX425TEY2KQ.png)
:quality(80)/cloudfront-us-east-1.images.arcpublishing.com/morningstar/Q27ZB7KFPZBMHFKY6IURRWJQHM.png)
:quality(80)/cloudfront-us-east-1.images.arcpublishing.com/morningstar/EBTIDAIWWBBUZKXEEGCDYHQFDU.png)