
How to Balance ESG and Market Representation
Pure ESG investments require trade-offs.
/s3.amazonaws.com/arc-authors/morningstar/c00554e5-8c4c-4ca5-afc8-d2630eab0b0a.jpg)
Shopping for environmental, social, and governance funds might feel a bit like walking down the supplements aisle at the grocery store. There is a vast array of products from multiple brands, each with a different tagline. It’s often difficult to gauge which is right for you, especially when the language around these products doesn’t lend itself to easy comparisons.
In an effort to sort out what's what, we have previously shared a simple framework to help investors sort ESG strategies. This article will further animate the key factors that investors should consider when they peel back the label on ESG-intentional index funds. We will conduct a case study focusing on three ESG-intentional indexes from MSCI which underpin five different Morningstar Medalist funds. These indexes aim to balance ESG integration with the benefits of broad diversification and market capitalization weighting. Each has its own process, and each of these processes results in different levels of active risk relative to their parent index. Investors in the funds that track these benchmarks are faced with a trade-off between the degree of ESG integration they prefer, and how far from the broad market portfolio they're willing to stray.
Reading the Label
MSCI has numerous ESG index offerings. Here, we’ll focus on three ESG variants of the broad, market-cap-weighted MSCI USA index: the MSCI USA ESG Focus, MSCI USA ESG Select, and MSCI USA ESG Leaders indexes (hereafter referred to as the Focus, Select and Leaders series). These three benchmarks underpin five different Morningstar Medalist funds. Exhibit 1 lays out the basics of each index series’ methodology.
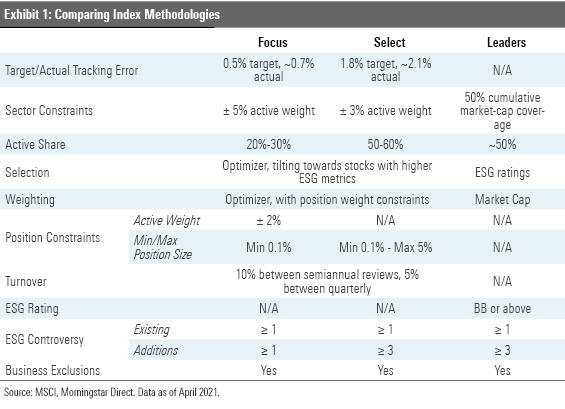
Tracking Error It's difficult to ignore the elephant in the room when it comes to ESG mandates: the ambiguity of their impact on performance. Introducing a tracking error target is one of the ways ESG index providers have sought to address this. Many ESG indexes are tethered to their parent index, but to varying degrees. While these ESG indexes will not necessarily out- or underperform their parent index, these anchors ensure that their returns will stay relatively close to those of their ESG-agnostic parent. In the case of the MSCI family of ESG benchmarks, the Focus and Select series employ optimizers that target tracking errors of 0.5% and 1.8%, respectively. Their actual tracking errors have generally been on target over the trailing one-, three-, five- and 10-year periods through April 2021. While the Leader series does not have an explicit tracking error target, its tracking error hovered around 2% over the same periods.
Active Share Another measure of the magnitude of these benchmarks' ESG-driven bets is active share. These indexes' active share relative to their parent index reveals how much of the original opportunity set is cast aside in the process of integrating ESG criteria in the methodology. For example, the Leader series aims to capture 50% of the cumulative market capitalization of each sector. This translates to an active share of approximately 50%-60% against the MSCI USA. While neither has a formal coverage target, the Focus series often ends up with an active share around 20%-30%, while the Select series' active share clocks in around 50%-60%. This can be partly attributed to these indexes' different tracking error targets: The larger the tracking error, the more room for the optimizer to shift positions and weights around. It is also a factor of differences in their sector and single-stock weighting constraints.
Weighting Constraints The Focus and Select series both have active sector weight constraints against the MSCI USA. They differ in magnitude. The Focus series' sector weightings can't stray more than 5% from the parent index and the Select series' no more than 3%. However, as the Focus series also has an active weight constraint on individual positions, its sector-level allocations are rarely more than 2% off from its parent. On the other hand, the Select series has no constraints on individual positions. As a result, its sector deviations have generally been higher than the Focus series, although they've tended to stay below 3%. While there are no explicit relative constraints for the Leaders series, its construction process ensures by principle that its sector allocations will closely mimic those of the MSCI USA. It selects stocks with the highest ESG scores from each sector that represent 50% of the sector's cumulative market cap and weighs them by market cap, similar to its parent index.
ESG Bona Fides These indexes' different degrees of active risk relative to their parent index reflect their different degrees of "ESG-ness." This is reflected in the ESG ratings for the funds that track them. For example, both funds underpinned by the MSCI USA ESG Select and MSCI USA ESG Leaders indexes receive Morningstar Sustainability Ratings of High (five globes) while the fund tracking the MSCI USA Focus Index gets an Above Average (four-globe) rating.
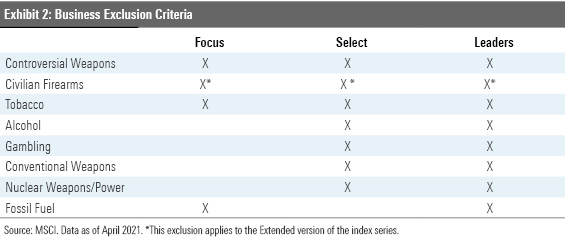
The Morningstar Sustainability rating is a useful summary measure of the financially material ESG risks in a fund relative to its peer group, but it does not capture all the nuance that informs investors’ ESG preferences. For example, investors looking to avoid companies involved in thermal coal mining or unconventional oil and gas extraction will likely prefer funds tracking indexes from the Leaders series, as the Select series does not exclude them. This distinction isn’t reflected in the (identical) Sustainability ratings for the funds underpinned by the MSCI USA ESG Select and MSCI USA ESG Leaders indexes. The Leaders series is the only one of the three that explicitly excludes ESG laggards, as it requires a minimum ESG rating. MSCI also offers an Extended version of these index series, which excludes firms that are producers of or otherwise have links to civilian firearms. This restriction is unique to the Extended version of the Focus series, and the screens are stricter for the Extended Select and Extended Leaders indexes.
Roll Call
Having covered the basics of these indexes’ processes, let’s now take a look at the end products--their portfolios. Exhibit 3 shows the top 10 holdings of these benchmarks’ parent index, the MSCI USA Index and the relative underweight, overweight, or omission across its three ESG variants. As your eyes move from left to right across the columns, you’ll notice that the greater the degree of ESG incorporation, the more the index’s top 10 diverges from the parent.
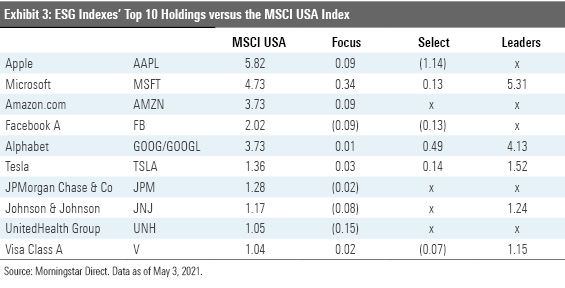
The MSCI USA ESG Leaders index’s 10-largest names stand in the starkest contrast to its parent index, as it frequently excludes positions entirely. Its weighting scheme, combined with these strict ESG exclusions, result in large stakes in many mega-caps that make the ESG cut. Notably, its stake in Microsoft MSFT has tended to claim 7%-10% of the index’s portfolio. The Select series excludes fewer of the largest names and opts to shuffle their weights around instead. Similar to the Leaders series, though not to the same extent, it leans more into Microsoft while steering away from Apple AAPL and Facebook FB. Given the toe-in-the-water approach to ESG integration of the MSCI USA ESG Focus index, it is no surprise that its top holdings closely mimic the MSCI USA index.
Peculiar Names There are some interesting names that have appeared in the MSCI USA ESG Select index's top holdings from time to time. For example, from 2017 to 2020, Ecolab ECL frequently claimed one of the top five spots in this portfolio, despite having a relatively small market capitalization of around $60 billion. To put this in context, Ecolab's market cap has ranged from no. 100 to no. 130 in the MSCI USA index. It doesn't feature nearly as prominently in the Focus index given the index's position weighting constraints, nor does it play a prominent role in the Leaders series given its market-cap-weighting scheme. Lacking both, the optimizer for the Select series is free to push this AAA-rated (MSCI's highest ESG rank) company to the spotlight. While this is all done under a target tracking error constraint, volatility in the portfolio's top holdings can put the index at risk of exceeding its tracking error target over the short term.
To the Scoreboard
These indexes’ performance further corroborates their different degrees of ESG incorporation. Exhibit 4 plots the rolling six-month excess returns of each versus the MSCI USA index.
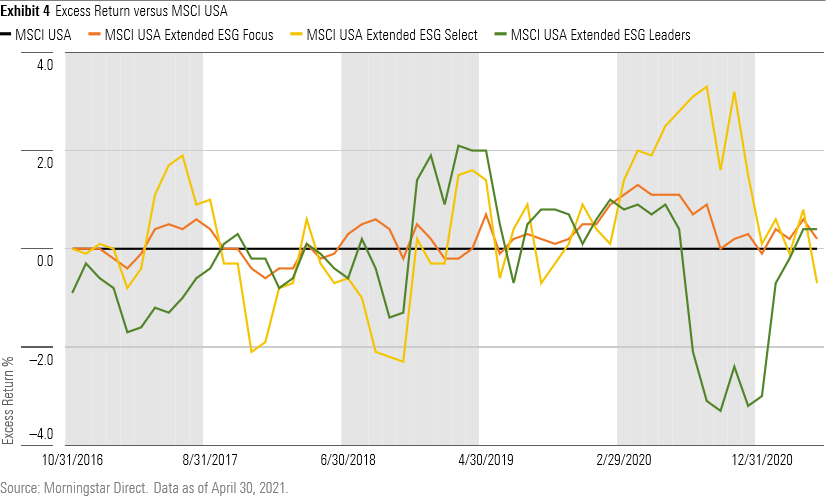
The pattern holds here. The more ESG-focused the index, the more widely its performance has deviated from the parent index. The Focus index has hewed closest to its parent index, rarely straying more than a percentage point from the MSCI USA during any six-month stint. The Leaders and Select series both ranged further from home, but there is no distinct trend of under- or over-performance. Active ESG bets may or may not be rewarded in the short run or the long run. The only guarantee is that these indexes’ risk and return profiles will be varying degrees of different relative to their parent index. Investors are faced with a trade-off between ESG integration and market-like performance.
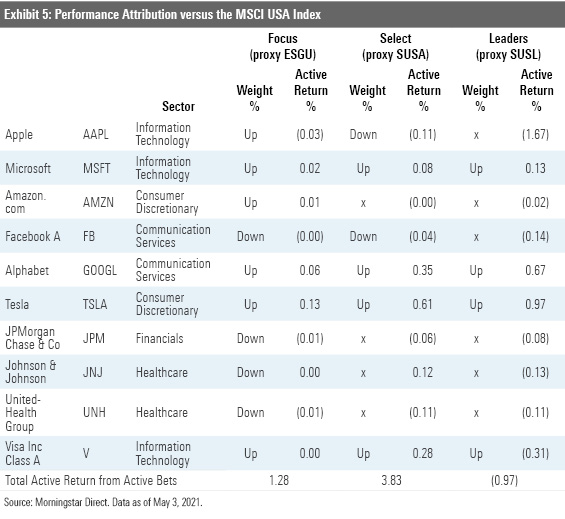
To further illustrate this point, let's take a peek at how the active bets among these indexes' top 10 holdings have played out. Exhibit 5 contains the output of an attribution analysis of the performance of the iShares suite of exchange-traded funds tracking these indexes. As the funds are relatively new, the analysis period spans June 2019 through April 2021. As you can see, excluding or underweighting some of the market's tech darlings has hurt these fund's performance over this period. That said, in sum the funds tied to the Select and Leaders series both got rewarded on ESG-driven overweights, but ultimately there is no guarantee if these ESG bets would lead to over- or underperformance. The Leaders index underperformed the MSCI USA by 97 basis points annually over this period as it missed out on top performers in technology and healthcare--most notably Apple. Meanwhile, the Select index outperformed the MSCI USA Index by 3.83% annualized. Most of this can be attributed to its underweight in energy and financials, as well as ESG-driven stock bets in consumer discretionary names like Tesla TSLA and financials.
What’s in a Name?
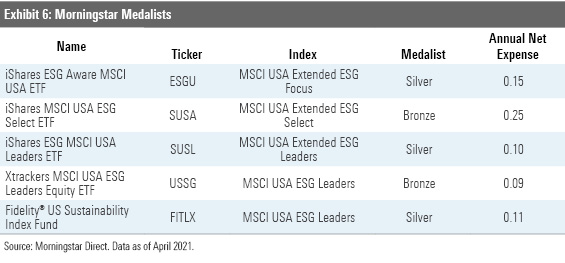
Let’s map these indexes to the Morningstar Medalist funds that track them. To further complicate matters, these funds labels might not match those on their benchmarks. Sometimes they adopt their indexes’ names, sometimes they don’t. Exhibit 6 connects the dots. Each of the five funds featured here is a Morningstar Medalist. Their positive ratings are rooted in the fact that their benchmarks retain many of the benefits of their broad, cap-weighted parent index--broad diversification and low turnover--and acknowledge that their low fees give them a durable advantage over many of their Morningstar Category peers.
Disclosure: Morningstar, Inc. licenses indexes to financial institutions as the tracking indexes for investable products, such as exchange-traded funds, sponsored by the financial institution. The license fee for such use is paid by the sponsoring financial institution based mainly on the total assets of the investable product. Please click here for a list of investable products that track or have tracked a Morningstar index. Morningstar, Inc. does not market, sell, or make any representations regarding the advisability of investing in any investable product that tracks a Morningstar index.
/d10o6nnig0wrdw.cloudfront.net/04-18-2024/t_34ccafe52c7c46979f1073e515ef92d4_name_file_960x540_1600_v4_.jpg)
/d10o6nnig0wrdw.cloudfront.net/04-09-2024/t_e87d9a06e6904d6f97765a0784117913_name_file_960x540_1600_v4_.jpg)
/cloudfront-us-east-1.images.arcpublishing.com/morningstar/T2LGZCEHBZBJJPPKHO7Y4EEKSM.png)
:quality(80)/s3.amazonaws.com/arc-authors/morningstar/c00554e5-8c4c-4ca5-afc8-d2630eab0b0a.jpg)