
Why It Pays to Diversify by Investment Style
Different styles all have high correlations with the overall market, but that doesn't translate into identical returns.
/s3.amazonaws.com/arc-authors/morningstar/e6b4cff4-0d77-4881-abc5-5b0b34d64bf6.jpg)
In our recent examination of asset-class correlations, the "2021 Diversification Landscape," we found that correlations for the nine squares of the Morningstar Style Box versus the broader equity market are all relatively high, but there's still a case for diversifying by investment style.
U.S. equity exposure can be broadly segmented by market capitalization (small, mid, and large) and style (value versus growth), as represented by the style box. Correlations within U.S. equity groups tend to be fairly high, although small-cap stocks tend to have the lowest correlations with the broad market.
The resulting nine boxes go from the relative extremes of large growth to small value. The divergence between these two portions of the style box shows the long-running gap in returns between value and growth on the one hand and large- and small-cap stocks on the other. The Morningstar US Large Cap Broad Growth Index gained 16.6% annualized over the 10 years through February 2021, 7.5 percentage points better than the Morningstar US Small Value Index, which had the lowest returns of the nine equity boxes.
2020 Correlations for the Morningstar Style Box
What was most striking during 2020's first-quarter bear market was the combination of high correlations across the board with the broad Morningstar US Market Index and the massive divergence in actual returns. The Morningstar US Large Cap Broad Growth Index fared best in relative terms, dropping 30.4%.
This was more than 17 percentage points better than the Morningstar US Small Value Index's 47.7% plummet. Even within small-cap land, growth stocks were more than 12 percentage points better than value during the brief bear market. The take-home point is that high correlation is not equivalence when it comes to returns.
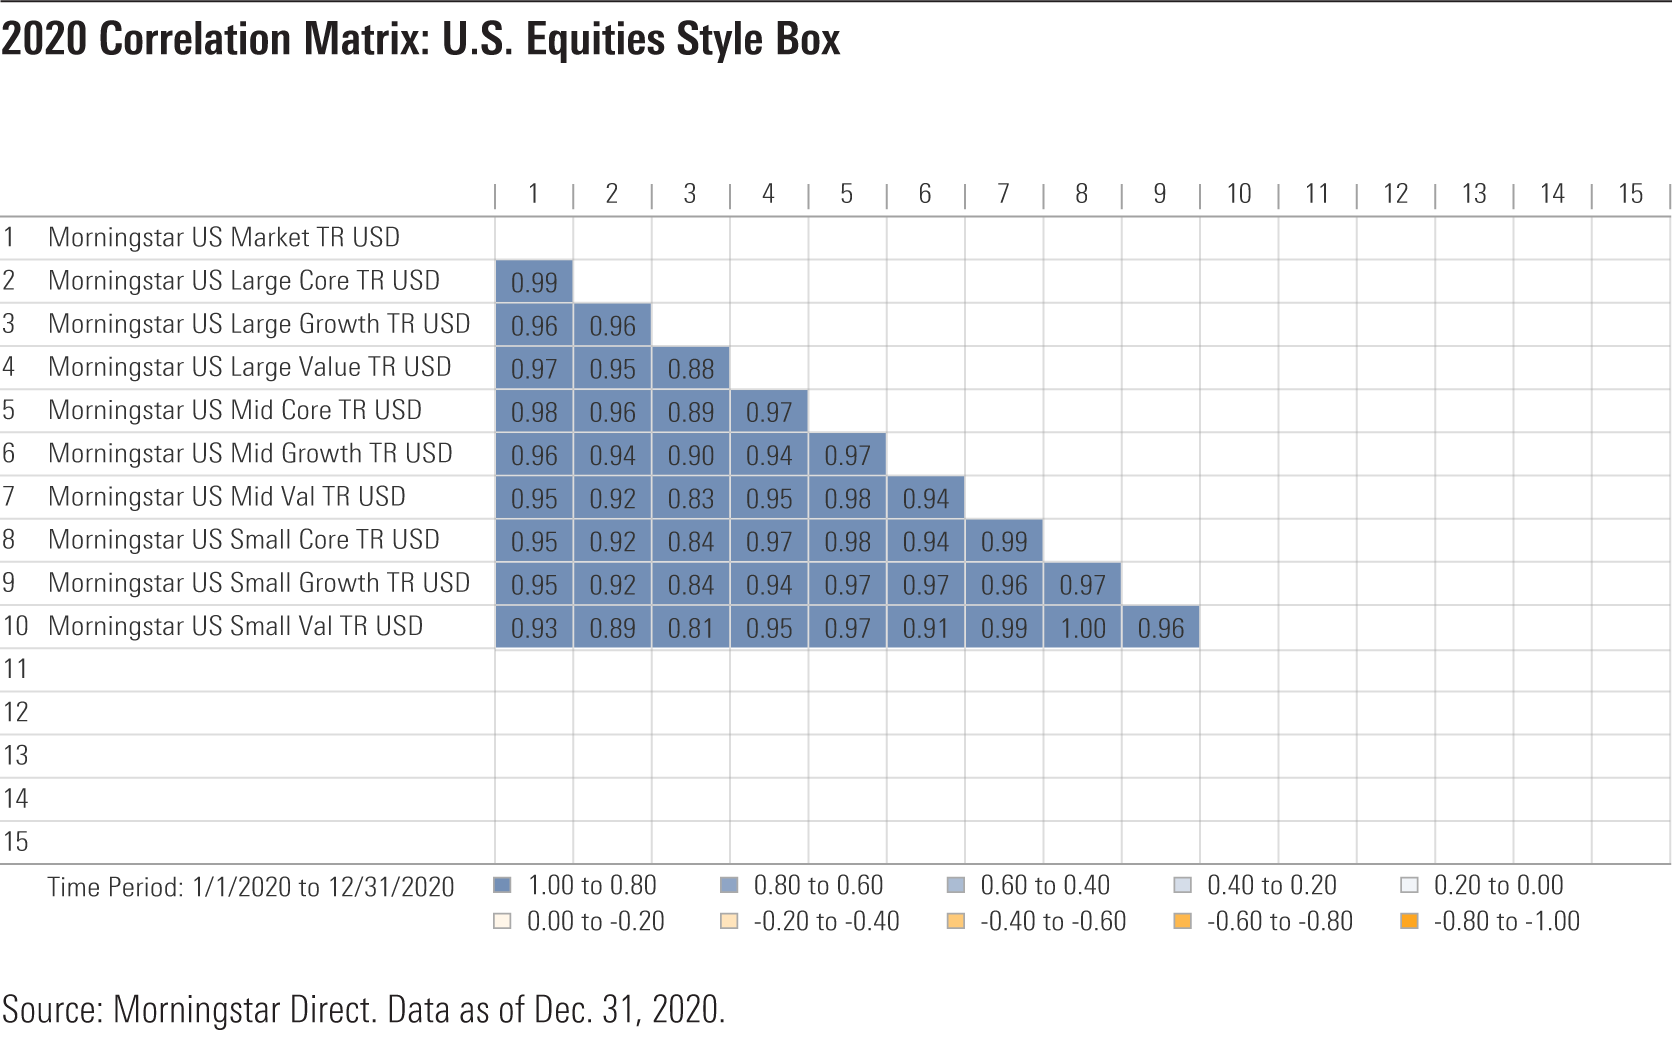
When looking at cross-correlations for all of 2020, another paradox emerges. While all nine style boxes showed fairly high correlations with the Morningstar US Market Index (small value was the lowest at 0.93), correlations between individual style boxes were sometimes much lower. Again, large growth and small value provide the best juxtaposition. In calendar-year 2020, the Morningstar US Large Growth and Morningstar US Small Value indexes had a correlation of just 0.81. This is still pretty high in absolute terms, but it is a lot lower than either's correlation with the broad US market.
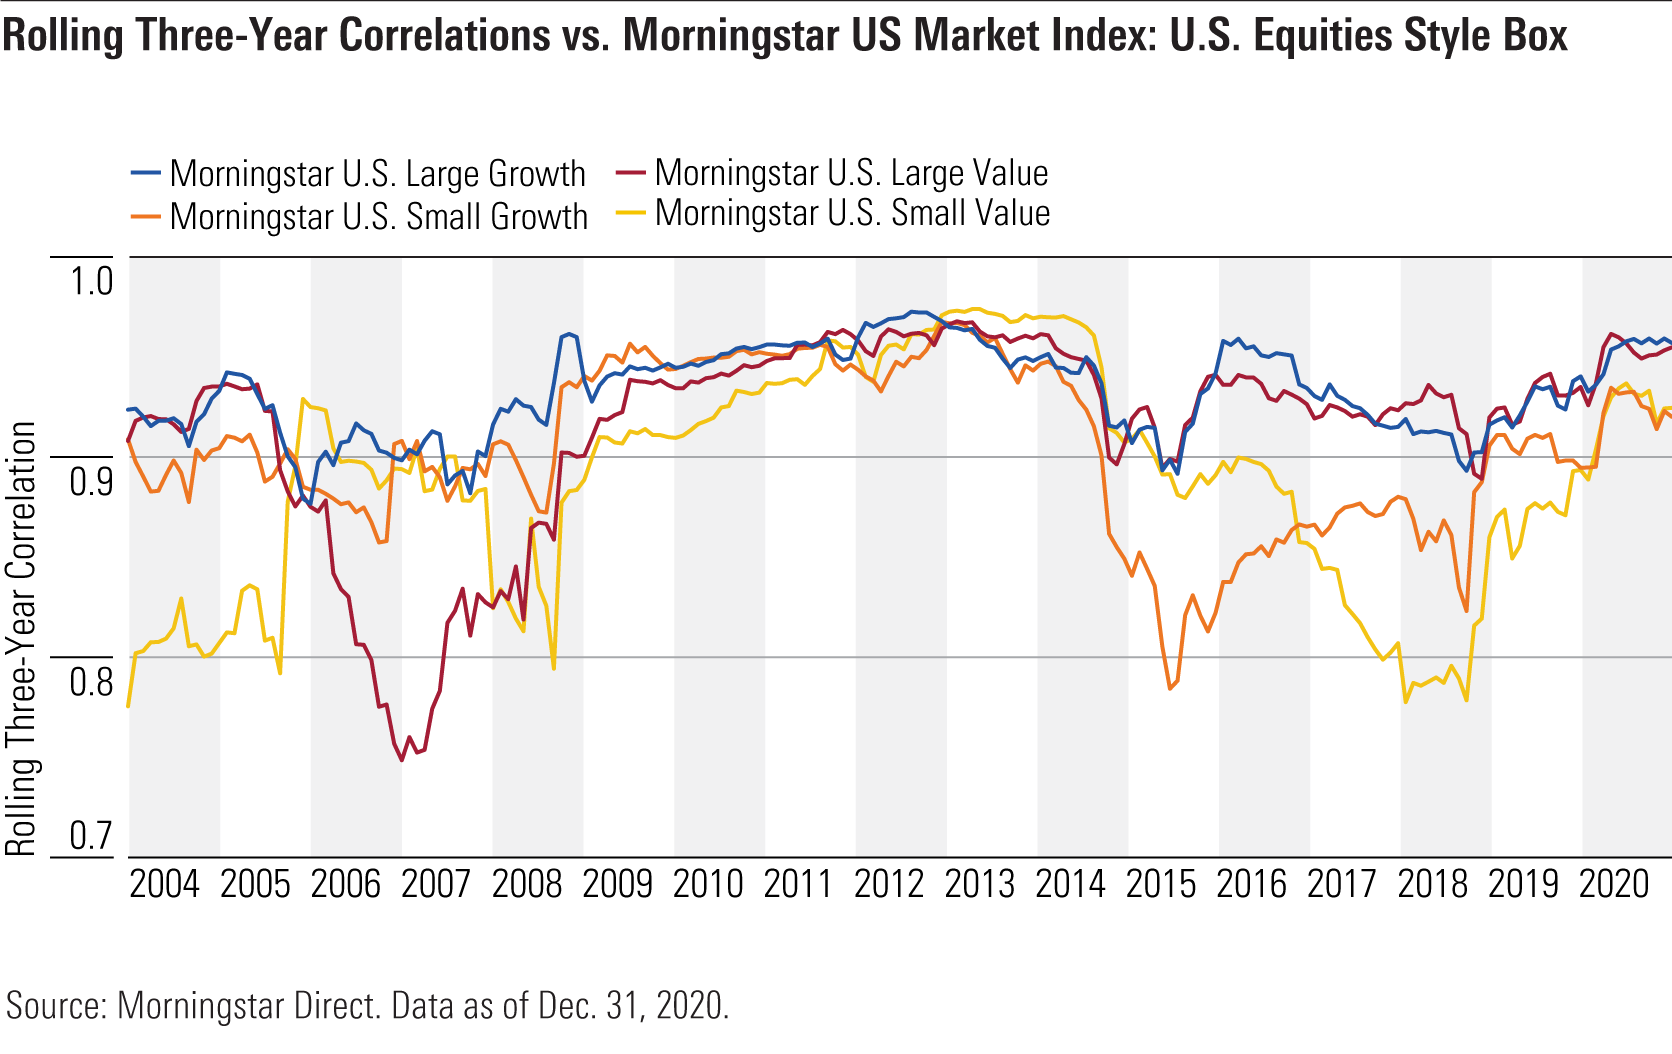
Longer-Term Correlation Trends
The only divergence from the current trends came in 2015-18 when small-cap stocks decoupled from the Morningstar US Market Index to the greatest degree. From October 2015 to September 2018, the Morningstar US Small Value Index's correlation fell to 0.78. The Morningstar US Small Growth Index fell to 0.82 during the same period.
Portfolio Implications
These results reinforce the importance of broad diversification. While all nine style boxes tended to have high correlations with the Morningstar US Market Index, there was marked divergence in returns across the group. So, not surprisingly, in order to get the market return, one needs to own the market. For instance, one would have paid a high price--during both rallies and down markets--for overweighting value at the expense of growth.
By the same token, one might pay a similar penalty for overweighting growth relative to value going forward. Indeed, value stocks fared far better than growth during 2020's fourth quarter and 2021's first quarter. While value stocks have historically outperformed during economic recoveries, time will tell whether this is a long-term shift in market leadership.
Furthermore, anyone who owns a dedicated large-growth fund has likely enjoyed fantastic gains. But after years of outperformance, such investors may want to diversify their exposure by either trimming their position or by adding a small-value position as a complement.
:quality(80)/cloudfront-us-east-1.images.arcpublishing.com/morningstar/EGA35LGTJFBVTDK3OCMQCHW7XQ.png)
:quality(80)/cloudfront-us-east-1.images.arcpublishing.com/morningstar/LUIUEVKYO2PKAIBSSAUSBVZXHI.png)
:quality(80)/cloudfront-us-east-1.images.arcpublishing.com/morningstar/GQNJPRNPINBIJGIQBSKECS3VNQ.jpg)