
What This Year's Top-Performing Funds Own
Stock holdings favored by 2021's top-performing active funds are dramatically different from last year's.
/s3.amazonaws.com/arc-authors/morningstar/360a595b-3706-41f3-862d-b9d4d069160e.jpg)
For a while, it seemed like there was a simple formula for chart-topping returns: Load up on the large, growth-oriented stocks that dominated the market for most of the past five years. The so-called FAANG stocks--Facebook FB, Amazon.com AMZN, Apple AAPL, Netflix NFLX, and Alphabet GOOG--consumed more and more of broad market benchmarks such as the Morningstar U.S. Market index. Such stocks now make up a combined 18% of the index, and accounted for about half of the benchmark’s 20.9% total return in 2020. Companies lauded for their ability to create or disrupt entire industries, such as Tesla TSLA, posted even bigger gains.
Even the market downturn in early 2020 didn’t significantly change these overall trends. While the overall market dropped 34.5% between Feb. 19 and March 23, 2020, there was a sharp divergence in performance for different investment styles. Morningstar’s Large Growth index was down about 30.9%, compared with a 47.7% loss for the Small Value index. Technology stocks also were relatively unscathed by the market downturn, while more economically sensitive areas suffered sharp losses thanks to fears about the potential economic impact of the global coronavirus pandemic.
More recently, though, the tables have turned dramatically. In this article, I’ll look at the underlying holdings favored by the top-performing actively managed funds for the first four months of 2021 compared with 2020.
Comparing the Sector Bets
To start, my colleague Katherine Lynch and I screened for the 25 top-performing actively managed U.S. equity funds in 2020, as well as for the first four months of 2021. There was no overlap in the top performers between the two years--a reflection of the change in market leadership between the two periods.
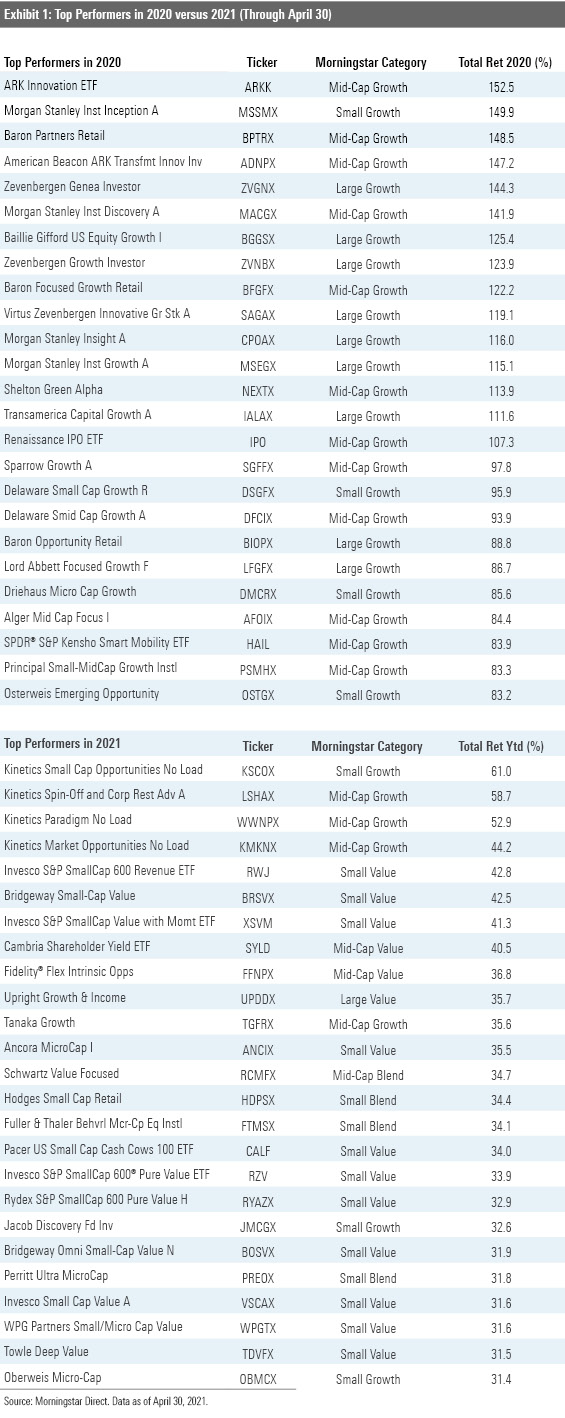
We then set up an equally weighted portfolio of the funds on each list and drilled down to look at the underlying holdings held in the combined portfolios. (Holdings data is based on the most recent portfolio available for each fund.)
As the charts below illustrate, sector exposure looks dramatically different for the two periods. The top performers in 2020 made large bets on technology, healthcare, consumer cyclicals, and communication services, while going light on financials, basic materials, industrials, and energy stocks. This sector profile meshed perfectly with 2020’s market environment; in fact, technology and consumer cyclicals were the top-performing sectors in 2020, while the winning funds had little exposure to lagging areas like energy, real estate, and utilities.
Exhibit 2
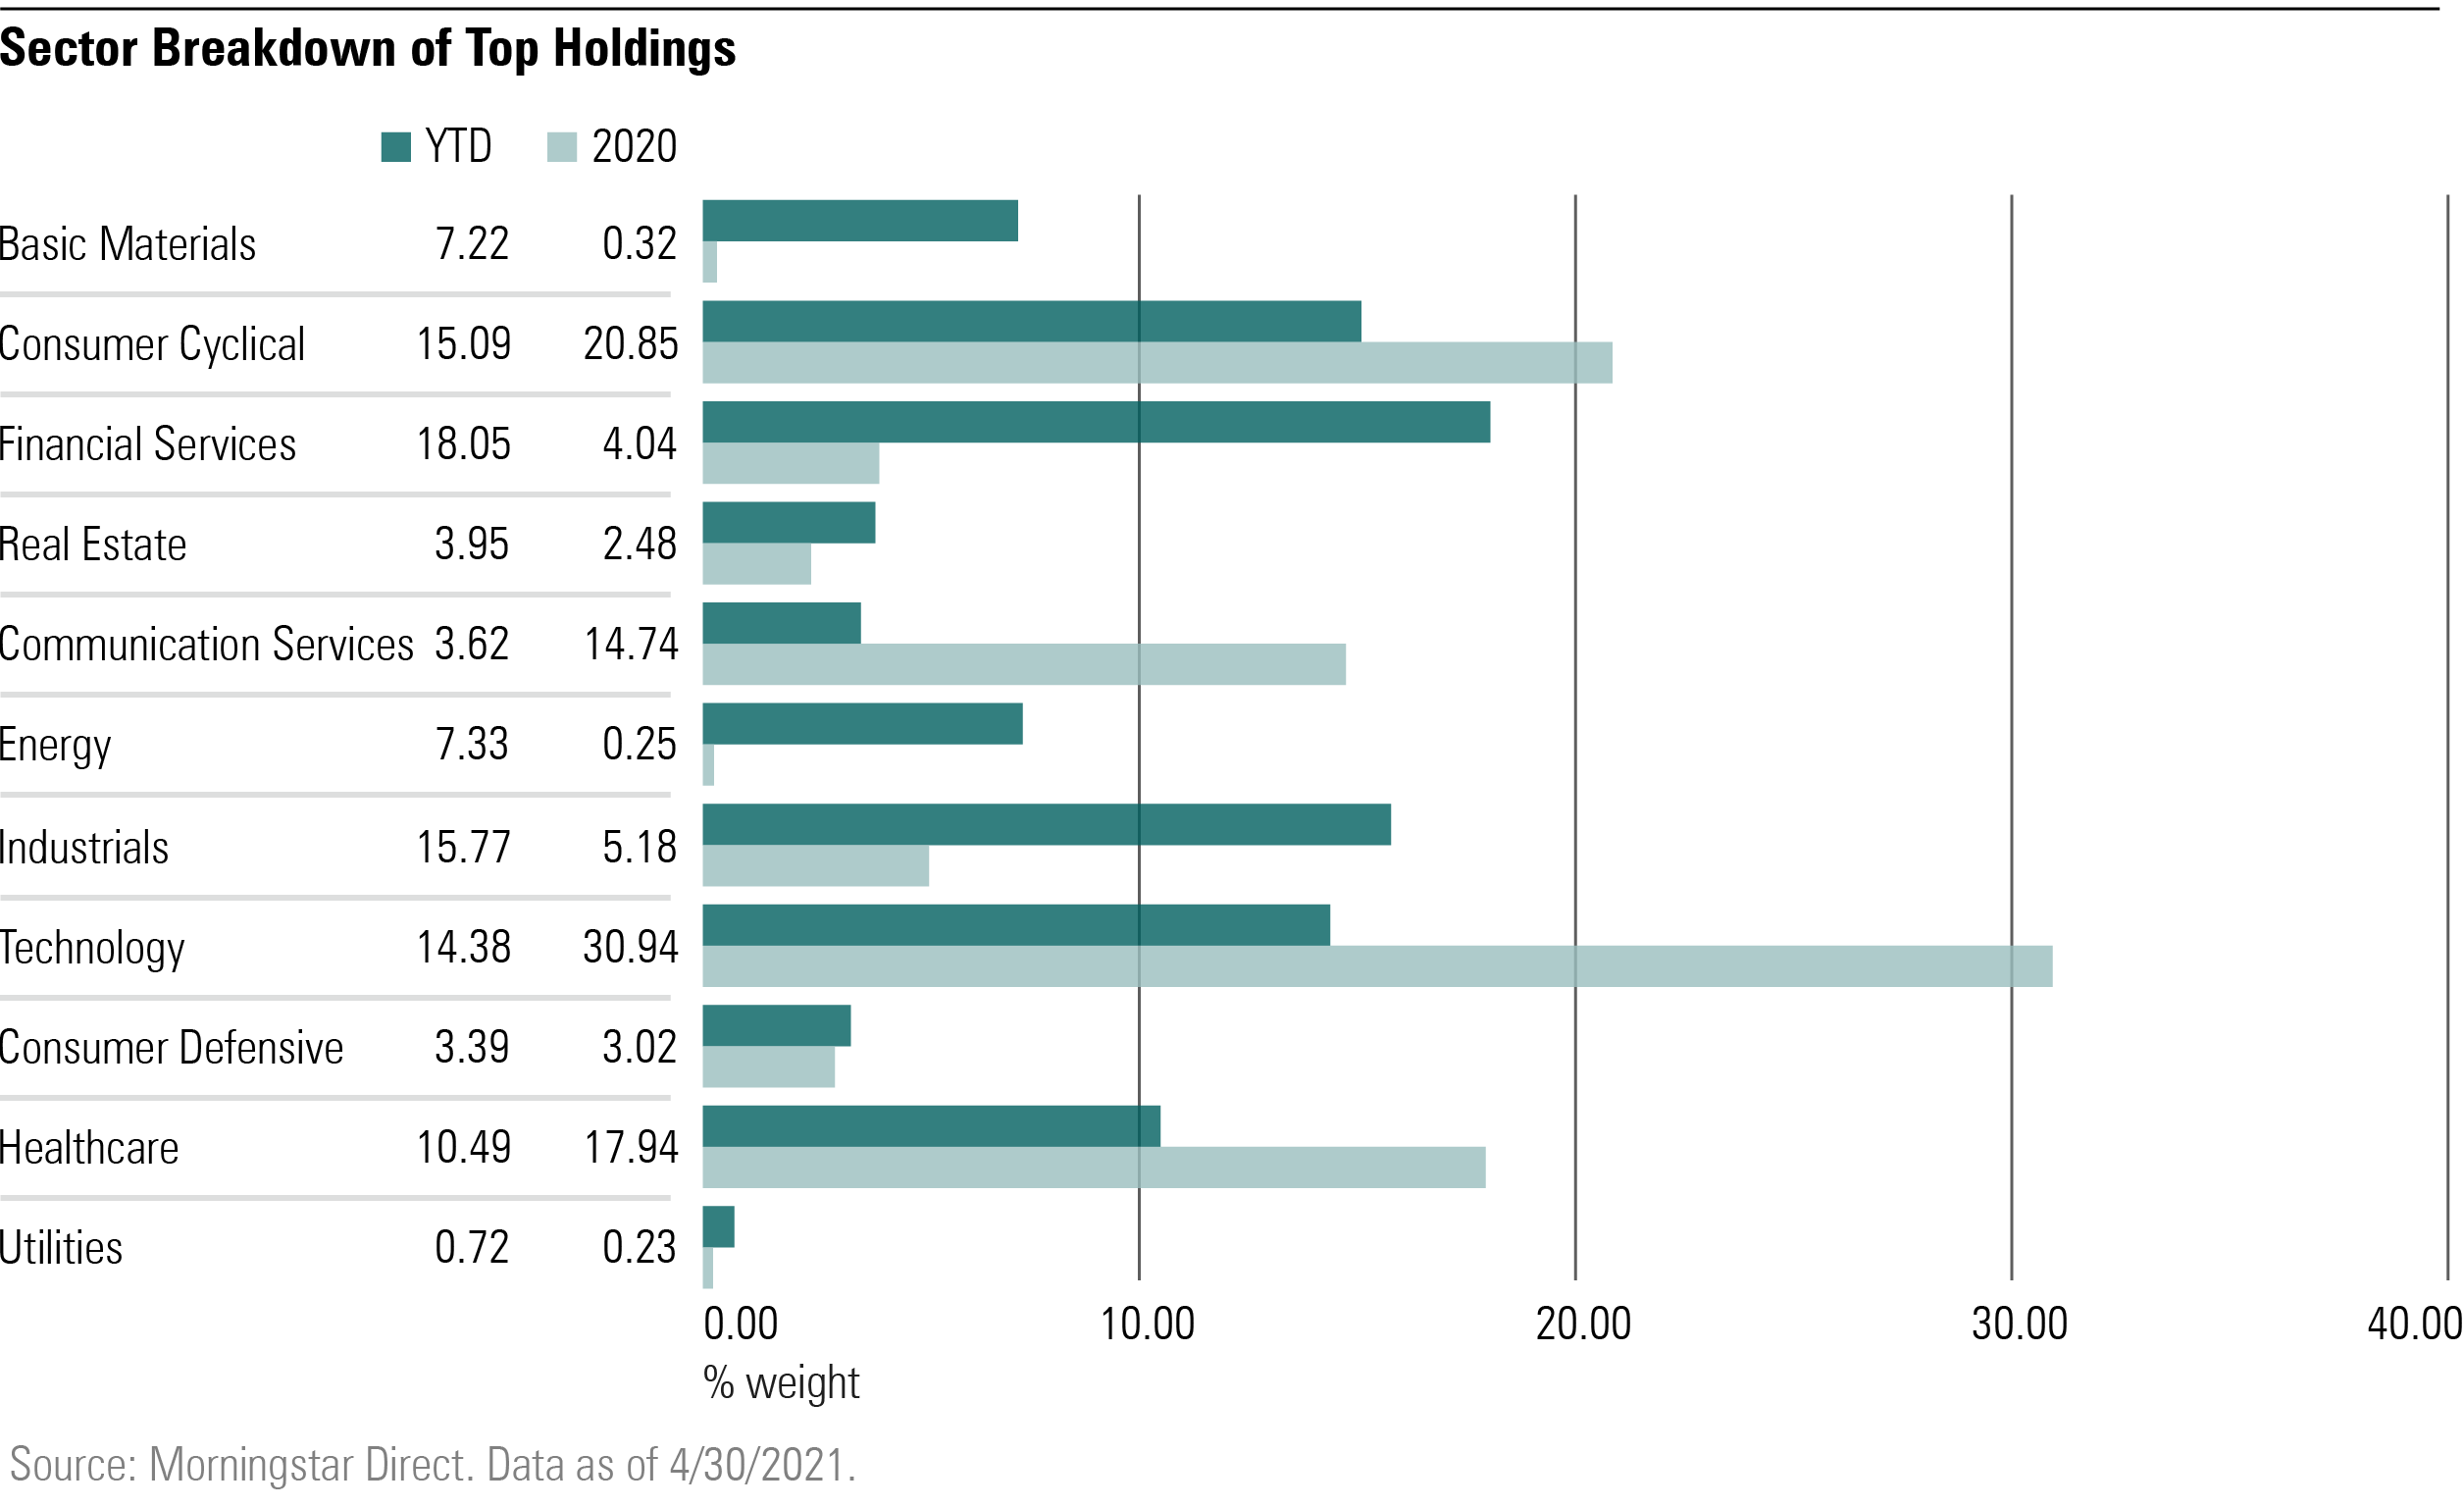
The winning funds so far this year, by contrast, underweighted technology stocks while making bigger bets on financial services, industrials, basic materials, and energy stocks. All of these areas have bounced back as interest rates have edged up, commodity prices have recovered, and consensus has been building for a robust economic recovery.
Style Box and Portfolio Statistics
There ’s also a dramatic difference between investment styles and portfolio statistics when comparing the two lists. As shown in the chart below, growth stock holdings dominated the portfolios for the 2020 winners, accounting for about 78% of the combined portfolio. The top-performing actively managed funds in 2020 also favored large-cap stocks, with an average market cap of $25.1 billion. Because of the high growth expectations built into their prices, the favorite stocks also sport price/earnings, price/book, price/sales, and price/cash flow ratios well above those of the market benchmark. Because many of these holdings are newer companies not yet generating earnings, their profitability levels are below those of the benchmark.
About one third of the holdings in the combined portfolio land in Morningstar ’s speculative growth stock type, which includes companies with revenue growth rates of at least 25% per year over the past two years that may not yet be compounding earnings at the same rate.
Exhibit 3
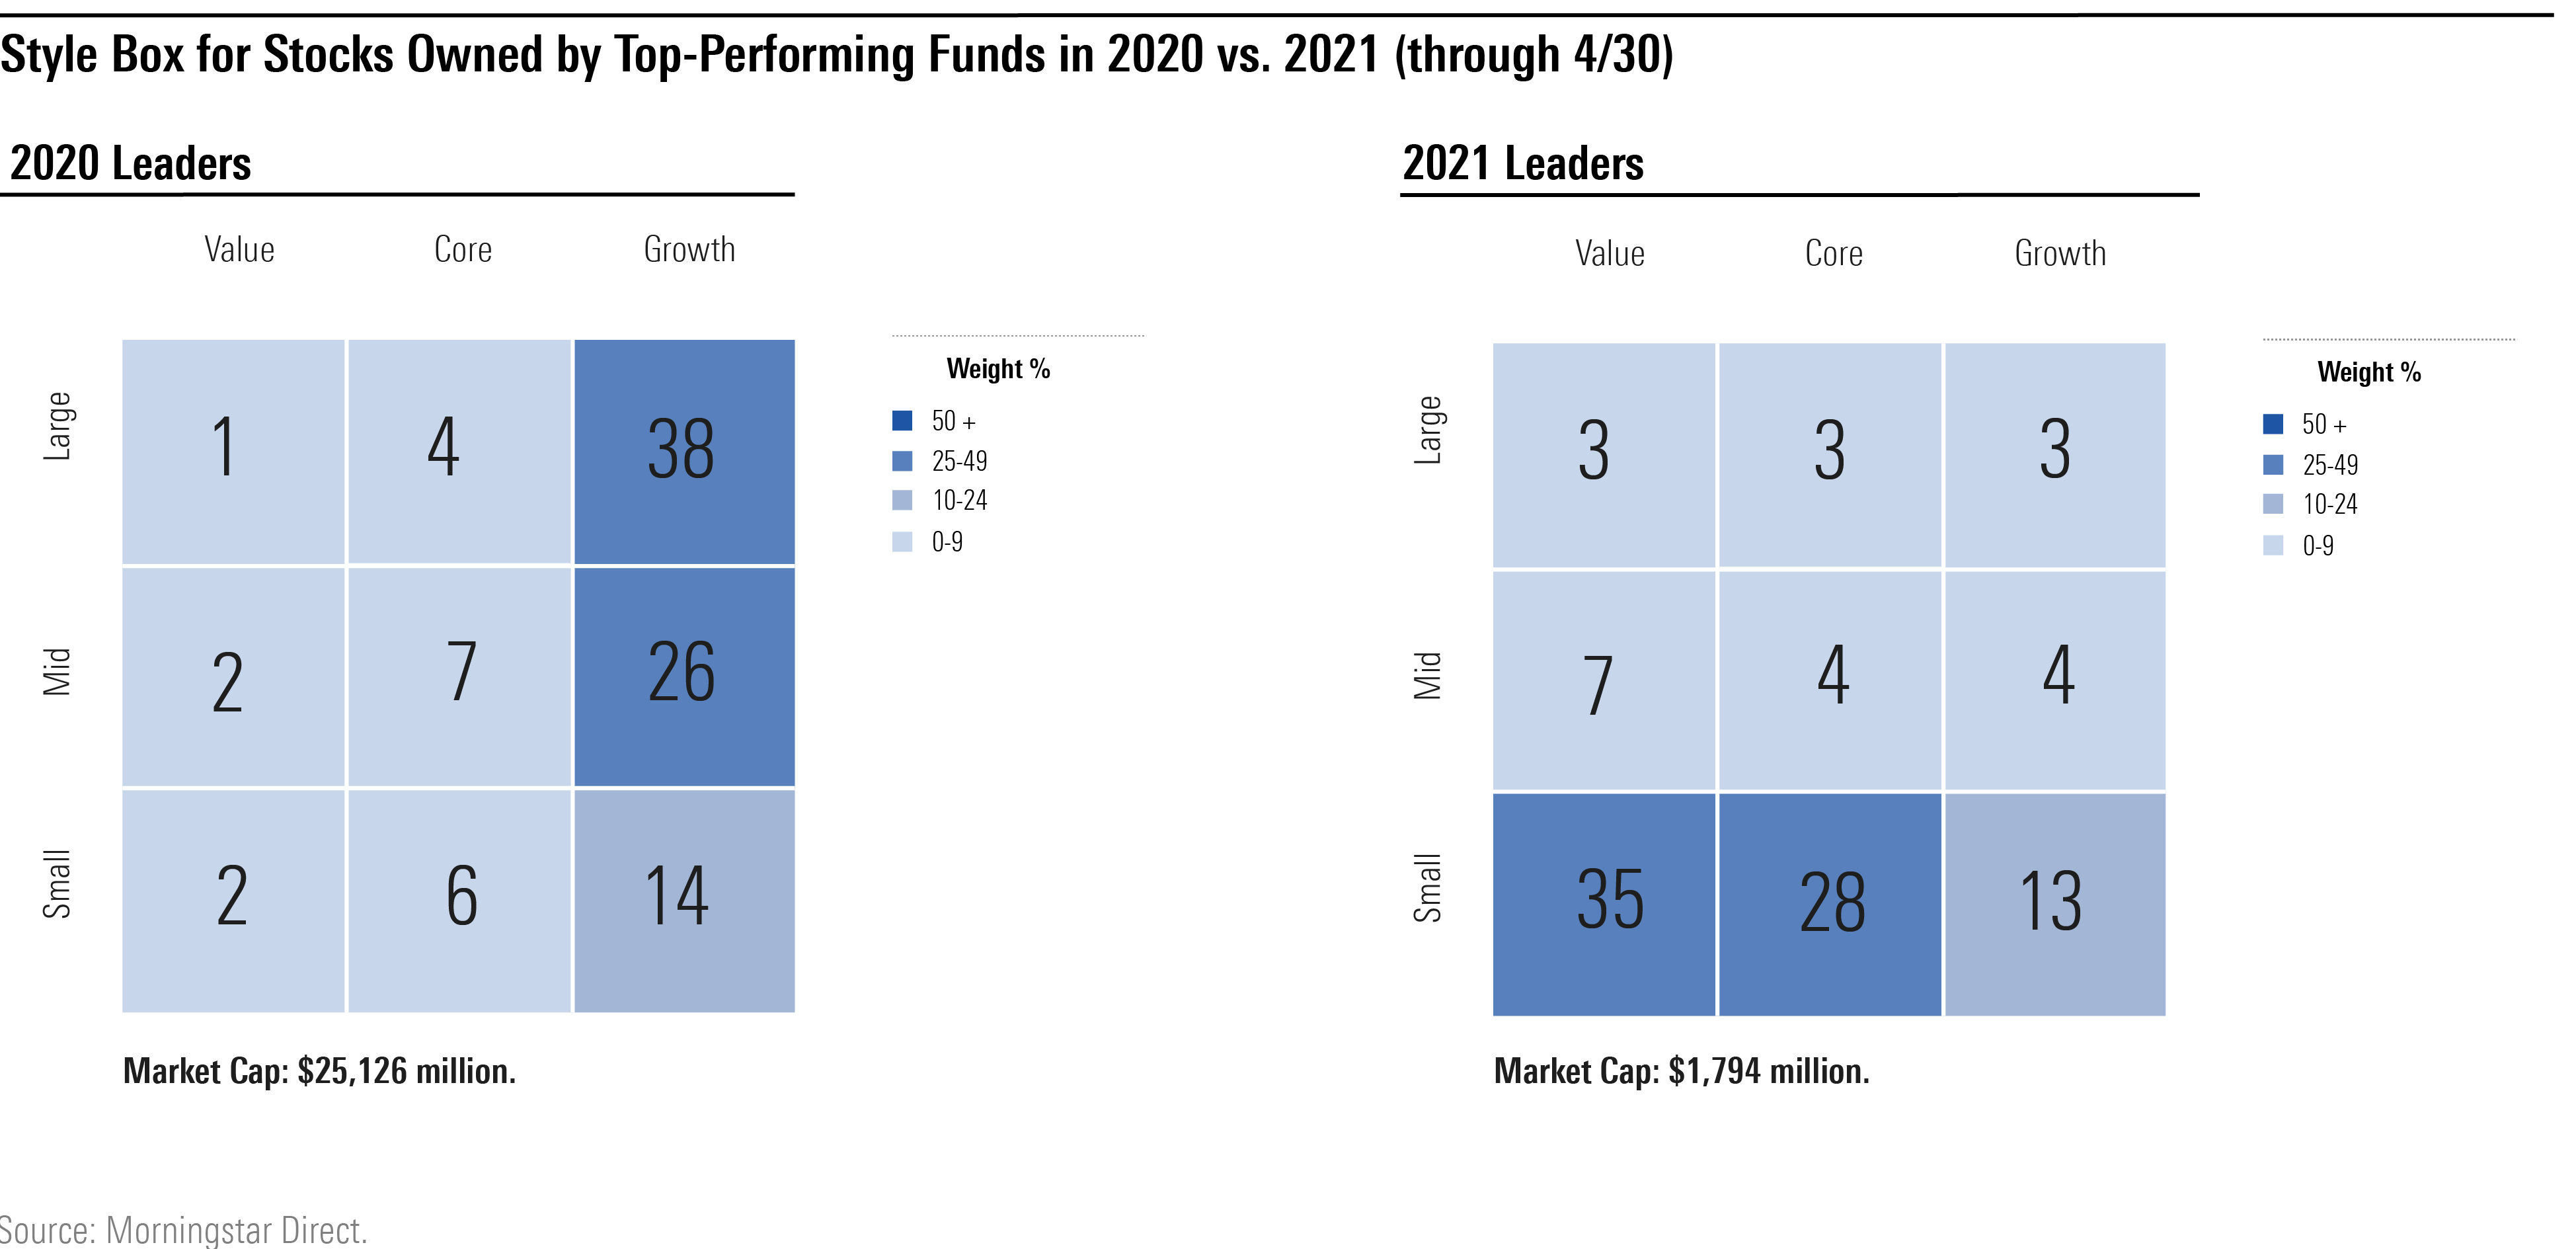
The top-performing funds for early 2021 show dramatically different characteristics, with a significantly smaller market capitalization being the dominant trait. About 76% of assets for the combined portfolio land in the small-cap range, and the average market capitalization is just $1.8 billion--far smaller than the $25.1 billion average for 2020 ’s top performers.
This year’s winners also sport significantly lower price multiples, with an average price/earnings ratio of 12.97, compared with about 44 for last year’s winning list. This also illustrates the dramatic change in market fortunes, as smaller, cheaper stocks have enjoyed a strong resurgence after lagging by a wide margin over the trailing 10 years ended in 2020.
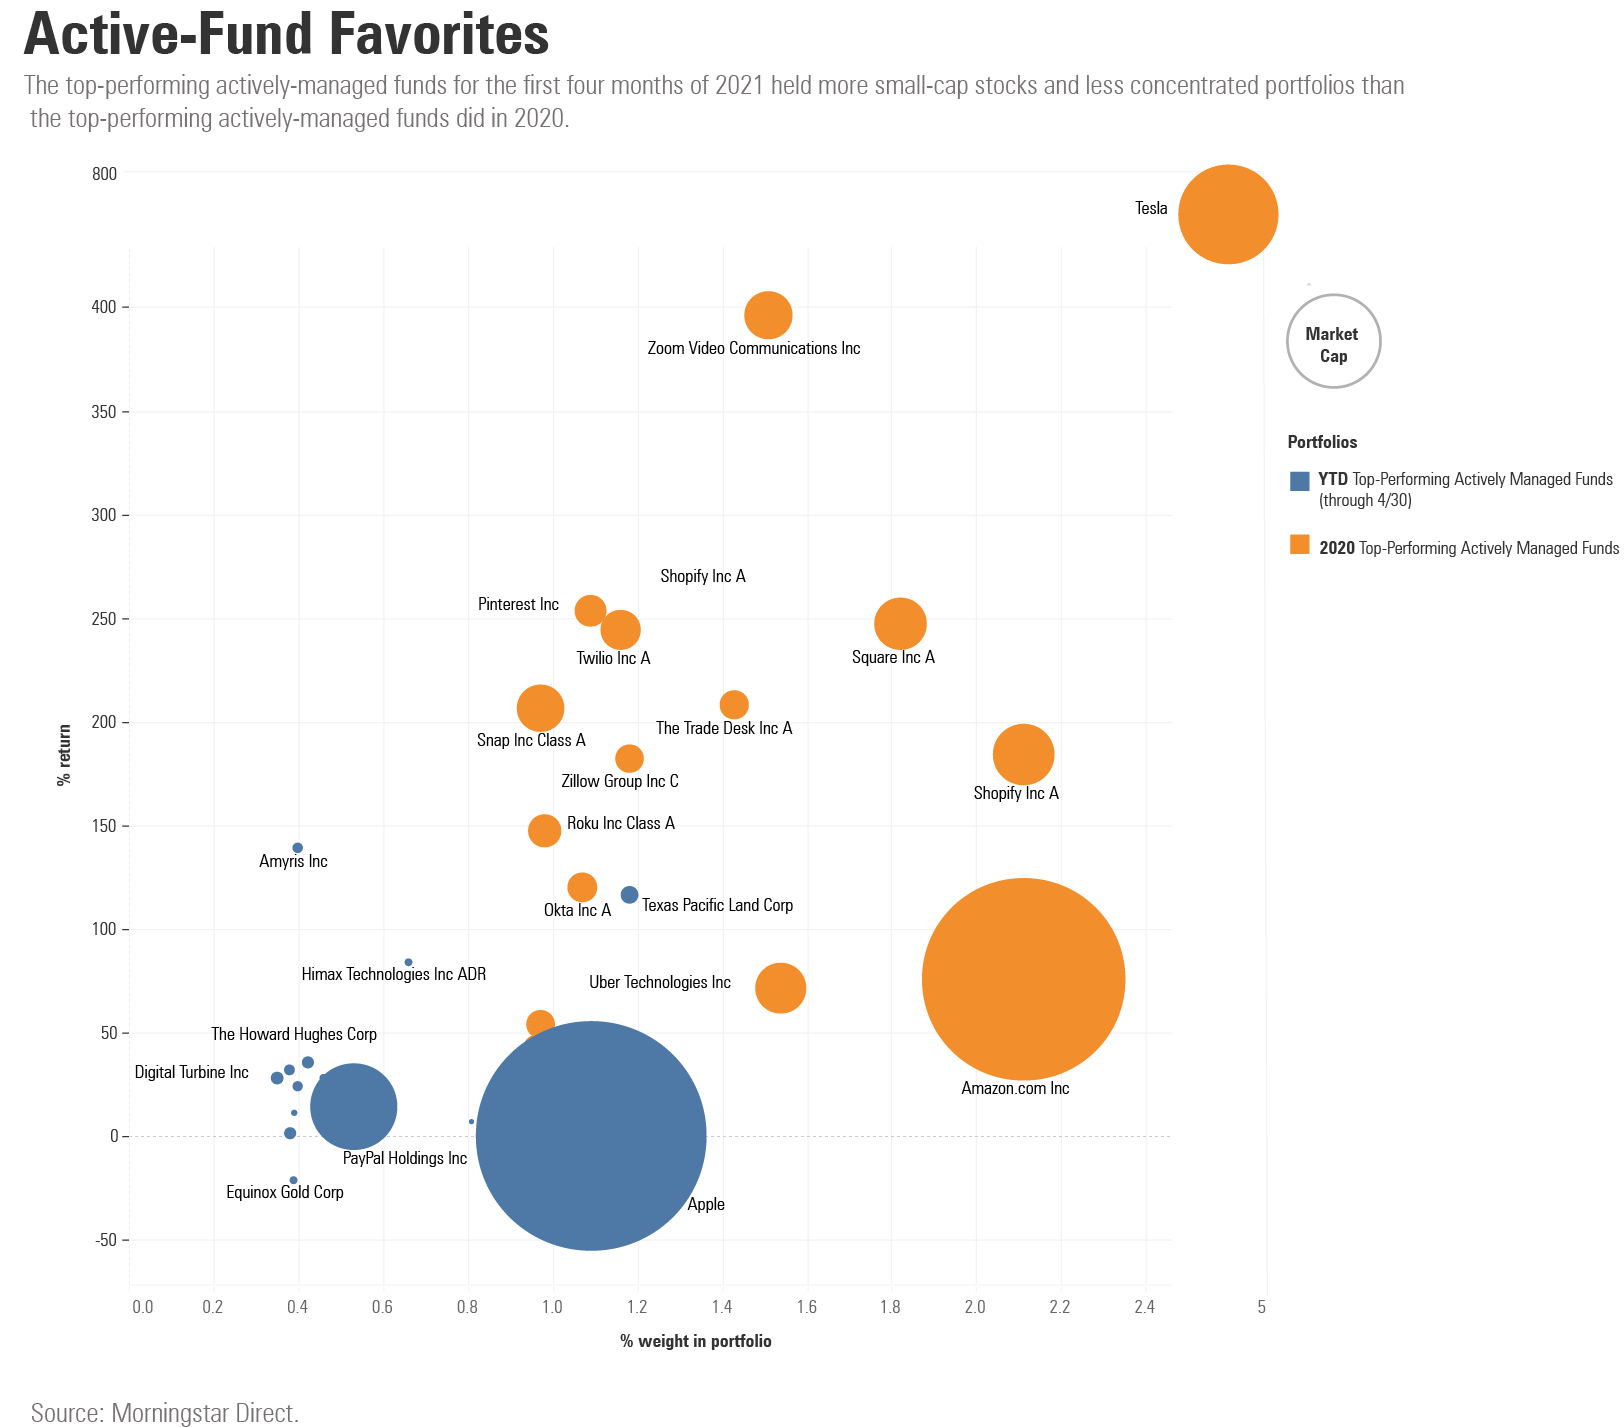
Comparing the Top Holdings: 2020 versus 2021 (Through April 30)
The 2020 list is chock-full of companies that have racked up high growth in sales and earnings as well as significant stock-price momentum. All the companies on the list are either direct or indirect technology plays. The top-performing active funds in 2020 rose to the top of the list partly by significantly overweighting Tesla, which skyrocketed by more than 700% thanks to its robust sales growth and aggressive strategy. (The combined portfolio ’s large weighting in Tesla also reflects the stock’s strong performance, but any funds who rode the stock as it shot up and didn’t sell shares continued making an active bet on the company by remaining overweighted relative to the benchmark.)
Zoom Video Communications ZM, which was a direct beneficiary of the COVID-19-driven surge in working from home, was another major contributor to returns for the top-performing funds. Overall, the top 10 holdings combined account for close to 20% of the equally weighted portfolio ’s assets.
Exhibit 4
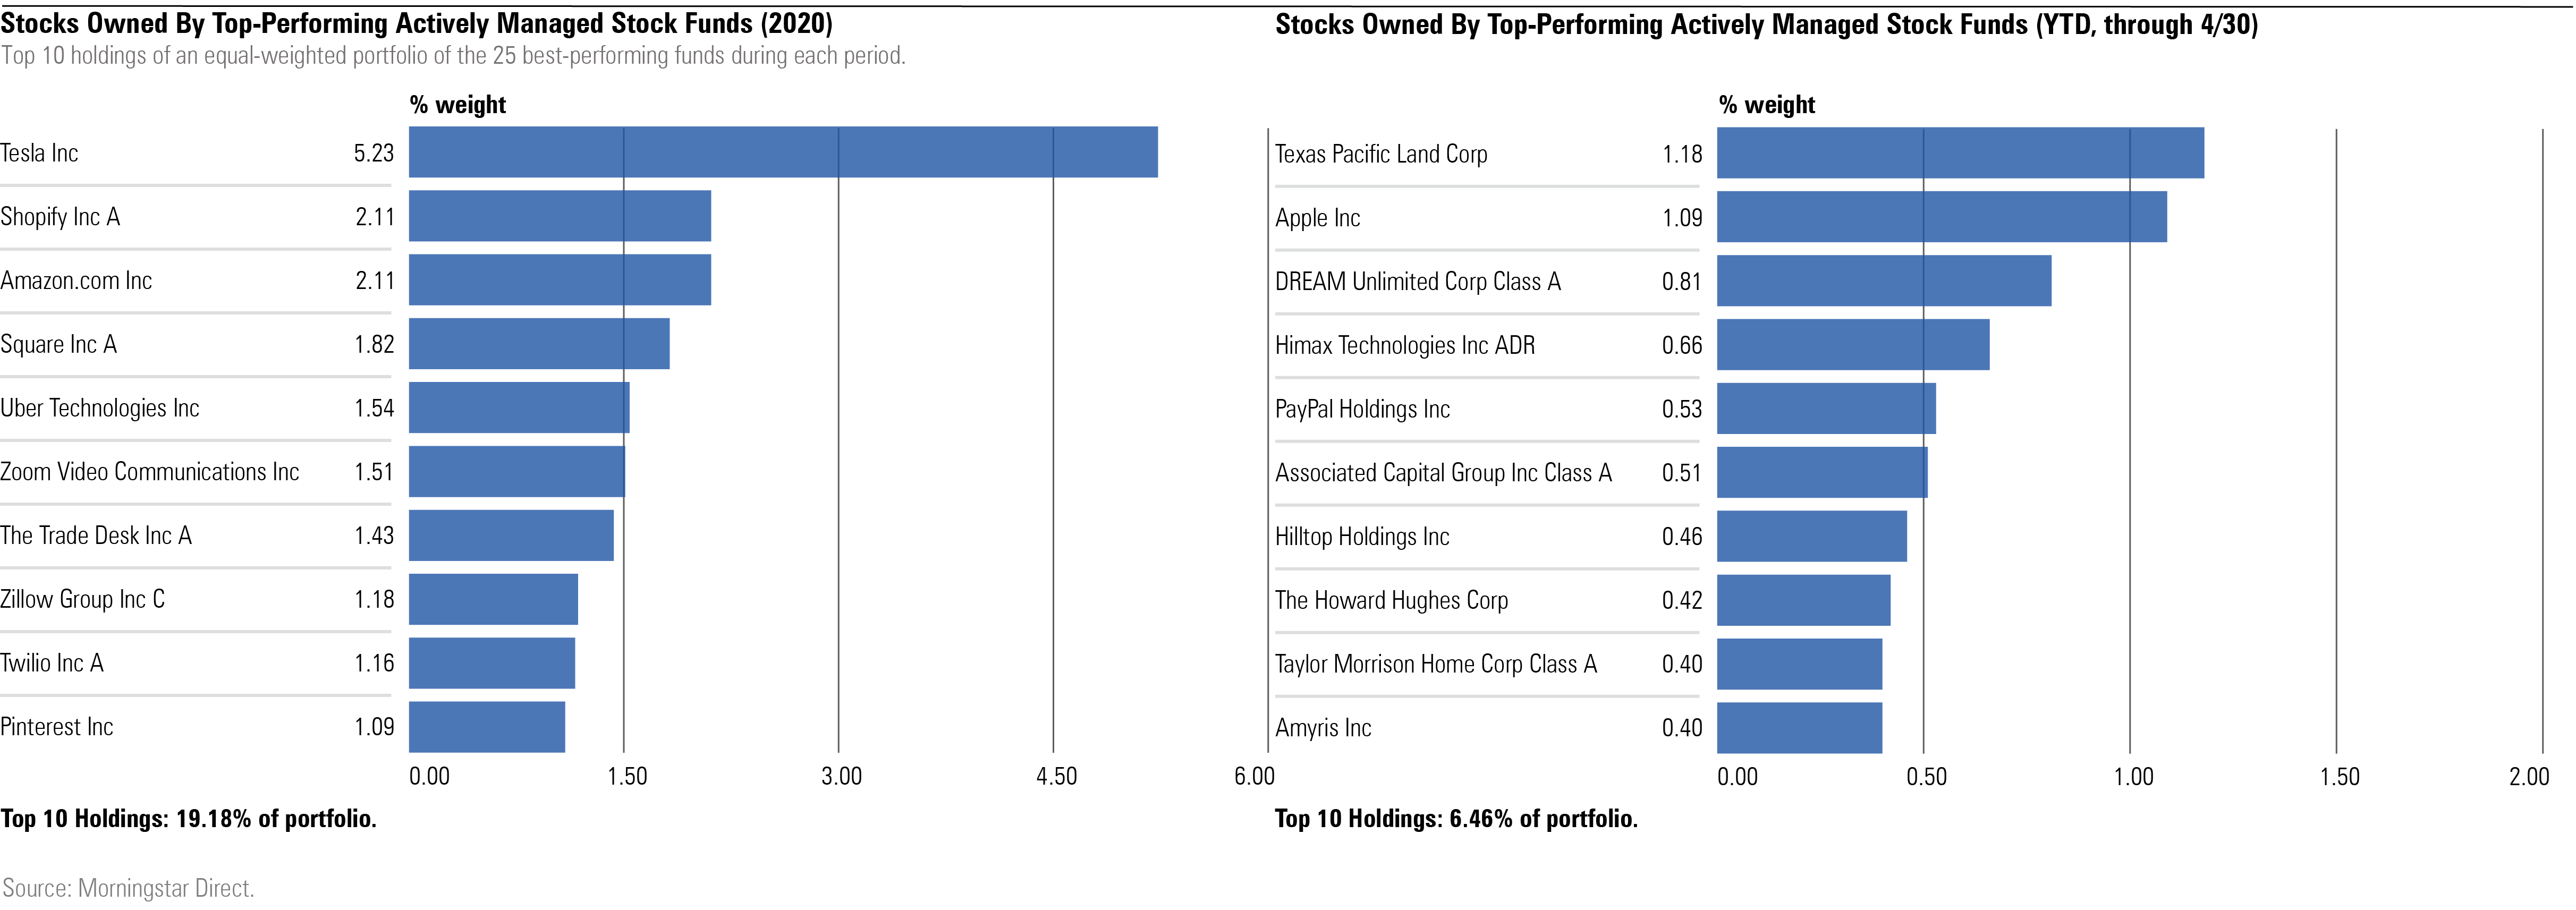
The 2021 list of top holdings shows how dramatically market fortunes have changed. None of the names overlap with those in the 2020 list, and there's also little overlap with the market benchmark. Instead of large, well-known technology stocks, the list mostly consists of more obscure stocks, including Canadian real estate firm Dream Unlimited DRM and Amyris AMRS, which makes health and wellness-oriented food, nutraceuticals, and cosmetic products. Many of the most popular holdings are cyclical issues, hard assets, or even distressed names that should benefit from a robust economic recovery. There ’s also much less overlap in the top names; the top 10 holdings only account for 6.5% of the combined portfolio.
The graph below shows another perspective on how underlying holdings have changed for top-performing actively managed funds. In 2020, the leading funds made large bets on tech-oriented large-cap stocks. In 2021, in contrast, Apple was the only tech stock among the top 10 list of combined holdings. Although it ranks as the second-largest holding in the combined portfolio, it ’s actually underweighted relative to the Morningstar U.S. Market index, where Apple made up about 5% of assets as of April 30.
Exhibit 5
Conclusion
The dramatic shift in fund performance--as well as the makeup of winning funds’ favorite holdings--underscores the importance of portfolio diversification by size and investment style. The change also highlights the pronounced shift in market leadership over the past few months. Because market trends don’t last forever, it’s prudent to avoid being overly concentrated in any specific area.
Katherine Lynch contributed to this article.
/cloudfront-us-east-1.images.arcpublishing.com/morningstar/ZKOY2ZAHLJVJJMCLXHIVFME56M.jpg)
/cloudfront-us-east-1.images.arcpublishing.com/morningstar/IGTBIPRO7NEEVJCDNBPNUYEKEY.png)
/cloudfront-us-east-1.images.arcpublishing.com/morningstar/HDPMMDGUA5CUHI254MRUHYEFWU.png)
:quality(80)/s3.amazonaws.com/arc-authors/morningstar/360a595b-3706-41f3-862d-b9d4d069160e.jpg)