
Digging into Oakmark Fund's Portfolio
The fund is a stalwart exemplar of patient, value-driven management.
/s3.amazonaws.com/arc-authors/morningstar/360a595b-3706-41f3-862d-b9d4d069160e.jpg)
Oakmark OAKMX has long exemplified a patient, bottom-up approach to value investing. Manager Bill Nygren has been at the helm since March 2000 and now comanages the fund with Kevin Grant, who joined parent company Harris Associates in 1988, and Michael Nicolas, who was an analyst at the firm before becoming a comanager in January 2020. The team works closely with a 14-person research team that creates an approved list of ideas for managers to draw from.
Nygren and his colleagues look for stocks that are trading at discounts to their estimated private-market values, which they calculate using a variety of metrics, including discounted cash flow analysis and many other factors. They also look for companies with substantial free cash flows, predictable earnings, and management that demonstrates an ownership mindset. To get these attributes at a discount to intrinsic value, the team often looks for companies they believe are misunderstood because of short-term problems or other investors’ failure to grasp their earnings potential.
The resulting portfolio has a pronounced value bent, but the underlying holdings also score higher than average on growth metrics such as historical earnings, sales growth, and cash flow growth relative to its typical peer in the large value Morningstar Category.
In this article, I'll use Morningstar's Global Equity Risk Model to analyze the underlying characteristics of Oakmark’s portfolio holdings.
Under the Hood
Nygren and his comanagers have long been active buyers of financial stocks, which account for about 35% of the fund’s assets. These stocks weighed down returns for most of 2020, but have recently fared better as interest rates have edged up. The portfolio is also overweight in consumer cyclicals such as General Motors GM, MGM Resorts International MGM, and Hilton Worldwide Holdings HLT. At the same time, the portfolio is light on consumer defensive and healthcare stocks, which typically hold up better during periods of economic weakness. This sector profile weighed on returns in 2020, but has paid off so far in 2021 as investors have grown more confident about the prospects for a robust economic recovery.
Exhibit 1: Sector Exposure
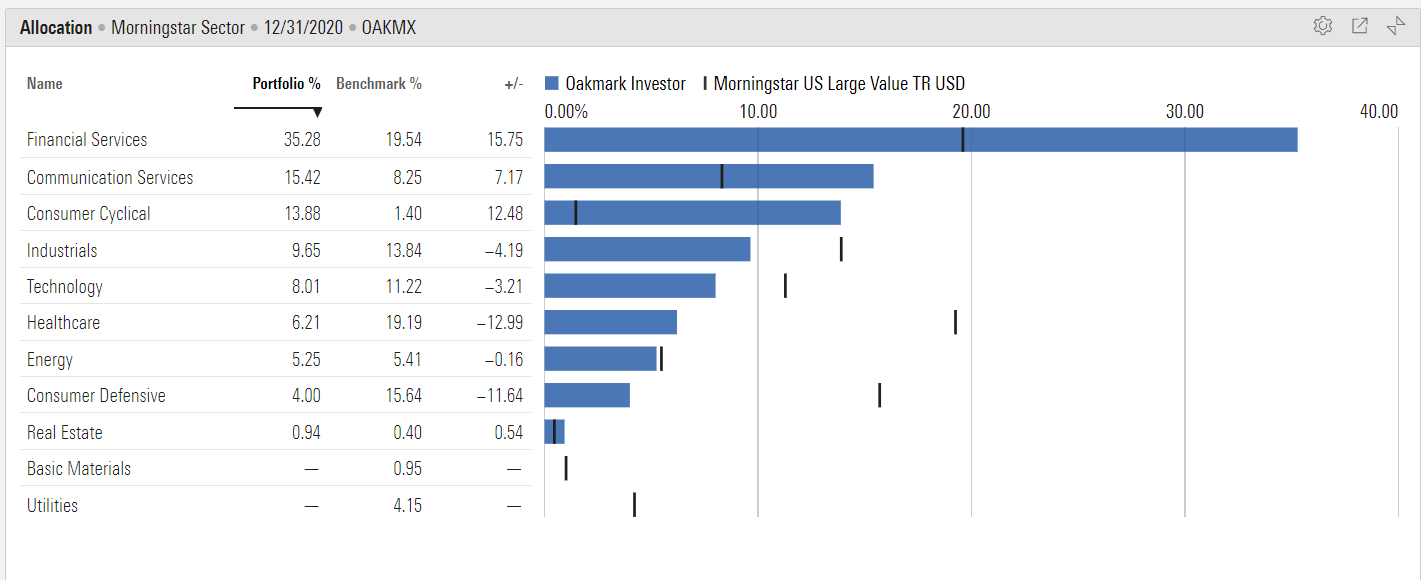
- source: Morningstar
Next, I’ll take a deep dive into the fund's holdings using the 11 style-based factors in the Global Equity Risk Model.
Oakmark’s Risk Factor Exposures
Morningstar's Global Equity Risk Model includes 11 style-based factors that help shed light on a portfolio's underlying risk exposure. Six of the 11 style factors (valuation, valuation uncertainty, economic moat, financial health, ownership risk, and ownership popularity) are based on Morningstar's fundamental equity research and extensive ownership data. The other five factors (liquidity, size, value-growth, momentum, and volatility) are traditional risk factors that have been widely studied by academic research. We express each score in terms of the number of standard deviations from the average (also known as a z-score), with a score of zero indicating the average score for a universe of about 7,000 domestic stocks. We set the sign of each exposure so that positive numbers are generally associated with factors that have shown a positive effect on returns over time.
Note: The fund's prospectus identifies its benchmark as the S&P 500, and Nygren and his team don't adhere to traditional definitions of value and growth. We used the more relevant Morningstar Large Value index as a benchmark for comparing the fund's risk factor exposure, but as the chart below illustrates, the fund doesn't really fit the typical value mold. In particular, the fund scores significantly higher on metrics such as volatility and momentum compared with the value index. Nygren's focus on intrinsic value, management quality, and growth in intrinsic value means he's not just screening on traditional metrics like price/book ratios; as a result, the fund holds some positions often thought of as growth names, such as Alphabet GOOG and Netflix NFLX.
Exhibit 2: Risk Exposure Snapshot
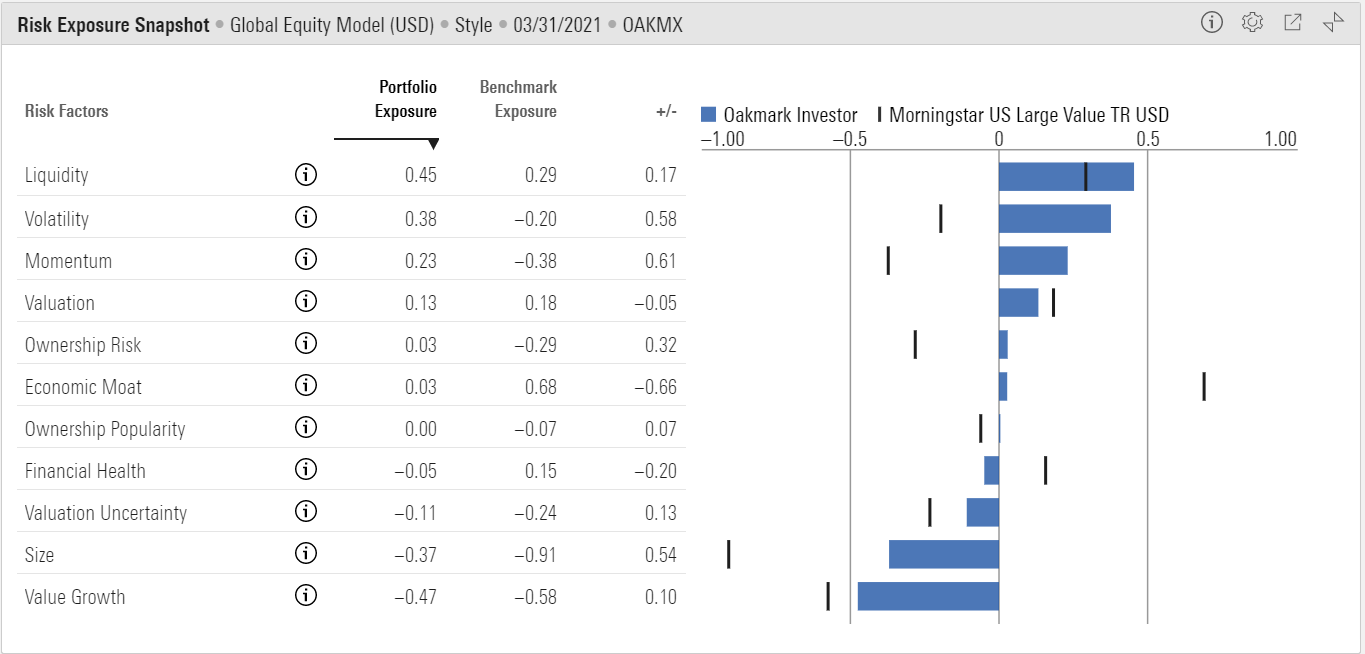
- source: Morningstar
Liquidity: The liquidity factor measures a stock's average trading volume over the past month relative to total shares outstanding. It's basically a measure of how quickly a stock's ownership base changes hands between different investors. Oakmark's holdings score well above average for liquidity, with a portfolio z-score of 0.45 versus 0.29 for Morningstar's Large Value index. The fund's focus on larger-cap stocks with above-average trading volumes makes it unlikely to suffer liquidity woes if it's forced to sell shares to meet redemptions.
Volatility: Our volatility factor is based on a stock's range of historical prices over the past year. Oakmark doesn't have extremely high volatility in absolute terms, but its holdings score above average for volatility, with an z-score of 0.38, compared with negative 0.20 for the Morningstar Large Value index. Top 10 holdings such as Ally Financial ALLY, EOG Resources EOG, and GM have been subject to above-average volatility over the past 12 months. The fund's willingness to hold some more-volatile names has translated into a higher-than-average standard deviation compared with other funds in the large value category.
Momentum: The momentum factor measures how much a stock has risen in price over the past year relative to other stocks. Academic research has found that stocks with strong recent performance often continue performing well, at least over shorter periods. Oakmark's holdings score slightly above average, with a portfolio z-score of negative 0.42, compared with negative 0.56 for the Morningstar Large Value index. The fund doesn't display any extreme momentum tendencies, but it does hold a few stocks that have shown stronger price momentum over the past year, such as Ally and MGM.
Valuation: The valuation factor measures how cheap or expensive a stock is relative to Morningstar's Quantitative Fair Value Estimate, a statistical estimate of fair value based on a company's projected future cash flows. Higher scores indicate the stock is undervalued and more likely to generate positive future returns, while lower scores indicate higher valuations. While Oakmark clearly has a value focus, it doesn't tend toward the extremes on this metric; the portfolio's z-score is 0.23, compared with 0.38 for Morningstar's Large Value index.
Ownership Risk: The ownership risk factor defines a stock's risk level based on the company it keeps. We gauge ownership risk by looking at the risk profiles of the funds that own shares in the same security. If funds owning the stock tend to have high risk profiles, we assign a higher ownership risk score. Oakmark's relatively high score on this factor underscores that fact that it doesn't fit neatly into the value box. Because of management's focus on intrinsic value, the portfolio sports a few holdings that also show up in higher-risk funds, such as EOG, an oil and gas exploration and production firm, and DXC Technology DXC, which focuses on enterprise technology.
Economic Moat: The economic moat factor is based on the Morningstar Quantitative Economic Moat Rating, which is designed to measure the strength of a firm's competitive advantage based on the sustainability of its profits. Higher scores suggest a firm will be able to keep competitors at bay for an extended period. Oakmark's portfolio holdings score below average for economic moat relative to the large value benchmark, but about in line with the broader equity universe. About 44% of the portfolio is in narrow-moat stocks, such as Capital One COF, Citigroup C, and General Electric GE. Wide-moat stocks, such as Alphabet and Bank of America BAC, make up another 36% of assets, with the remaining 14% in no-moat stocks such as GM and American International Group AIG.
Ownership Popularity: This factor represents changes in popularity of a particular stock from the perspective of fund manager ownership. High ownership popularity scores indicate that more fund managers have been increasing their positions in the stock over the past several months. Oakmark's holdings don't really stand out based on this metrics; in fact, the portfolio's z-score is exactly in line with that of the average stock. While Nygren and his team are clearly willing to go against the grain, only a few holdings--such as ConocoPhillips COP and Altria Group MO--qualify as truly out of favor.
Financial Health: The financial health factor is based on strength of a firm's balance sheet, as well as its equity volatility. Higher scores imply stronger financial health and a lower risk of bankruptcy. Stocks that score well based on this factor tend to hold up better during economic downturns, such as the global financial crisis in 2008. Oakmark's holdings score slightly below average on financial health, with an average z-score of negative 0.12, compared with positive 0.14 for the Morningstar Large Value index. While few of its holdings qualify as distressed, holdings such as GM and MGM are some of the weaker portfolio holdings based on this metric.
Valuation Uncertainty: The valuation uncertainty factor is based on Morningstar's Quantitative Uncertainty Rating and measures the level of uncertainty embedded in a company's Quantitative Fair Value Estimate. Companies with less consistent operating earnings and capital spending tend to have less-stable cash flows, making it more difficult to pin down an estimated fair value. Higher scores imply greater uncertainty with a wider range of potential valuation outcomes. By extension, portfolios with high scores for valuation uncertainty tend to have more volatility in returns. Oakmark's holdings score marginally higher than the Morningstar Large Value index on this metric, but the portfolio's z-score is below average relative to the broader equity universe.
Size: The size factor is based on the market capitalization of the stocks included in a portfolio, with higher scores indicating more exposure to smaller-cap stocks. Academic research has found that smaller-cap stocks tend to outperform over longer periods, although larger-cap names have taken a strong lead in the past decade. While Oakmark's average market cap is significantly higher than it used to be, it still has more exposure to mid-cap stocks than many of its peers, as well as less exposure to giant-cap names. As a result, the fund scores relatively high on the size factor, with an average z-score of negative 0.37, compared with negative 0.91 for the large-value benchmark.
Exhibit 3: Morningstar Style Box
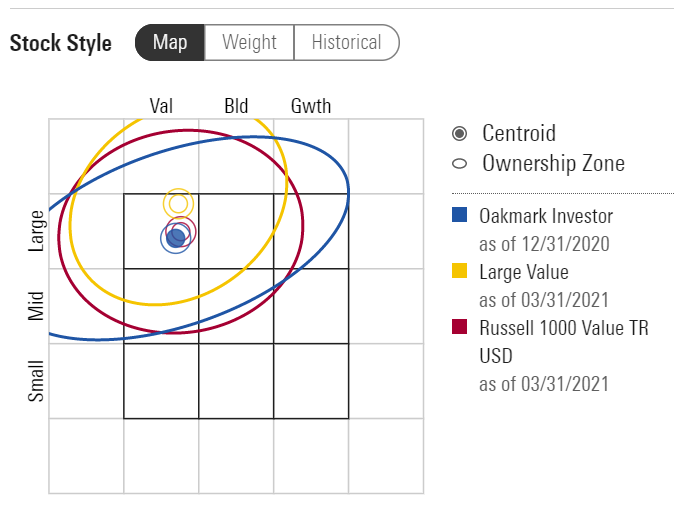
- source: Morningstar
Value-Growth: This factor measures value and growth characteristics based on how the market is pricing a stock. If the stock's current price is high relative to a simple price estimate derived from earnings yield, dividend yield, and book value, that suggests the stock has higher growth expectations baked into its current price. On the flip side, a low current price indicates a value leaning. Oakmark's holdings score below the broader equity average on this metric, indicating a strong value orientation. However, the portfolio's z-score is about in line with the Morningstar Large Value index. Because of its focus on intrinsic value, the portfolio also sports a few stocks that don't fit the traditional value mold, such as Booking Holdings Inc. BKNG and Netflix, which has been a fixture of the portfolio since 2017.
Conclusion
Oakmark doesn’t excel in every market. It typically fares best during value-driven markets, such as 2016, but can experience dry spells in growth-dominated markets, such as the four-year stretch from 2017 through 2020.
But with active management in general and value-oriented investment styles both coming under criticism in recent years, Oakmark stands out as a stalwart exemplar of patient, value-driven management.
/cloudfront-us-east-1.images.arcpublishing.com/morningstar/WC6XJYN7KNGWJIOWVJWDVLDZPY.png)
/cloudfront-us-east-1.images.arcpublishing.com/morningstar/HHSXAQ5U2RBI5FNOQTRU44ENHM.jpg)
/cloudfront-us-east-1.images.arcpublishing.com/morningstar/737HCNGRFLOAN3I7RKGB7VPEKQ.png)
:quality(80)/s3.amazonaws.com/arc-authors/morningstar/360a595b-3706-41f3-862d-b9d4d069160e.jpg)