
When It Comes to Indexes, the Devil is in the Details
Meaningful differences exist even among the most seemingly similar benchmarks.
/s3.amazonaws.com/arc-authors/morningstar/c00554e5-8c4c-4ca5-afc8-d2630eab0b0a.jpg)
The December 2020 addition of Tesla TSLA to the S&P 500 was a useful reminder of the significant differences between apparently similar indexes with respect to how they select stocks, weight them, and maintain their portfolios over time. A casual observer of markets could easily be forgiven for having assumed that Tesla was a component of all major U.S. stock indexes well before the end of last year given its mainstream ubiquity and mushrooming market capitalization. Plus, one of the major points of appeal of broad market indexes is, well, their breadth. They tend not to miss out on much. But not all big benchmarks are similarly broad, nor do they all take the same approach to which stocks they let in and those they leave out.
Here, I’ll illuminate some of the differences between the benchmarks underpinning Morningstar Medalist exchange-traded funds from the large-blend Morningstar Category and their implications for investors.
The Menu
Exhibit 1 below summarizes some of the key dimensions along which indexes might differentiate themselves. Given that all the benchmarks featured here weight stocks by market capitalization, the differences between them relate to security selection and portfolio maintenance.
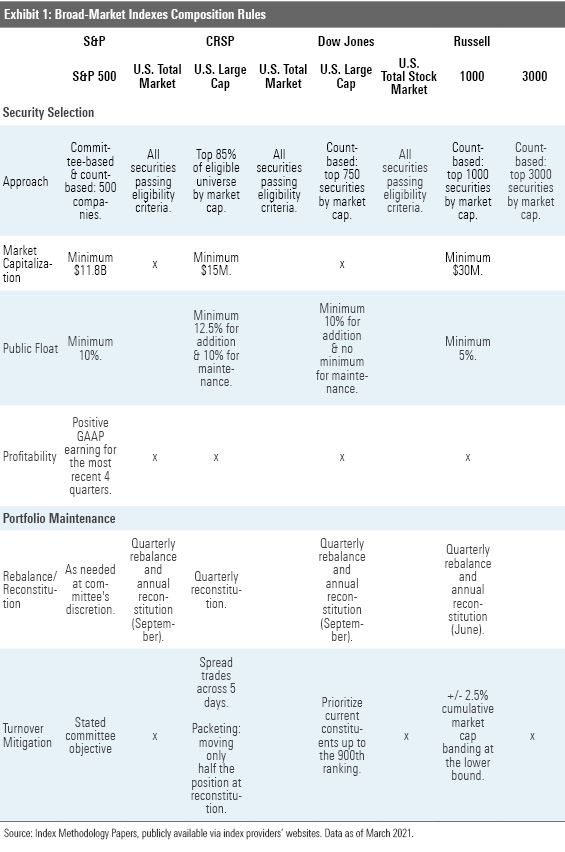
Picking Stocks The indexes featured here have broad reach, but the amount of the U.S. market's investable market capitalization they capture varies. Some are limited to large- and mid-cap stocks and around 80%-85% of the U.S. market by market cap. The total market indexes aim to hold 98%-100% of the investable market, offering exposure to small- and micro-cap stocks. Reaching further down the market-cap ladder can provide some performance edge, but doing so can result in greater transaction costs and court greater risk as these stocks are less liquid and more volatile.
Index inclusion criteria also vary, especially among the large-cap-focused indexes. These benchmarks need to draw a line between large- and mid-cap stocks, often using ranks, counts, or a percentage of market cap threshold. For example, the CRSP U.S. Large Cap Index sweeps in as many stocks as it needs to in order to represent the top 85% of the investable market cap of the CRSP US Total Market Index. By comparison, the Russell 1000 is strictly count-based; it owns the 1,000 largest U.S. stocks. The CRSP Large Cap Index and the Russell 1000 have about 560 common holdings. The 400-plus names unique to the Russell 1000 are smaller companies that have a much smaller effect on the index’s performance than their overlapping mega- and large-cap constituents. The S&P 500 is an odd duck, as it is count-based, but leaves some discretion in the counting to a committee which selects eligible stocks. So, while the tally is generally right around 500, the index’s constituents are not necessarily the 500 largest U.S. companies by market capitalization.
Regular Maintenance Most broad, market-cap-weighted indexes are fairly low-maintenance, which is why they are so appealing as an investment proposition. Regular upkeep typically involves periodic rebalancing and reconstitution. While these indexes' turnover tends to be low--typically less than 5% per year--tracking these portfolios can result in trading costs that can detract from performance. As the amount of money tracking these indexes has grown, index providers have paid extra attention to turnover and developed measures to mitigate the market impact costs of regular index maintenance.
Some indexes use buffers around the margins to minimize the number of unnecessary additions and deletions within the portfolio. They will keep existing constituents in the portfolio until they breach a certain threshold. Most of the major rule-based indexes that are rank- or count-based have some forms of banding around their lower bound, with the exception of the Russell 3000. CRSP further curbs this issue by using a “packeting” approach, which moves only half of a borderline position between benchmarks at any given reconstitution. Meanwhile, the committee-driven S&P 500 explicitly states that its curators aim to avoid unnecessary turnover. Naturally, total market indexes tend to be less affected as they aim to hold the entire investable market, leading to fewer constituent changes.
But even the broadest benchmarks must be mindful not to move the market against them when they make trades. CRSP, for instance, spreads rebalancing over a five-day period, lessening the impact of its quarterly index reviews.
The Tesla Case
The case of Tesla helps to illustrate these differences in greater detail. As of January 2013, Tesla’s market capitalization stood at $4.3 billion. At the time, this was above the minimum market capitalization requirement of $4 billion for the S&P 500. Yet the company was not added to the index until December 2020, although it continued to stay above this minimum. As we previously mentioned, the hurdle was S&P 500’s profitability criteria, which it did not meet until last year.
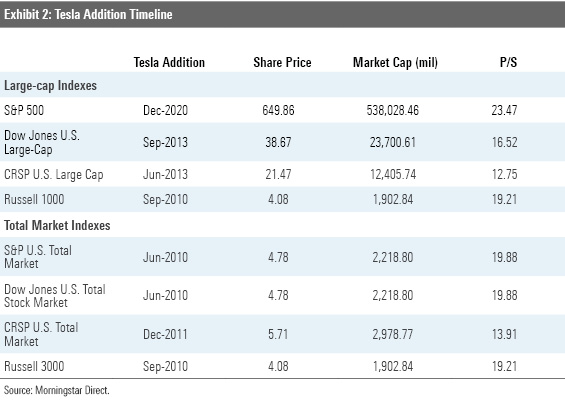
Tesla found its way into other benchmarks well before last December. The CRSP U.S. Large Cap Index added Tesla in June 2013. The Dow Jones U.S. Large-Cap Total Stock Market index followed suit not long after, adding Tesla in September 2013. Unlike the S&P 500, neither of these indexes has a profitability requirement for new names. Tesla’s timeline extends further when we consider total market indexes. The S&P Total Market, Russell 3000, and CRSP U.S. Total Market indexes added Tesla in June 2010, September 2010, and December 2011, respectively.
The table below shows Tesla’s market cap and price/sales multiple at the time it was added to each index. Compared with its peers, the S&P 500 and the trillions of assets tied to it got the bad end of the bargain. It’s clear that the wider the net, the sooner an index will include nascent companies and the lesser chance investors will miss out on investment opportunities.
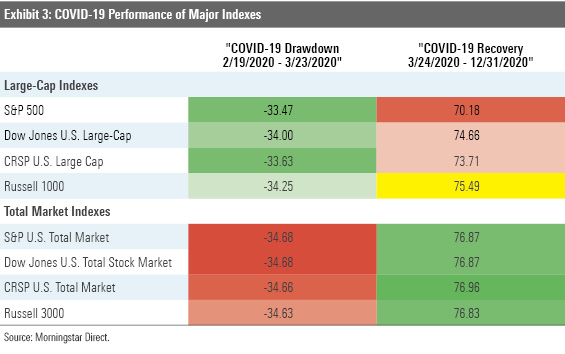
But this isn’t an indictment of the S&P 500. Indeed, during the early 2020 COVID-19 shock, the index held up better than both its large-cap and total market peers, thanks in part to its profitability screen and large-cap focus. That said, excluding Tesla for most of the subsequent recovery phase hurt its relative performance. Leaving out small-cap stocks--which rebounded sharply off the market’s March 2020 bottom--also left large-cap-focused indexes like the S&P 500 at a disadvantage. But even these short-term differences were small, as evident in Exhibit 3 below. The fact of the matter is that cap-weighted indexes’ long-term performance will be driven by their biggest constituents over the long term, and the long-term performance profiles of all these benchmarks--and the funds that track them--will be awfully similar.
Neither Standard, nor Poor
Broad bets on U.S. stocks have generally been a good bet for investors. Diversified index funds stand a good chance at delivering great long-term results. According to the most recent Morningstar Active/Passive Barometer, only 31% of active large-blend funds outperformed the average passive peers during 2020. Proponents of active management often argue that they are better poised to capitalize on volatile market conditions than their indexed peers, yet active funds did not pass the test during one of the rockiest markets we have seen in a while. And active funds' success rates dwindle as we lengthen the time horizon. Over the 20 years ending December 2020, almost 13% of active funds in the large-blend category survived and outperformed their average passive peer.
There is no secret recipe here: Index funds' razor-thin expense ratio have long been the main source of their outperformance. In addition, broad diversification ensures that investors have a stake in the market's winners and mitigates the impact of owning a lot of losers. Low turnover enhances tax efficiency and keeps trading costs under wraps. While these funds will never offer the highest returns, they have consistently done better than most of their active peers.
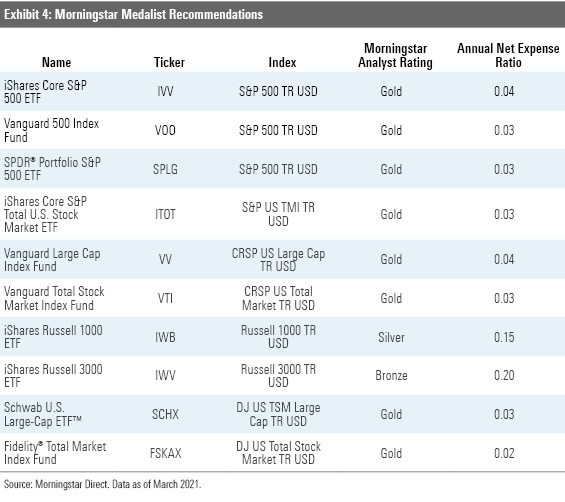
Below is the roster of Morningstar Medalists that fit this mold:
Disclosure: Morningstar, Inc. licenses indexes to financial institutions as the tracking indexes for investable products, such as exchange-traded funds, sponsored by the financial institution. The license fee for such use is paid by the sponsoring financial institution based mainly on the total assets of the investable product. Please click here for a list of investable products that track or have tracked a Morningstar index. Neither Morningstar, Inc. nor its investment management division markets, sells, or makes any representations regarding the advisability of investing in any investable product that tracks a Morningstar index.
/d10o6nnig0wrdw.cloudfront.net/04-18-2024/t_34ccafe52c7c46979f1073e515ef92d4_name_file_960x540_1600_v4_.jpg)
/d10o6nnig0wrdw.cloudfront.net/04-09-2024/t_e87d9a06e6904d6f97765a0784117913_name_file_960x540_1600_v4_.jpg)
/cloudfront-us-east-1.images.arcpublishing.com/morningstar/T2LGZCEHBZBJJPPKHO7Y4EEKSM.png)
:quality(80)/s3.amazonaws.com/arc-authors/morningstar/c00554e5-8c4c-4ca5-afc8-d2630eab0b0a.jpg)