
How Much Should You Worry About Inflation in Retirement?
Calculating a customized inflation rate is better than using a blunt measure like CPI.
/s3.amazonaws.com/arc-authors/morningstar/66112c3a-1edc-4f2a-ad8e-317f22d64dd3.jpg)
A retiree using the 4% rule to guide withdrawals would have taken out $60,000 from a $1.5 million portfolio in the year 2000. By 2020, that withdrawal amount would have been right around $100,000.
The reason for the elevated payday? The 4% guideline assumes that a retiree takes a withdrawal of 4% of his or her portfolio initially, then inflation-adjusts that amount thereafter. If a retiree were routinely incorporating a 3% annual inflation adjustment into her withdrawal system, without regard to her actual inflation rate, those steady nudges up over a 20-year period would have translated into a spending increase of nearly $40,000 from where she started out.
That example illustrates how seemingly small annual inflation adjustments can translate into some serious money over time. It also underscores the importance of incorporating your own situation and spending patterns into your retirement plan and withdrawal system rather than taking current or historic inflation rates and running with them. With a little bit of analysis, it's not difficult to come up with something close to a customized inflation rate.
How Big a Deal Is Inflation? It Depends
Historically, inflation in the United States has run at a roughly 3% level since the government began calculating inflation statistics in 1913. But the current inflation rate, as measured by the most commonly cited CPI measure--the Consumer Price Index for All Urban Consumers, or CPI-U--was about 1.7% for the 12 months ended February 2021. By that measure, the retiree who gave herself a 3% raise last year was overshooting it.
Broad inflationary averages like CPI can be a good starting point when thinking about how much to worry about inflation in the here and now, but they're a blunt instrument. To calculate CPI, the Bureau of Labor Statistics uses a consumption basket of goods and services, with each item weighted by how much of the typical U.S. household's budget it represents. Categories like housing receive the biggest weighting in the CPI calculation, while recreation and apparel get smaller weightings.
But here's the thing: What your household spends money on is likely to differ from the typical U.S. household's. To use a simple example, let's compare two 45-year-olds, one living in New York City and the other living in a suburb of Dallas. The New Yorker is spending a bigger share of her budget on housing than is the Dallas resident; her outlays for food and restaurants are also higher. On the other hand, the Dallas resident needs to have a car to get back and forth to work (when we're not in a pandemic), whereas the New Yorker can take the subway or even walk to work. The Dallas resident will feel the sting when gas prices head up, while the New Yorker will feel feel a bigger pinch when higher rents and higher food prices come on line.
Inflation for Older Adults
That illustrates the role of geography and lifestyle choices play in each of our consumption baskets, which in turn influences how much inflation we're experiencing. Age tends to play a role, too, as reflected in a statistic called CPI-E, the Consumer Price Index for the Elderly, which captures the spending of adults who are age 62 and above. The Bureau of Labor Statistics has been calculating CPI-E since 1982, so there are now almost 40 years' worth of data. By comparing CPI-E to CPI-U, the latter of which includes people of all ages, it's possible to see how people post-age 62 spend their money relative to the broader population and also what rates of inflation they experienced.
For the one-year period ended December 2020, CPI-E was 1.4%. That was right in line with the increase in CPI-U (for the broad population) during that same period. Since the Bureau of Labor Statistics began calculating CPI-E in 1982 through 2020, it averaged 2.79%--a touch higher than CPI-U, which inflated about 2.60% per year, on average, over that same stretch.
The difference in the inflation rates owes to differences in the consumption baskets of older adults (CPI-E) and the general population (CPI-U), as depicted in the table below. Older adults spend more on medical care than the general population--about 4 percentage points more of their budgets go to cover those costs than in the population at large. And while the medical-care inflation rate has recently been more in line with the general inflation rate, its historical average is more than 5%, which has had a disproportionate effect on older adults.
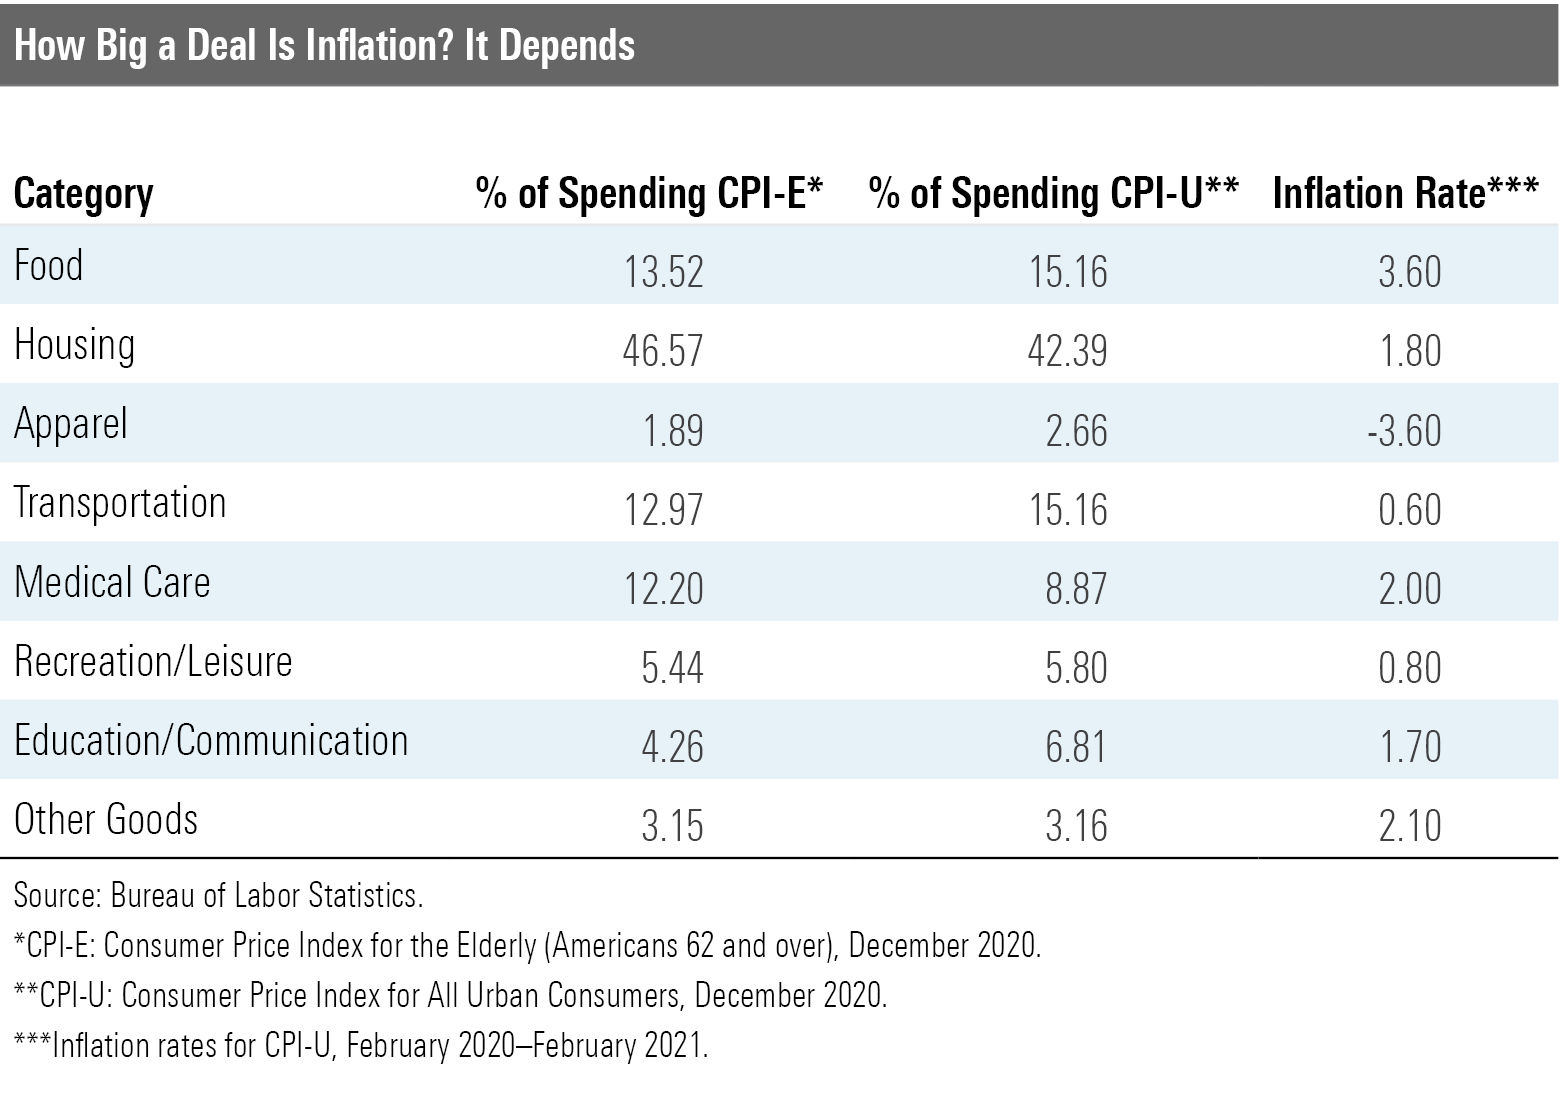
You'll notice that housing is also a higher share of older adults' consumption baskets than it is for the general CPI. That seems counterintuitive, in that many older adults live in paid-off homes. But the statistic relates to how the Bureau of Labor Statistics calculates housing costs. Given that many older adults own their homes rather than rent them, it's possible--even likely--that CPI-E overstates housing-related costs for many older consumers.
On the other side of the ledger, older adults' outlays for other budget line items are lower--notably transportation and education. Older adults commute less than younger people do, and their years of heavy education spending are typically behind them, too. Food expenses--both dining out and food prepared at home--also consume a smaller share of older adults' budgets than is the case for younger adults. Thus, rising food costs--the category with the highest inflation over the past 12 months through February 2021--have hurt older adults a bit less than the broad population.
Calculating Your Own
If you're looking at the CPI weightings and thinking that they look nothing like your household's own spending, you're on the right track. Your outlays for housing may diverge significantly from the CPI percentages, especially if you live in a paid-off home. (You'll still have costs for upkeep and property taxes, of course, which are also included in "Housing.")
You can get closer to a personal inflation rate by looking at your actual spending in each of the major categories and blending that with the inflation we're seeing in those areas. On this spreadsheet, you can input your spending in each of the major categories, then calculate a personalized inflation rate that incorporates inflation by spending category. We've populated it with some sample data, but you can look back on your actual spending over the past year; you can also tweak the inflation expectations for each line item in line with your own experiences.
At the same time, it's important to not come away with a false sense of precision with respect to inflation. For one thing, inflation statistics are ephemeral: The one-year figures provided in the spreadsheet capture price changes in various categories during a pandemic. Some of the categories--for example, apparel--will likely pop back up once we're all out and about more often.
Moreover, the number that really bears paying attention to is the trend in your actual, all-in spending, which depends on a few key variables: your fixed and discretionary expenses as well as what's going on with inflation in each of the spending categories. Ultimately, your aggregate household spending trend matters more than examining inflation on a small scale because you exert a level of control over some of your spending, whereas inflation is out of your hands.
:quality(80)/cloudfront-us-east-1.images.arcpublishing.com/morningstar/WDFTRL6URNGHXPS3HJKPTTEHHU.png)
:quality(80)/cloudfront-us-east-1.images.arcpublishing.com/morningstar/EC7LK4HAG4BRKAYRRDWZ2NF3TY.jpg)
:quality(80)/cloudfront-us-east-1.images.arcpublishing.com/morningstar/BZ4OD6RTORCJHCWPWXAQWZ7RQE.png)