
ETF Flows' Record Run Cut Short in February
Investors dialed up their allocations to U.S. stock ETFs, and ARK continued to ascend the ETF ranks.
/s3.amazonaws.com/arc-authors/morningstar/a90ba90e-1da2-48a4-98bf-a476620dbff0.jpg)
After a slow start in 2021, stocks found some pep in their step in February. The Morningstar Global Markets Index--a broad gauge of global equities--jumped 2.59% last month. Meanwhile, bonds continued to slide as rates ticked up and yield curves steepened. The Morningstar US Core Bond Index declined 1.71% as rising yields pushed bond prices lower.
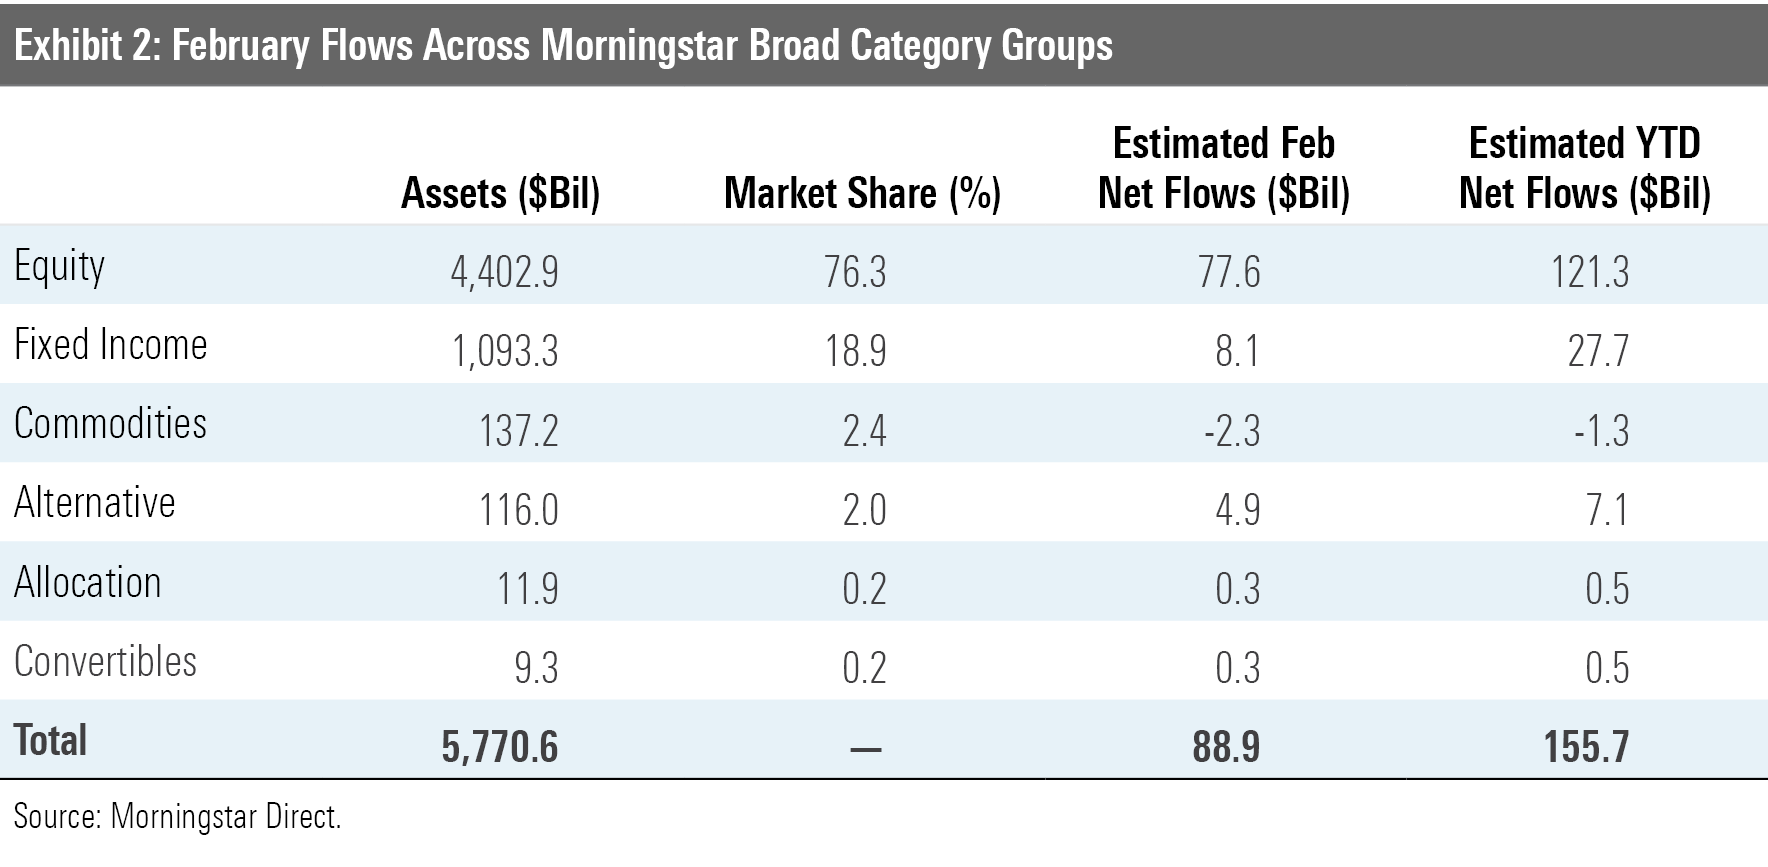
Bond exchange-traded funds captured the majority of inflows for much of 2020, but more recently flows have favored stocks. Investors poured another $77.6 billion into equity ETFs in February 2021. That figure ranks second only to November 2020's record $88.1 billion inflow to equity ETFs. February flows into all ETFs totaled $88.9 billion and might have eclipsed November 2020's $91.4 billion record if it weren't for the fact that it's the shortest month of the year.
Here, I will take a closer look at how major asset classes performed last month, where investors were putting their money, and which segments of the market looked cheap and dear at month's end--all through the lens of ETFs.
Full Prices
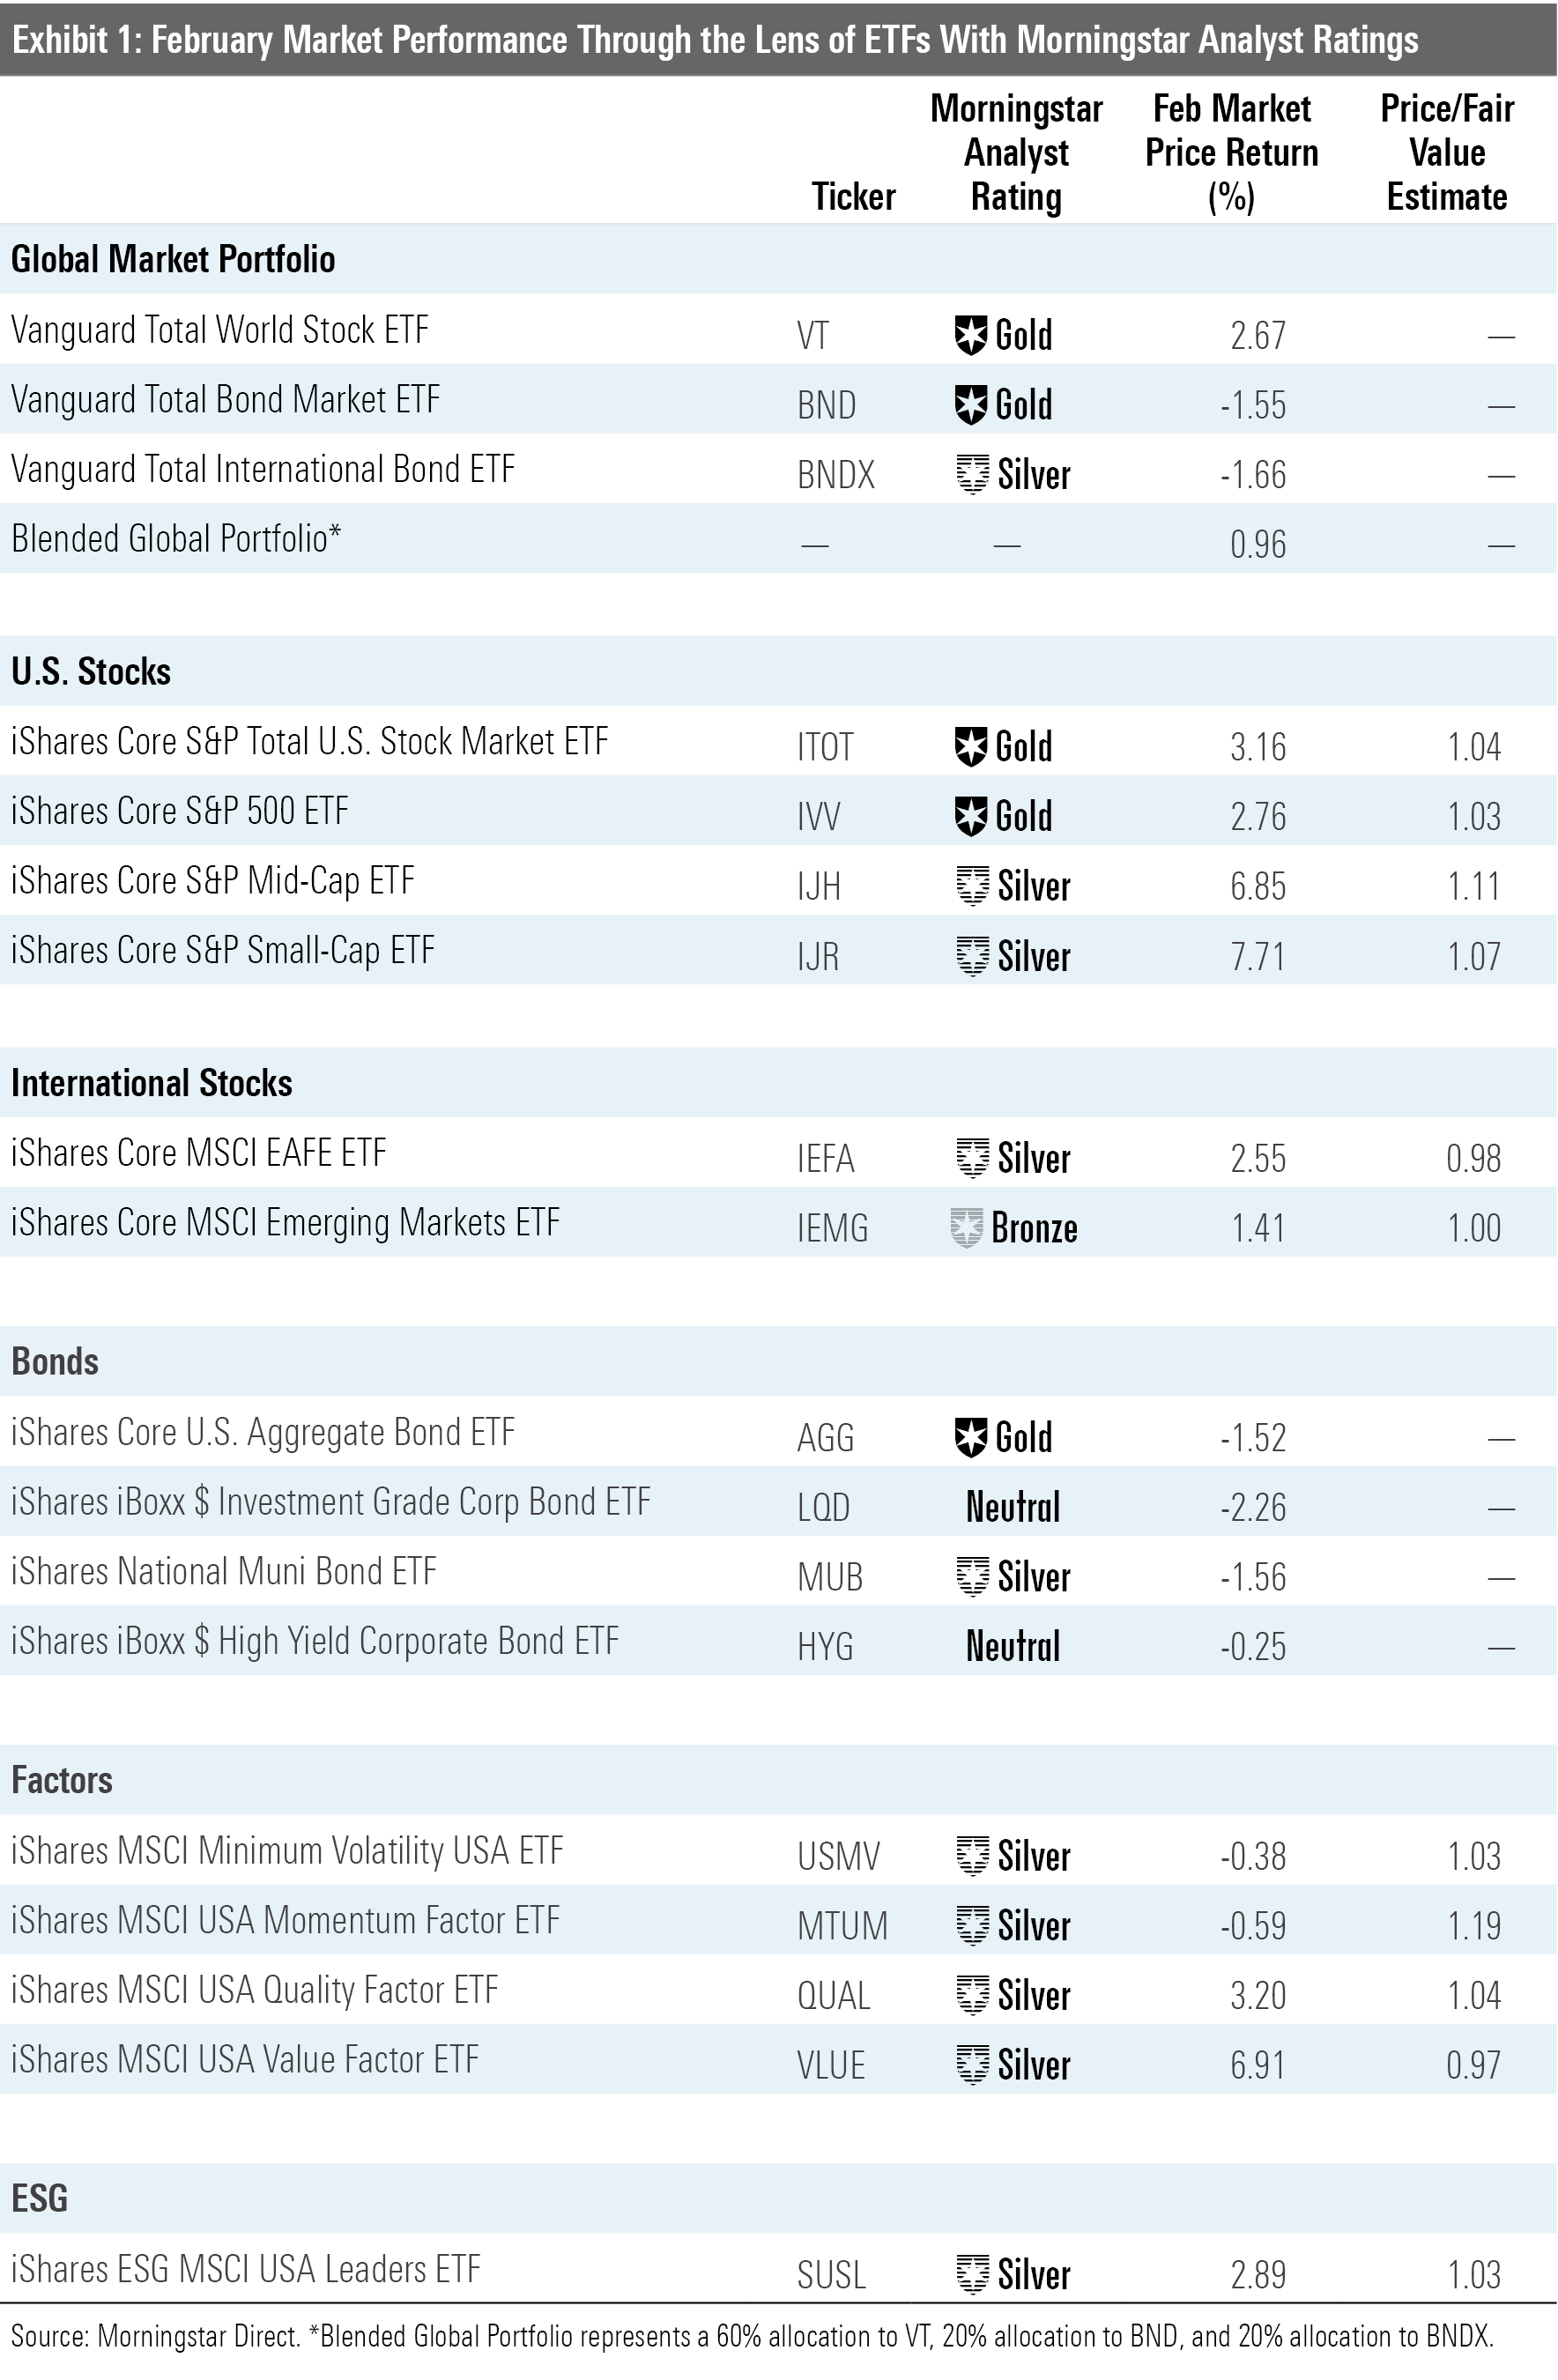
Exhibit 1 features February performance figures for a sampling of ETFs with Morningstar Analyst Ratings serving as proxies for major asset classes. Investors in a blended global market portfolio gained 0.96% during the month. At the end of February, U.S. stocks, represented here by iShares Core S&P Total U.S. Stock Market ETF ITOT, were trading 4% above their fair value, as measured by the fund's Morningstar price/fair value estimate. Foreign stocks don't appear as fully valued. Foreign developed stocks, proxied by iShares Core MSCI EAFE ETF IEFA, gained 2.55% and were trading a shade below fair value at month's end. Emerging-markets stocks, embodied here by iShares Core MSCI Emerging Markets ETF IEMG, gained 1.41% in February and finished the month trading right at their fair value.
Small caps were still sizzling in February. IShares Core S&P Small-Cap ETF IJR gained 7.71% and ended the month trading at a 7% premium to its Morningstar fair value estimate. This is after IJR spent most of 2020 trading at a considerable discount.
U.S. small caps have been on a tear since October 2020. IJR outgained iShares Core S&P 500 ETF IVV by nearly 36 percentage points during this stretch. Favorable stock exposures in the consumer discretionary and technology sectors have been the biggest contributors to IJR's recent turnaround. It is worth noting that the largest single-stock contributor to the fund's performance over this period was GameStop GME. The world's favorite meme stock spiked more than 897% in this time frame. At the end of February, it represented 0.57% of IJR's portfolio, down from just over 1.00% at the end of January.
Going back to October, the performance spread between small-cap value and large-cap growth approximated the broader small-versus-large gap. The Morningstar US Small Value Index gained nearly 50.9% over this five-month period, while the Morningstar US Large Growth Index was up 8.4%.
Investors have taken note of value stocks' resurgence. ETFs in the large-, mid-, and small-value Morningstar Categories found more buyers in February. Just shy of $3.9 billion flowed into these funds last month. Investors have plowed nearly $31 billion into these ETFs over the past four months after largely ignoring them for most of 2020.
The dispersion of returns and valuation spreads among single-factor strategic-beta ETFs speaks to the forces that have defined stock markets of late. For example, iShares MSCI USA Value Factor ETF VLUE lagged ITOT by 8.5 percentage points over the 12 months through February. But VLUE has been scratching its way back. Over the past three months, it outperformed ITOT by 6.2 percentage points. As a result, the value stocks in VLUE's portfolio no longer look like a bargain. VLUE finished October trading 21% below its fair value. At the end of February, it was trading at a 3% discount.
On the other hand, iShares MSCI USA Momentum Factor ETF MTUM saw a sharp reversal in February, as its shares slipped 0.59%. At the end of January, the fund was trading at a 32% premium to its fair value estimate. At the end of February, that premium shrank to 19%.
Interest Rates' Ripple Effect on Flows
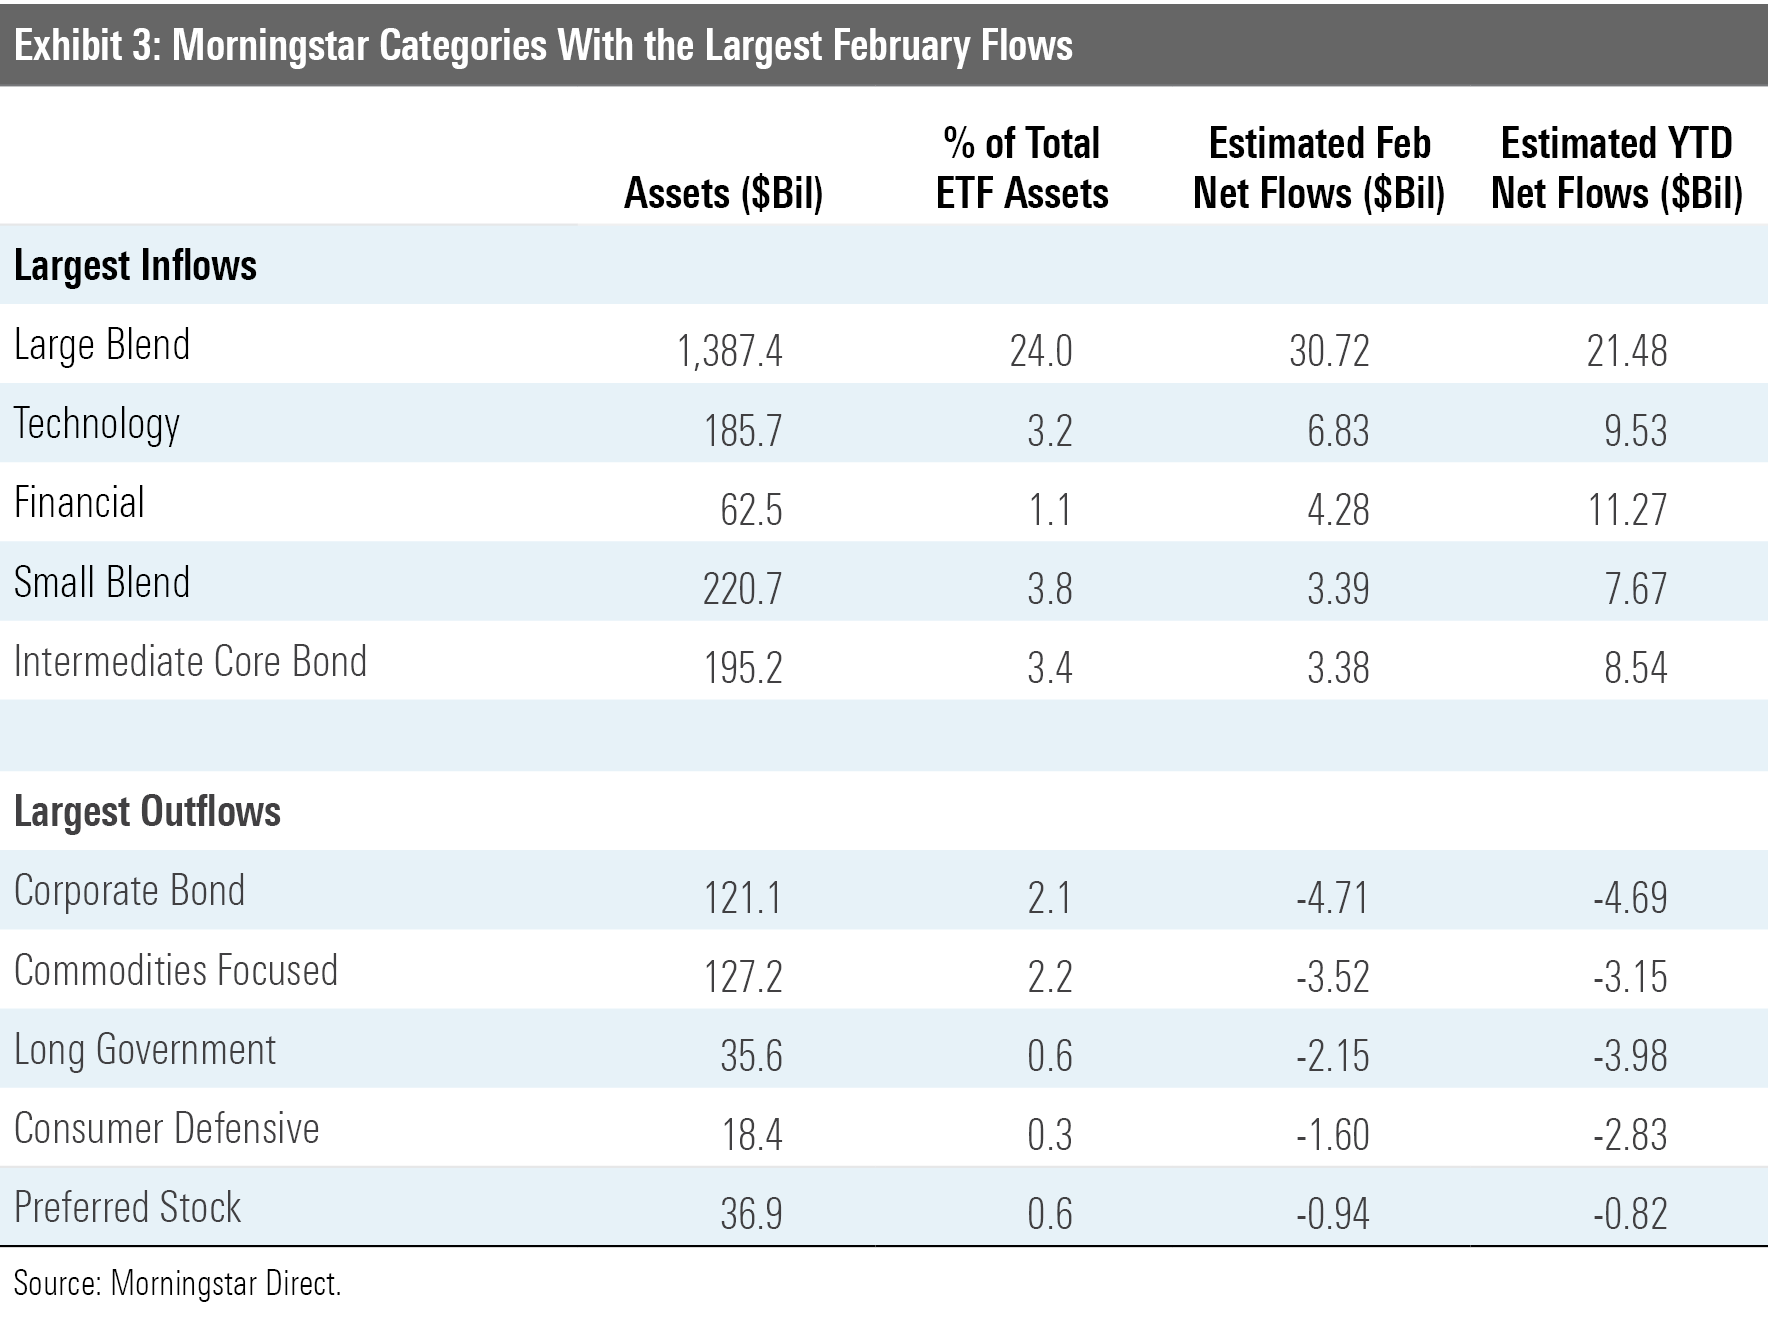
While the February headline was near-record flows into stock ETFs, the subheads speak to the effect that rising rates had on ETF investors' decisions. Steeper yield curves were a bullish signal for financial stocks, and ETFs in the financial category saw nearly $4.3 billion in inflows. On the flip side of the coin, higher rates were bad for long-term bonds. ETFs belonging to the corporate-bond and long-government categories saw combined outflows of $6.9 billion.
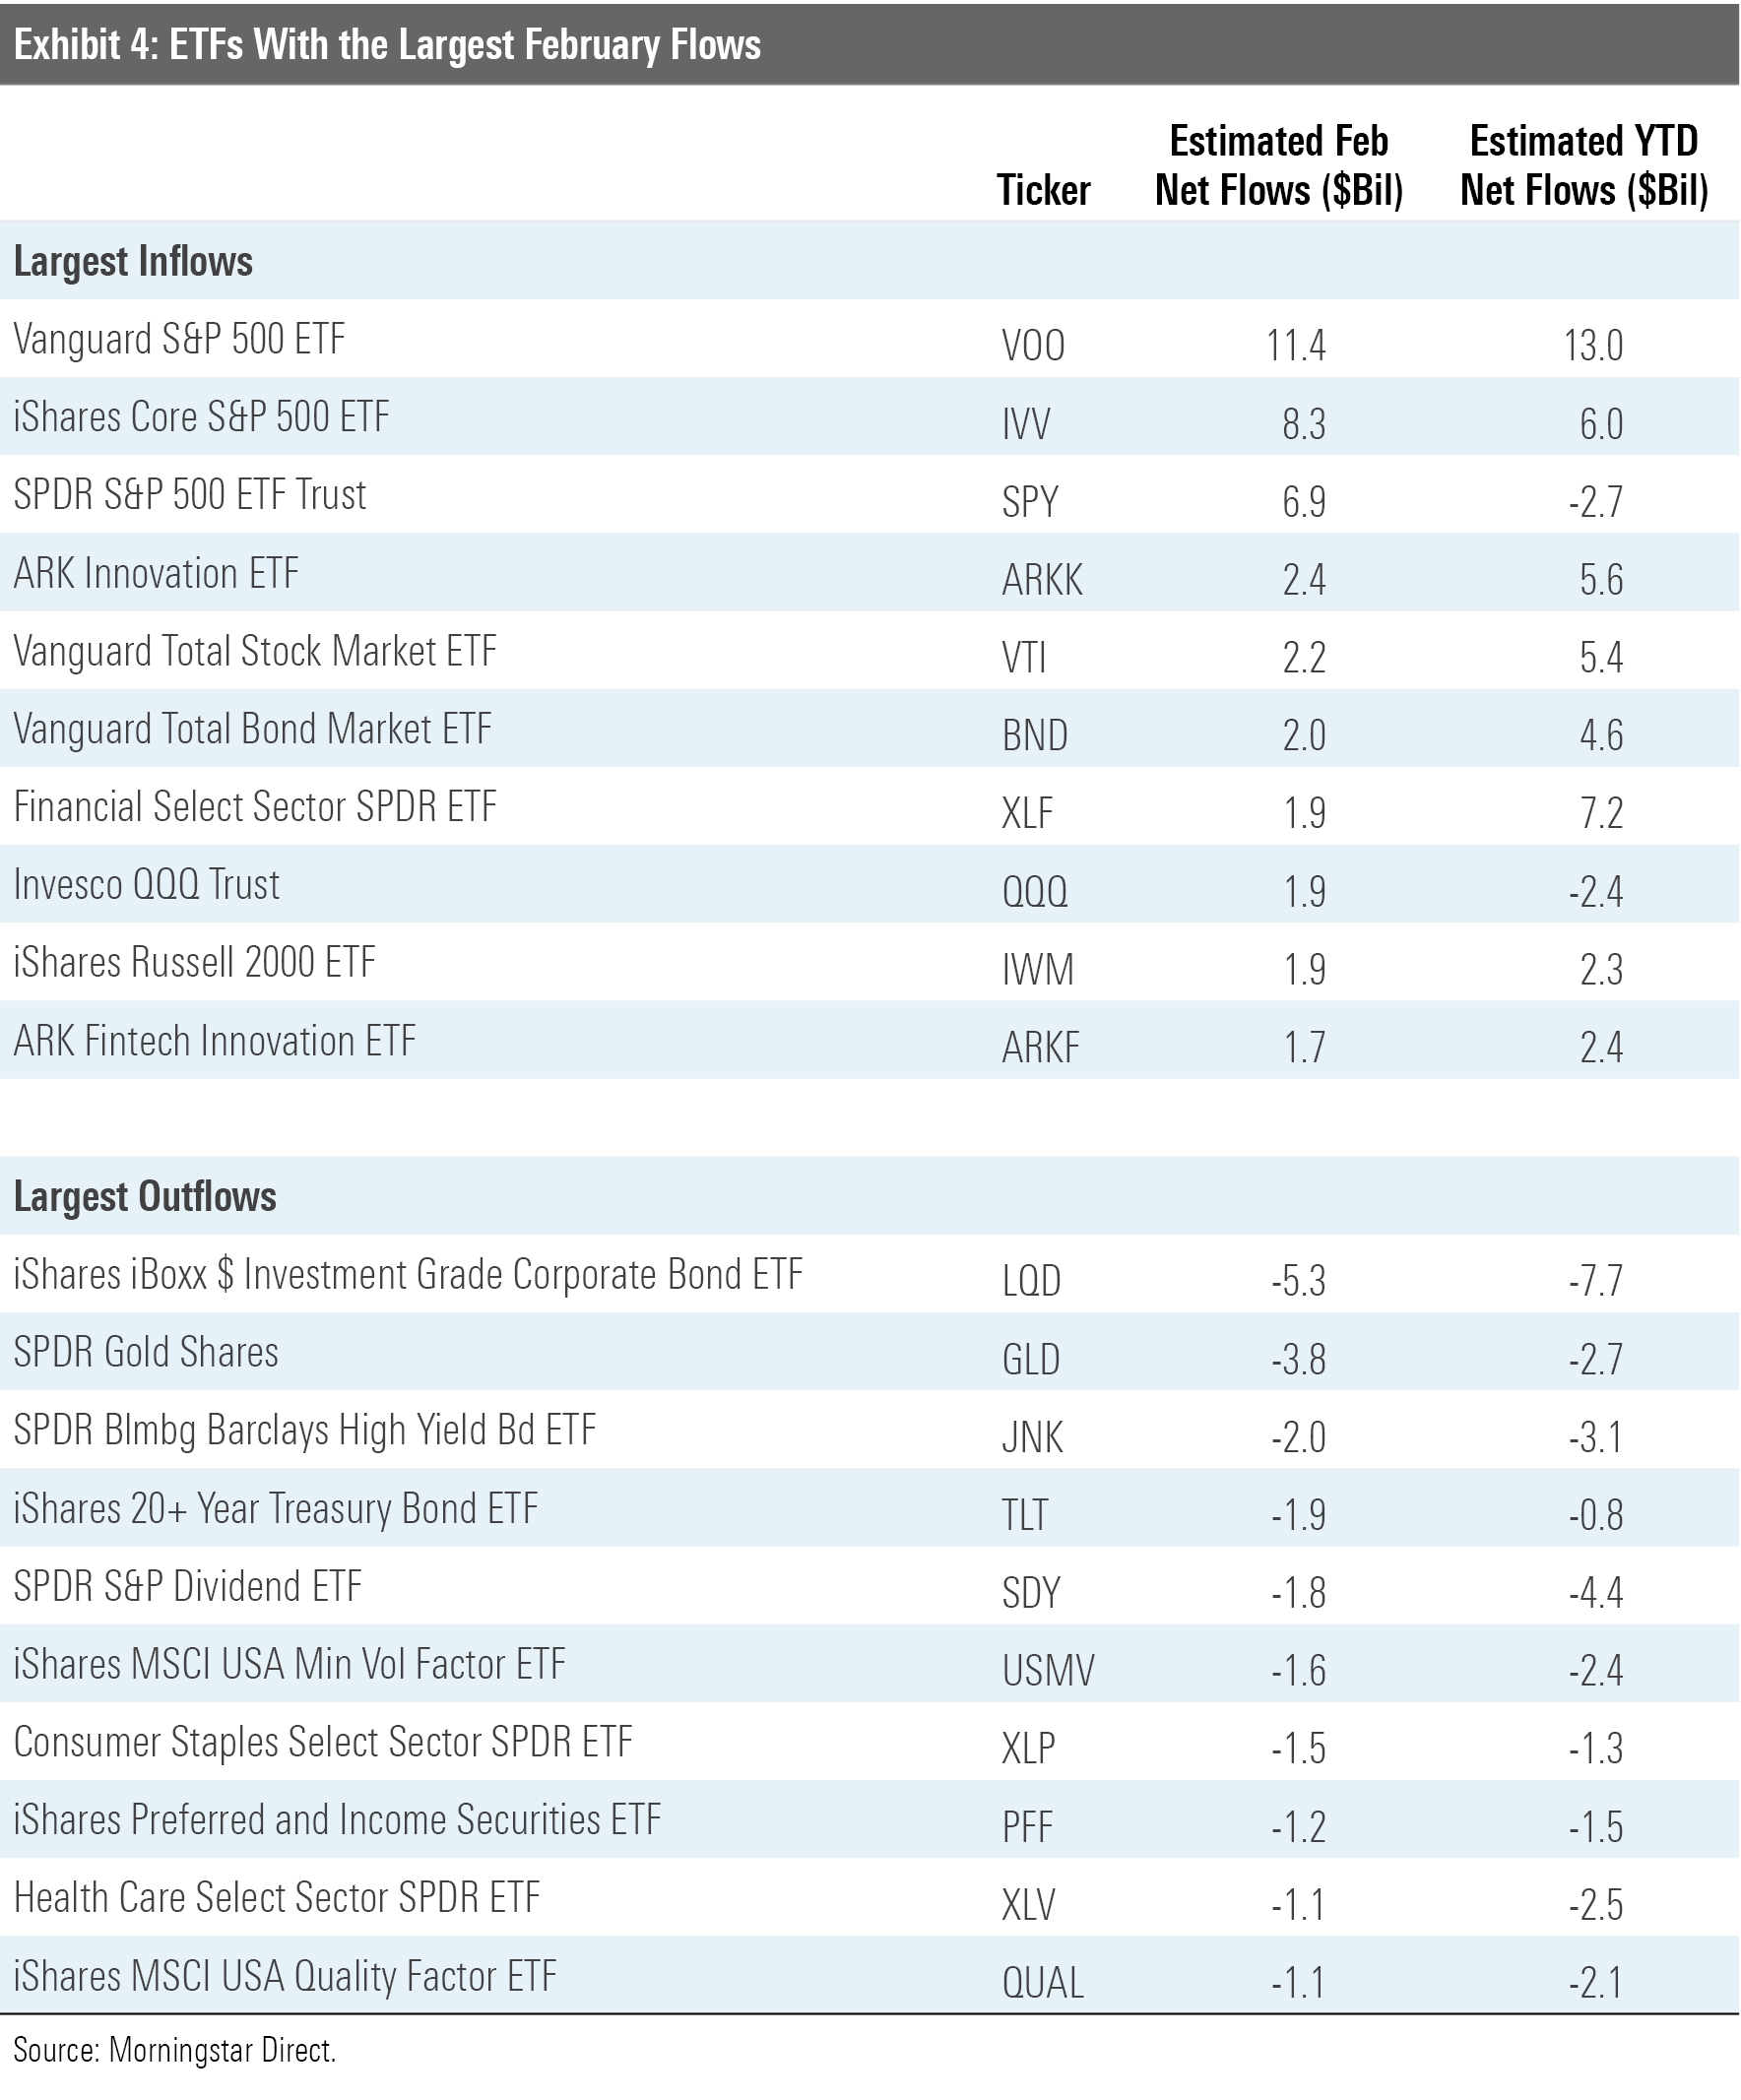
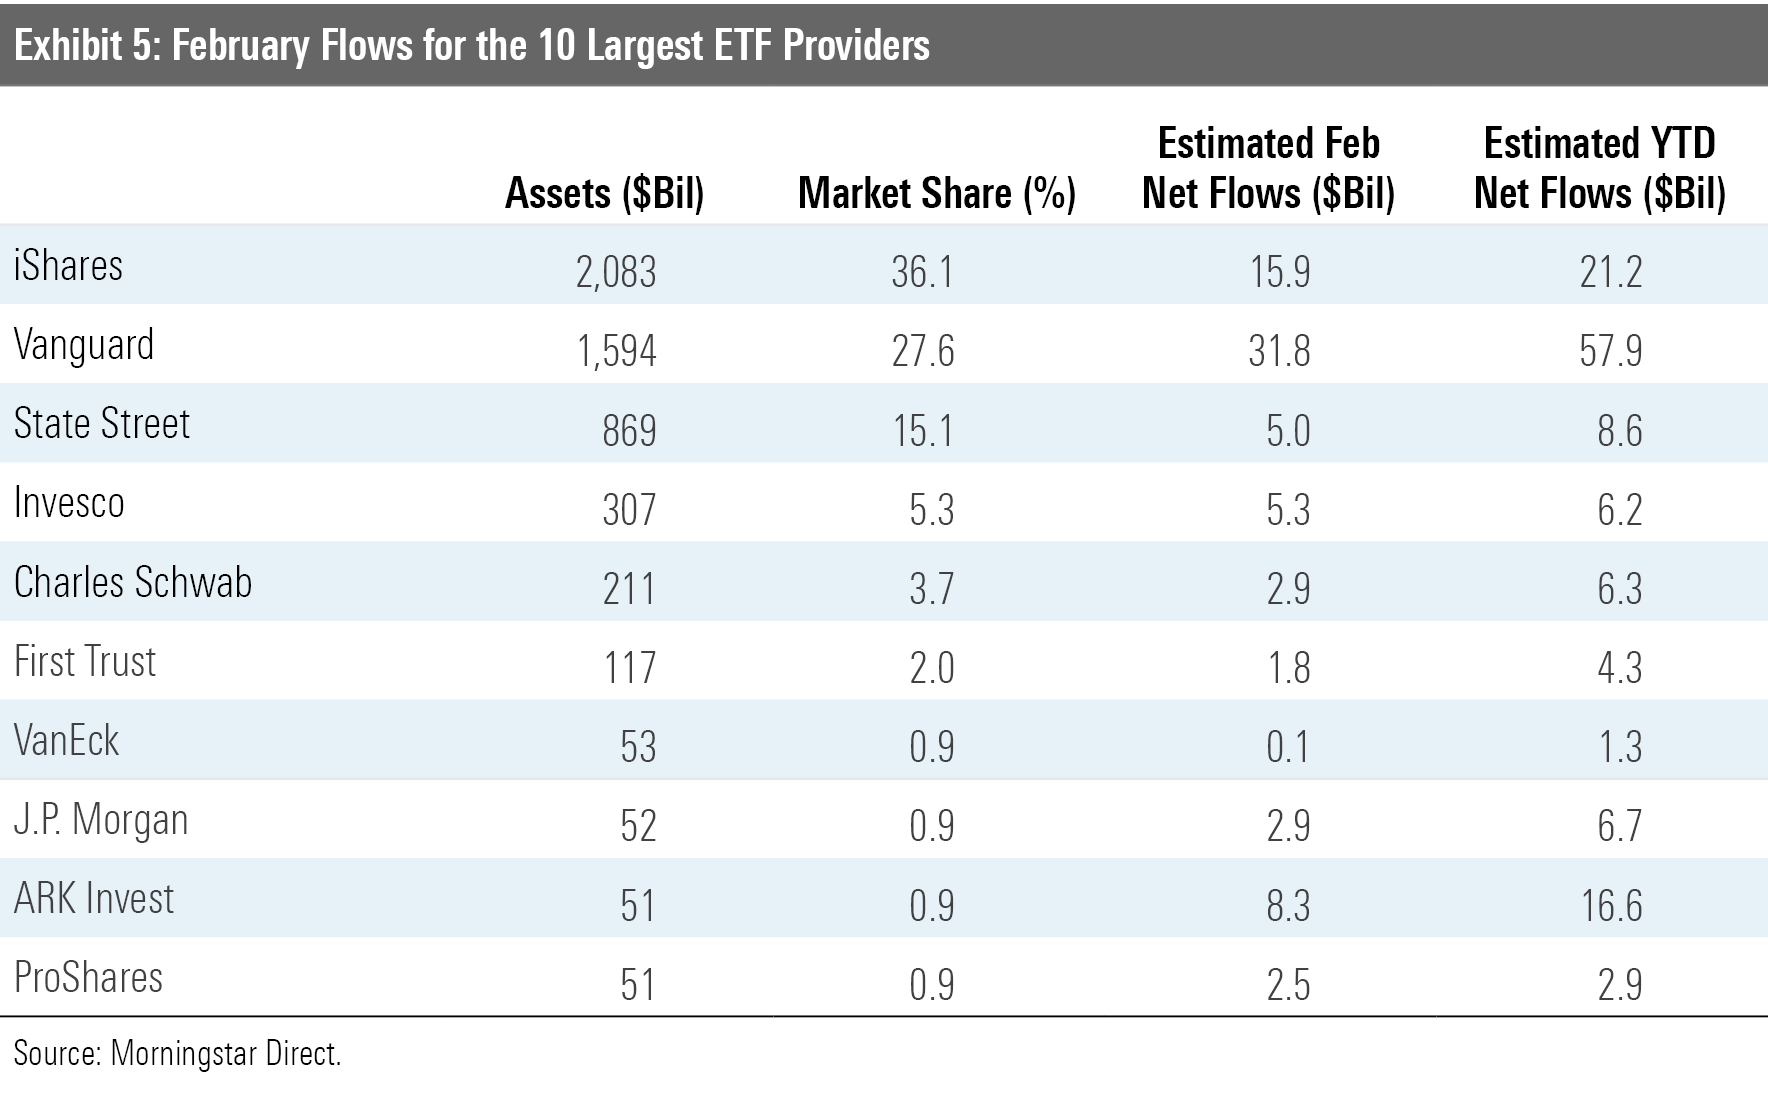
The S&P 500 ETF trio won, placed, and showed in the February asset-gathering race. Vanguard S&P 500 ETF VOO, IVV, and SPDR S&P 500 ETF SPY raked in a combined $26.6 billion--representing just over a third of all flows into stock ETFs. Regular core portfolio staples like Vanguard Total Stock Market ETF VTI and Vanguard Total Bond Market ETF BND also made an appearance. And despite the fact that its performance hit an air pocket late in the month, ARK Innovation ETF ARKK brought in another $2.4 billion.
Vanguard topped the ETF provider flows league table in February, again. The firm's ETFs raked in $31.8 billion--$900 million more than its five largest competitors combined. Some of Vanguard's recent ETF flows have resulted from conversions of assets in their funds' Admiral share classes to ETF shares, which are now cheaper than the Admiral shares of the same funds after a wave of recent repricing. The firm has since either directly converted some of its investors' existing Admiral share-class allocations to the ETF share class or otherwise nudged them to do it on their own. That said, the majority of its new inflows have come from new investments--not conversions. Most of these conversions have now run their course, and their impact on the firm's ETF flows has diminished.
ARK, the newest name on the ETF industry's leaderboard, continued to pull in new investors in February and climbed from the 10th spot to the ninth spot in just four weeks' time. The firm took in another $8.3 billion in net new money during the month. This amounted to a one-month organic growth rate of 18%. The firm's flagship fund ARKK has delivered incredible performance. From its Oct. 31, 2014, inception through the end of February 2021, it gained 36.01% annually. Its performance puts it in rarefied air. Only 64 of the 8,637 (0.74%) U.S.-domiciled stock mutual funds in Morningstar's U.S funds database have ever generated equal or greater returns over a similar time frame.
As ARK's performance has skyrocketed, flows have followed. Investors have added $40 billion to the firm's global family of funds over the past 12 months. Assets in its funds have swelled to $53.2 billion from $6.4 billion at the end of February 2020. Investors considering these funds today should be asking themselves two key questions: 1) Is performance like this too good to last? and 2) Given the firm's sizable stakes in smaller stocks, how can it effectively manage capacity given that ETFs can't close to new investors and have to broadcast their trades to the world every day?
Dirty Energy Looks Cheap, Clean Energy Dear
The fair value estimate for ETFs rolls up our equity analysts' fair value estimates for individual stocks and our quantitative fair value estimates for stocks not covered by Morningstar analysts into an aggregate fair value estimate for stock ETF portfolios. Dividing this value by the ETFs' market prices yields the price/fair value ratio. This ratio can point to potential bargains and areas of the market where valuations are stretched.
Exhibit 6 features the 10 ETFs that were trading at the largest discounts and premiums to their fair value estimates as of the end of February. All 10 funds trading at the largest discounts belong to either the equity energy or energy limited partnership categories. A year ago, pain was pervasive in the energy sector as demand declined and supply continued to flood the market. As producers ran out of places to store their output, prices collapsed, as did the share prices of firms operating in the sector.
But the market is a discounting mechanism, and in recent months, it has been pricing in a return to normalcy in the economy and balance in energy markets. The rollout of coronavirus vaccines and the prospect of reopening the global economy has lifted oil prices and energy ETFs. But even after getting a proverbial shot in the arm, valuations in the sector remain depressed, and these funds continue to feature prominently in the ETF bargain bin. That said, they don't look nearly as cheap as they did at the end of March last year. For example, at the end of March 2020, VanEck Vectors Oil Services ETF OIH was trading at a price/fair value estimate of 0.29. Since then, the fund's share price has doubled. As of the end of February, after gaining just over 23% during the month, its price/fair value ratio was 0.76.
This month's list of ETFs trading at the largest premiums to their fair value estimates includes clean energy darling VanEck Vectors Low Carbon Energy ETF SMOG. SMOG ranked among 2020's top performers, posting a 118.63% gain for the year. Renewed interest in meaningful, long-term investment in renewables has buoyed share prices and valuations within this segment of the market.
New and notable among the list of the most overvalued ETFs is KraneShares SSE STAR Market 50 ETF KSTR. The fund, which launched on Jan. 27, tracks the Shanghai Stock Exchange Science and Technology Innovation Board 50 Index. The benchmark owns the 50 largest companies listed on the SSE Science and Technology Innovation Board (aka the STAR Market). This has become the listing venue of choice for Chinese "unicorn" firms.
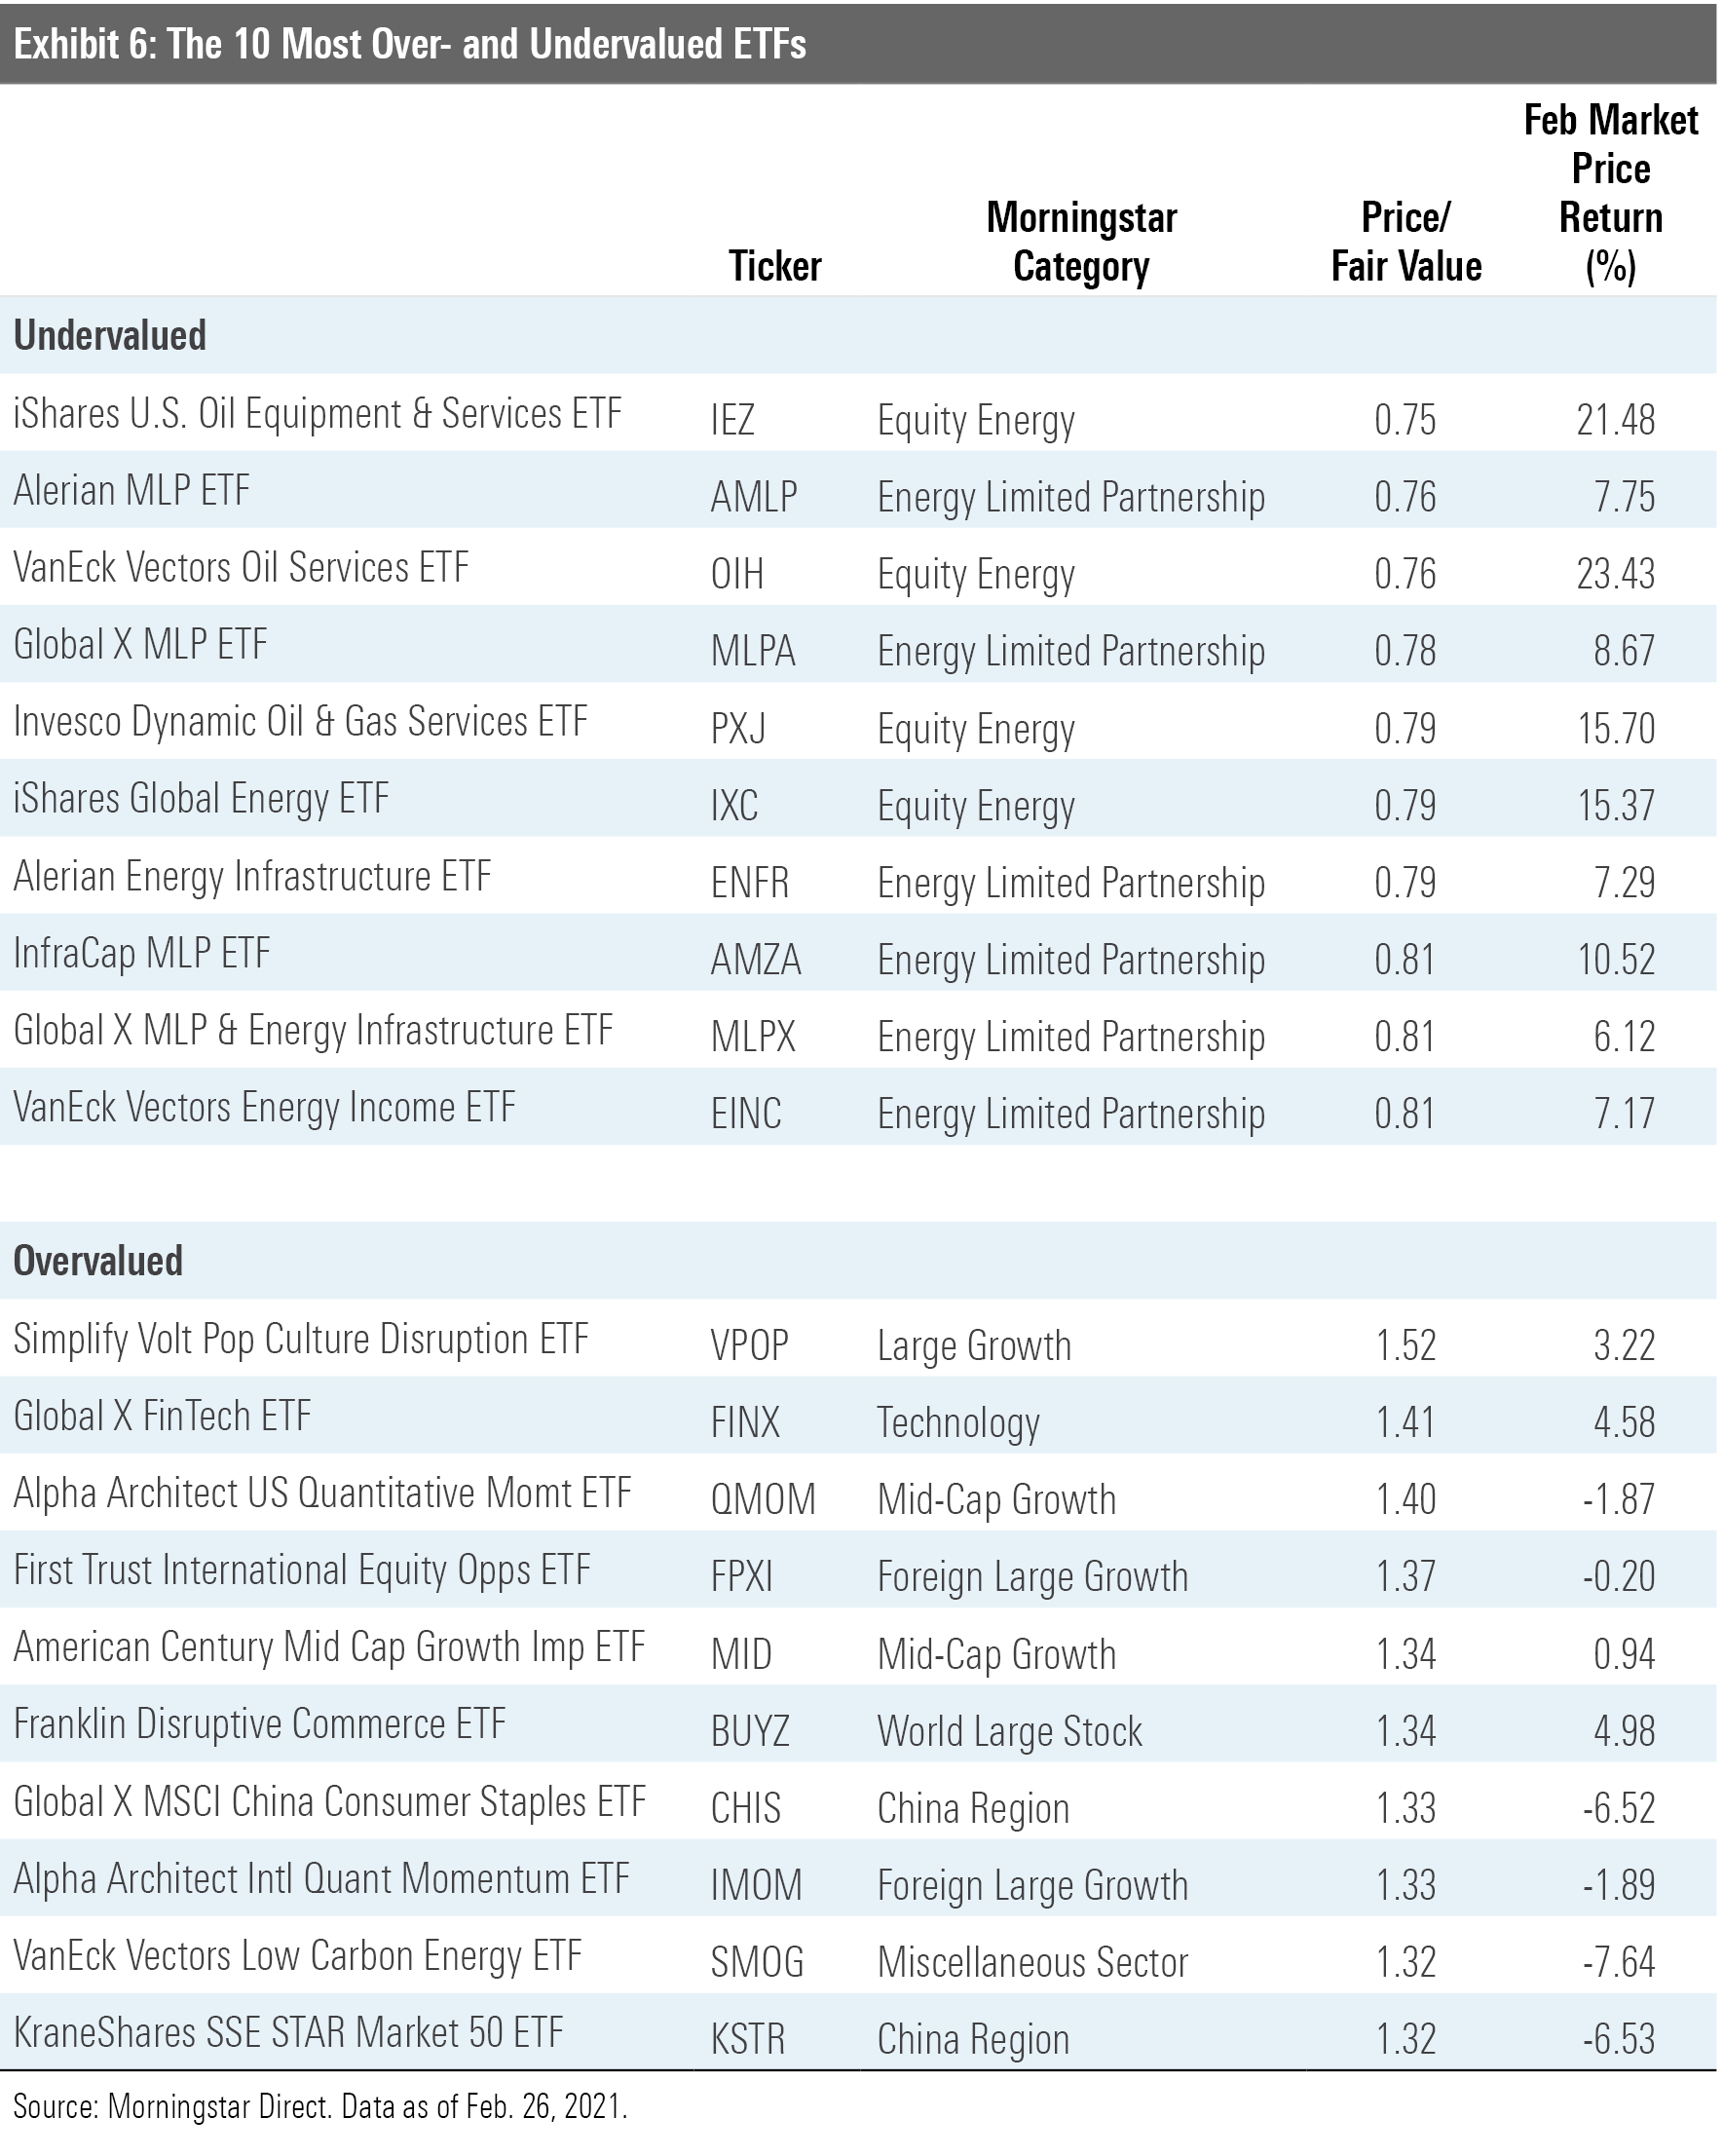
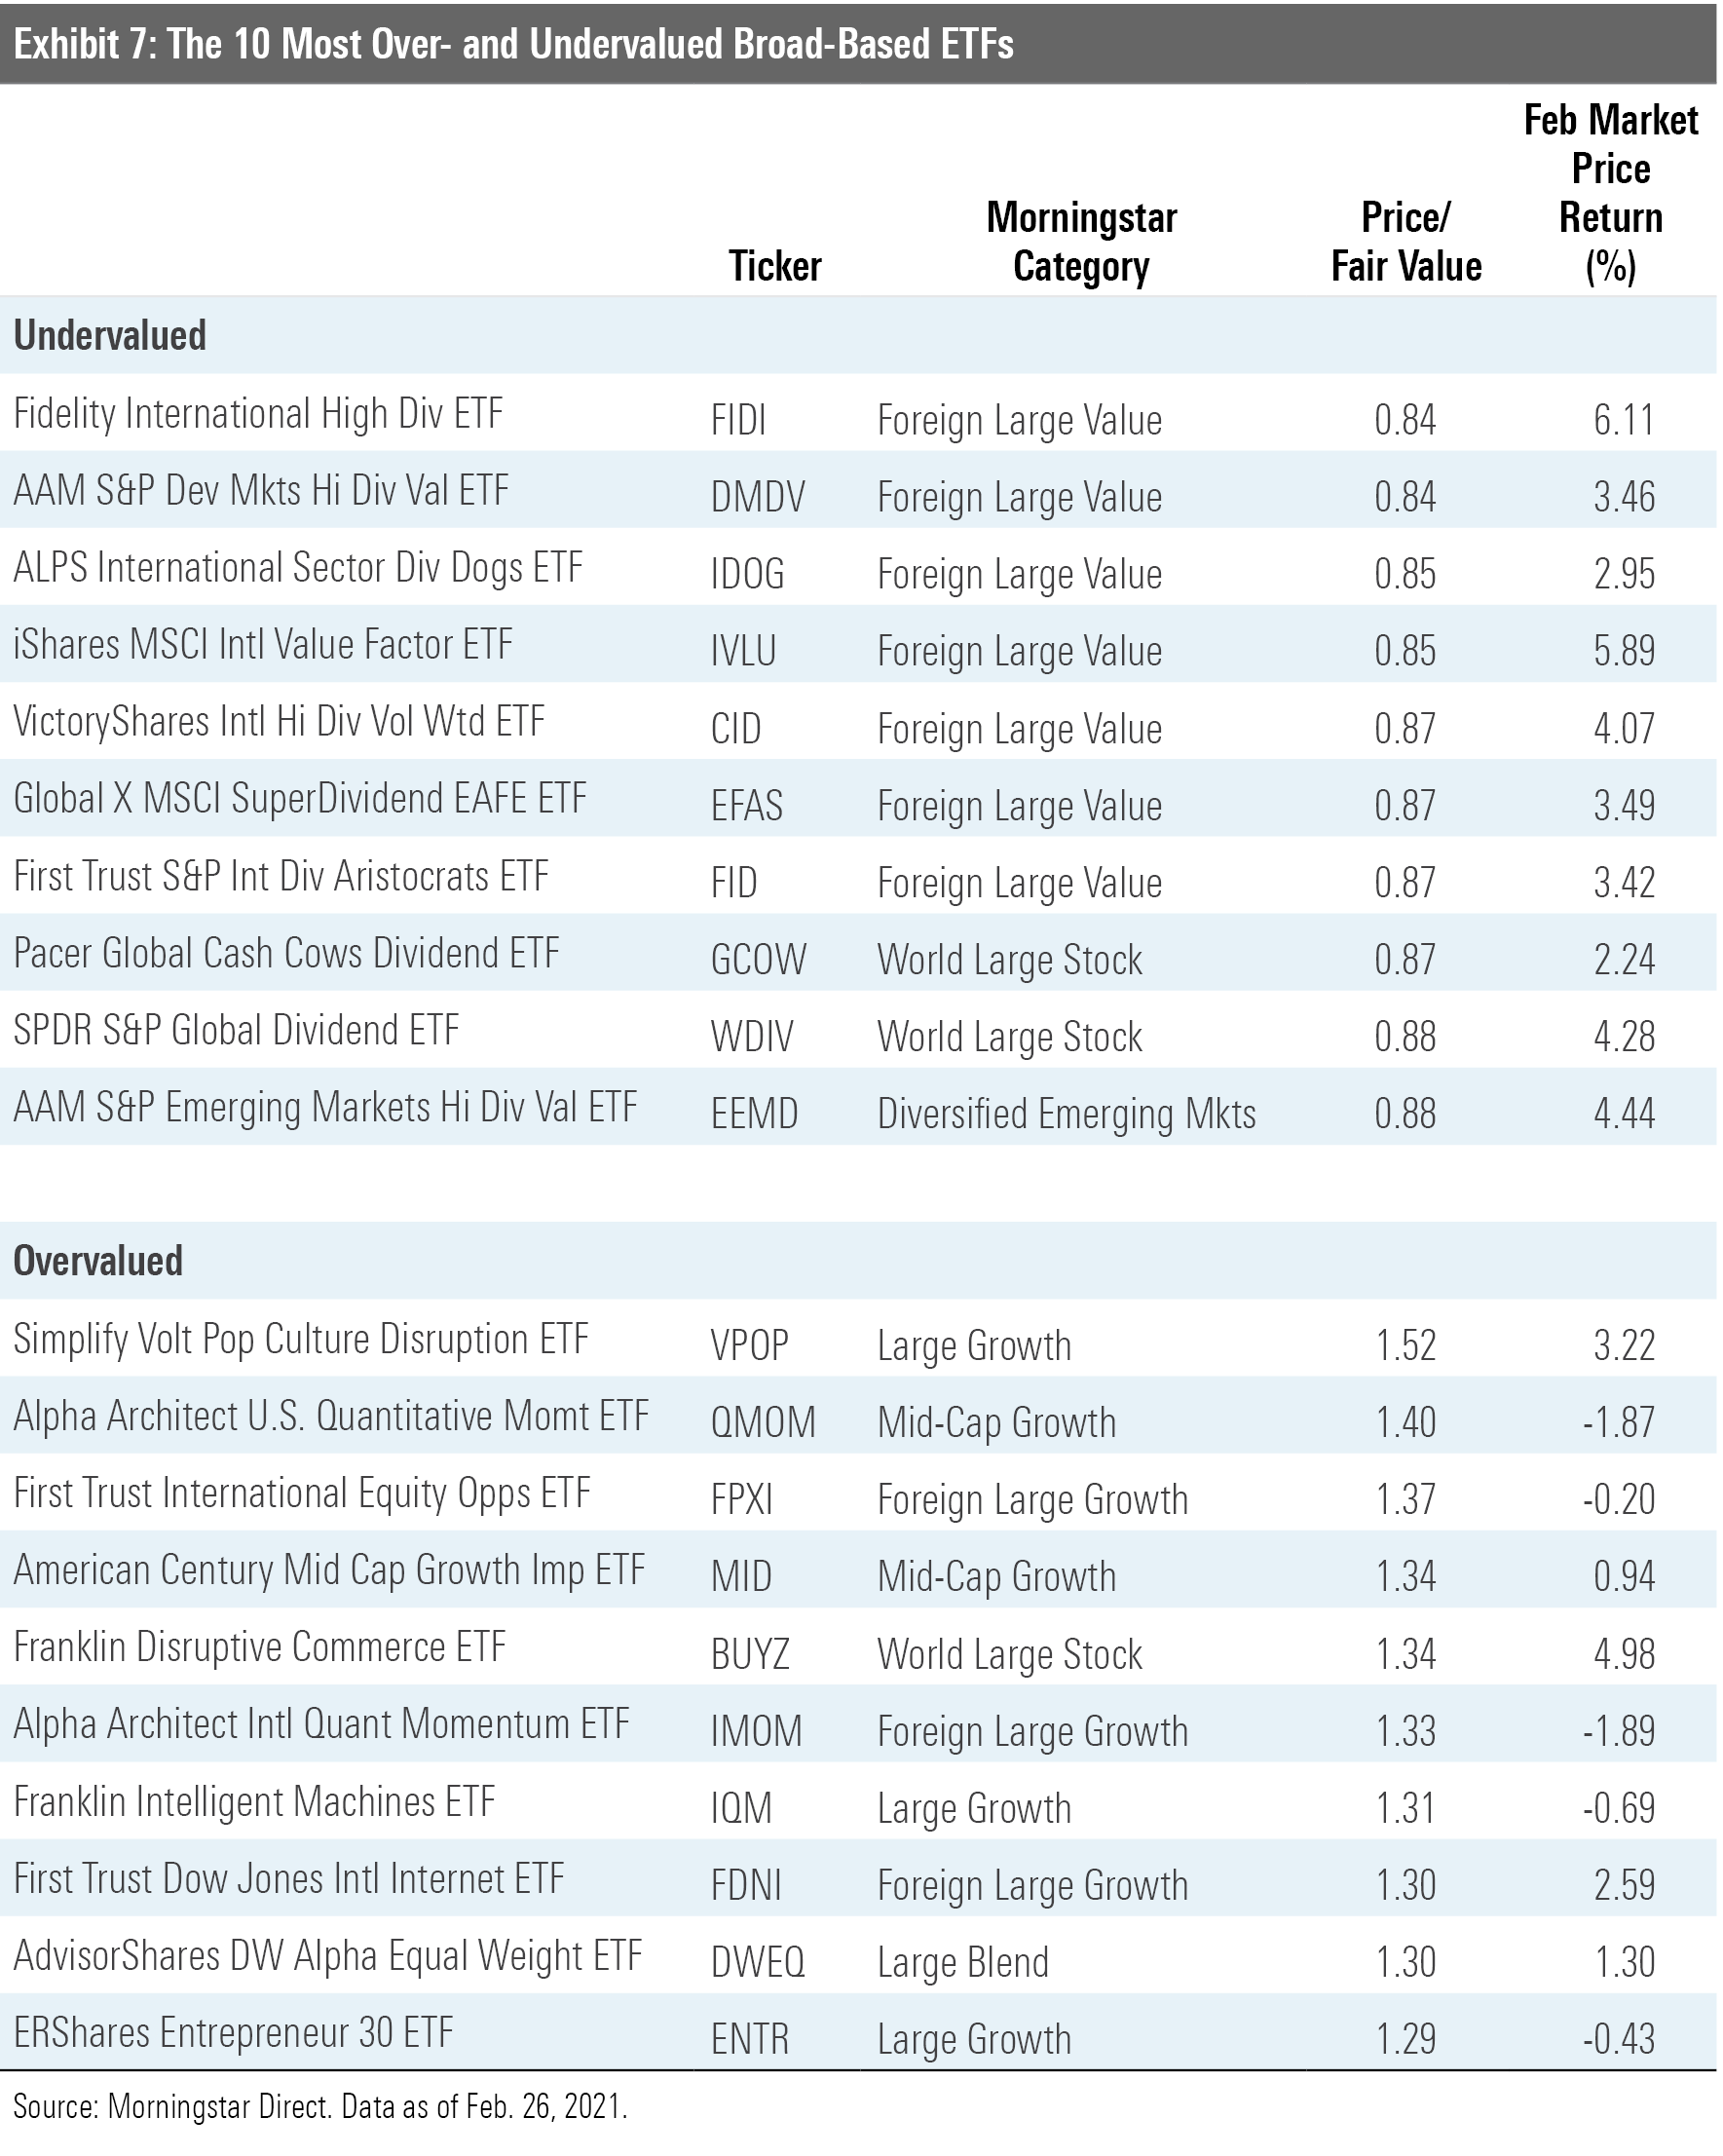
Exhibit 7 features the 10 broad-based ETFs (those belonging to one of the mainline Morningstar Style Box or other broader geographic categories) that were trading at the largest discounts and premiums to their fair value estimates as of month-end. The common thread among all these funds is an orientation toward smaller, cheaper stocks. Eight value-leaning funds that invest exclusively in international stocks made this month's list. Notable among them is iShares MSCI International Value Factor ETF IVLU, the foreign cousin of VLUE. Like its U.S. counterpart, IVLU takes a sector-neutral approach, sweeping in the cheapest stocks within each sector and weighting them based on a combination of their market cap and the strength of their value characteristics. The result is a portfolio with a strong and consistent value orientation.
Two of the 10 most overvalued broad-based ETFs ply momentum strategies--sweeping in the markets' best recent performers. After momentum stocks' recent run, it isn't surprising to see this pair make the list. Alpha Architect U.S. Quantitative Momentum ETF QMOM gained 19.34% over the three months through February, outpacing the Russell Midcap Growth Index (its category index) by more than 13 percentage points. Equally unsurprising is the presence of some thematic ETFs that home in on some of the market darlings of the moment. For example, Franklin Intelligent Machines ETF IQM gained 85.52% during the 12 months through February--nearly double the 46.25% return for the category index, the Russell Midcap Growth. At the end of February, IQM was trading at a 31% premium to its fair value estimate.
Disclosure: Morningstar, Inc. licenses indexes to financial institutions as the tracking indexes for investable products, such as exchange-traded funds, sponsored by the financial institution. The license fee for such use is paid by the sponsoring financial institution based mainly on the total assets of the investable product. Please click here for a list of investable products that track or have tracked a Morningstar index. Neither Morningstar, Inc. nor its investment management division markets, sells, or makes any representations regarding the advisability of investing in any investable product that tracks a Morningstar index.

/d10o6nnig0wrdw.cloudfront.net/04-18-2024/t_34ccafe52c7c46979f1073e515ef92d4_name_file_960x540_1600_v4_.jpg)
/d10o6nnig0wrdw.cloudfront.net/04-09-2024/t_e87d9a06e6904d6f97765a0784117913_name_file_960x540_1600_v4_.jpg)
/cloudfront-us-east-1.images.arcpublishing.com/morningstar/T2LGZCEHBZBJJPPKHO7Y4EEKSM.png)
:quality(80)/s3.amazonaws.com/arc-authors/morningstar/a90ba90e-1da2-48a4-98bf-a476620dbff0.jpg)