
Past Performance Has Been Predictive Lately. Wait, What?
Winning funds have kept on winning while losing funds have continued to lag in recent years. Have the rules changed?
/s3.amazonaws.com/arc-authors/morningstar/550ce300-3ec1-4055-a24a-ba3a0b7abbdf.png)
Which funds have tended to outperform in recent years? The past winners. And which have lagged? The past losers. You heard that right: Past performance has been predictive lately.
Let’s dive into the data. I’m using the Morningstar Rating for funds (also called the “star rating”) as the proxy for past performance because the star ratings are based on funds’ past risk-adjusted returns within their peer groups. Given this, it’s a handy way to assess whether past performance has been predictive--if higher-rated funds have generated better future performance than lower-rated funds, then past performance has been predictive.
Here’s what that picture looks like:
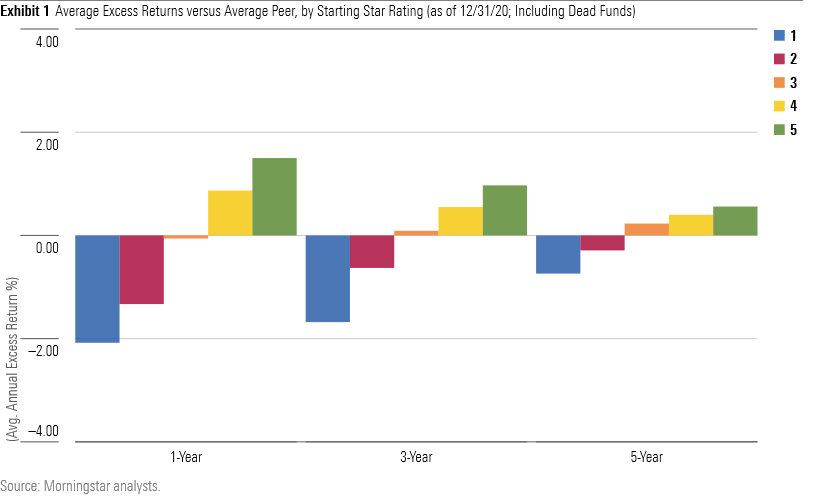
The average highly rated fund has outperformed its average peer over the past one, three, and five years while the average low-rated fund has lagged its average peer. What’s more, the gap between high- and low-rated--that is, between prior leaders and laggards--has been getting wider. That’s evident when we look at the data on a year-by-year basis, shown below:
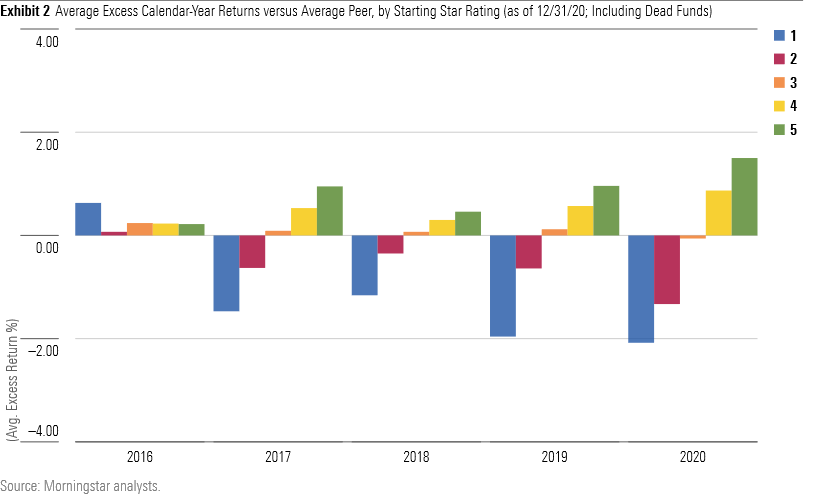
Past performance has gotten more predictive as the years have gone by. In fact, 2020 was one of the best years ever for chasing performance--if you plowed your money into the previous winners at the start of last year and avoided the past losers, that paid off. Which raises a question: What is going on here?
No Pain, No Gain? One possible explanation is that past winners courted more risk than past losers. To examine that, we compared funds' starting and ending star ratings, reasoning that if past winners were indeed taking on more risk, that would show up in their subsequent ratings. (The star rating adjusts funds' returns by the amount of downside volatility they experience.) But that's not what we found.
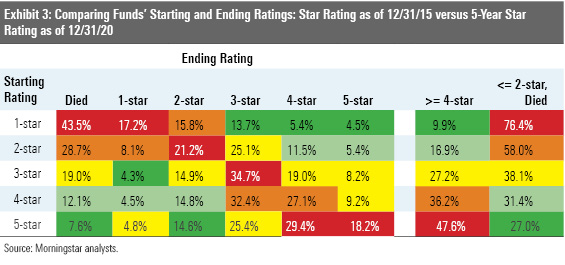
Past winners—that is, funds with 5-star ratings--earned a 4- or 5-star rating over the subsequent five-year period about five times more often than past losers--that is, funds with 1-star ratings. What’s more, past losers subsequently earned a 1- or 2-star rating, or died, about three times more often than 5-star funds. Thus, risk doesn’t seem to explain the performance pattern.
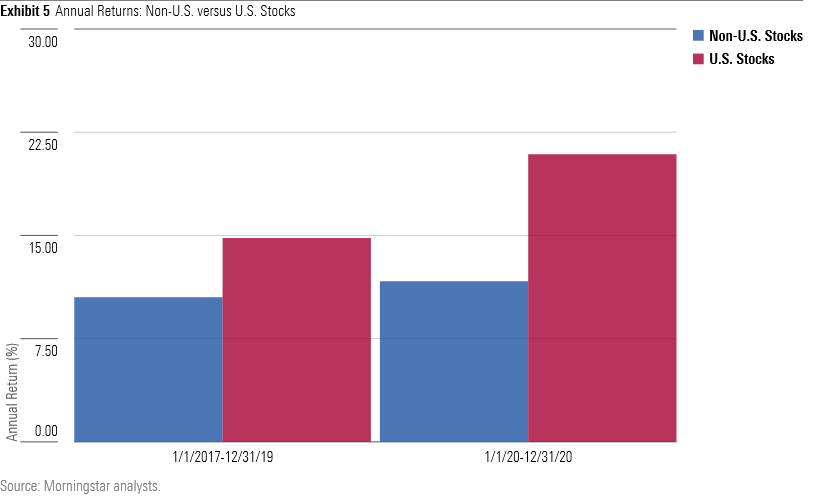
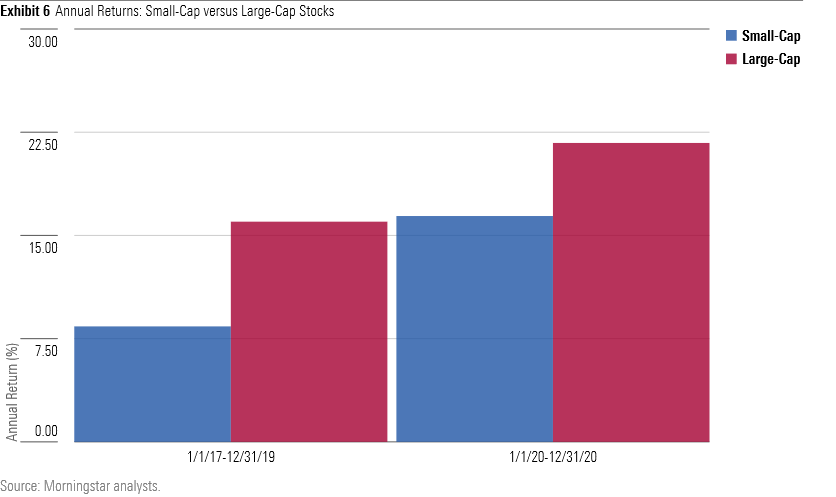
The Trend, Your Friend Rather, the explanation appears to be even more mundane: Performance trends persisted. To illustrate, the following charts compare the returns of major asset classes and styles over two distinct periods—the three-years ended Dec. 31, 2019, and the year ended Dec. 31, 2020. As you can see, the trends that took shape from 2017 to 2019 were only accentuated in 2020.
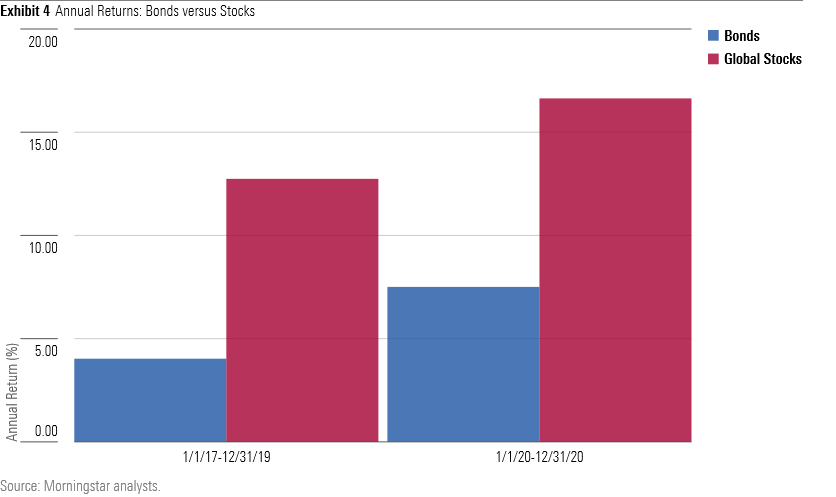
This held not just for the broad stock and bond market indexes, but also for major style and segments, as shown in the charts below.
Persistence = Predictiveness What this meant was that funds that tilted toward the winning areas tended to prevail over those that did the opposite. While the star rating attempts to control for differences like these by ranking funds against others that share similar holdings attributes, narrow gaps can exist even within peer groups. This becomes more evident when we look at the star rating data by asset class, as shown below.
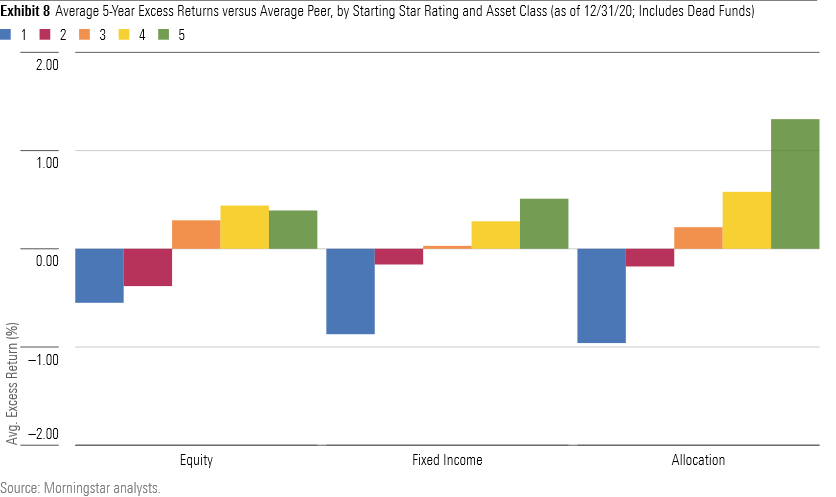
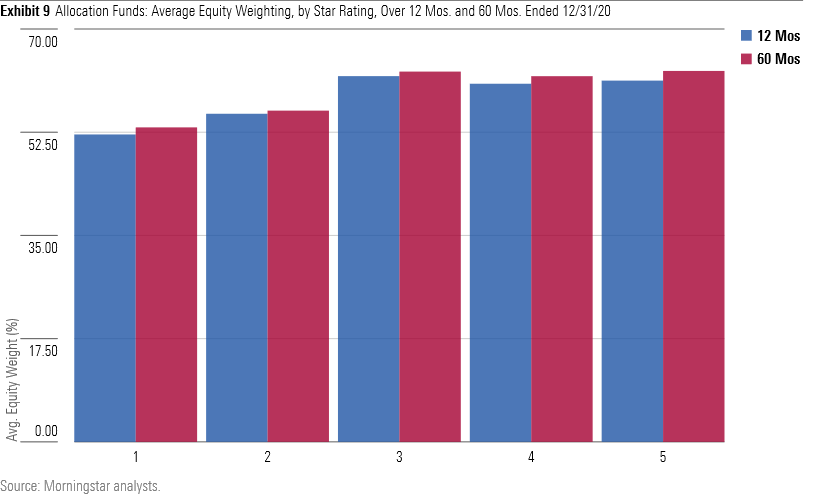
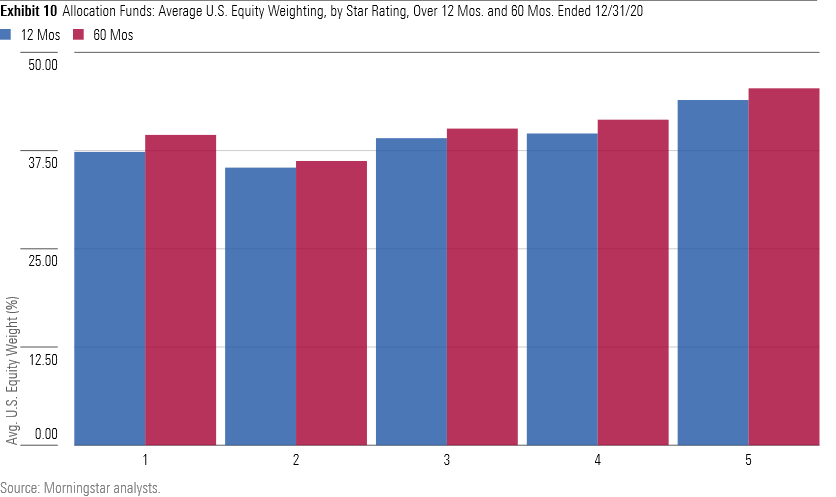
The same basic pattern holds across asset classes, with higher-rated funds subsequently outperforming and lower-rated funds lagging. But it was more pronounced among allocation funds. Upon closer review we found high-rated allocation funds tended to own bigger equity stakes than low-rated allocation funds, as shown below. While the differences weren’t huge, it was still a potentially big swing factor given the degree to which stocks beat bonds.
What’s more, the winning allocation funds tended to own a bigger share of U.S. stocks than non-U.S. stocks, another key differentiator considering domestic equities outgained foreign stocks.
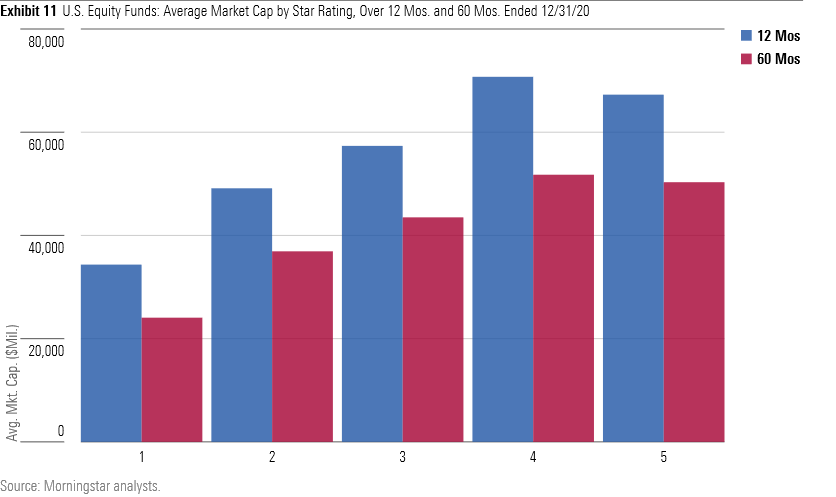
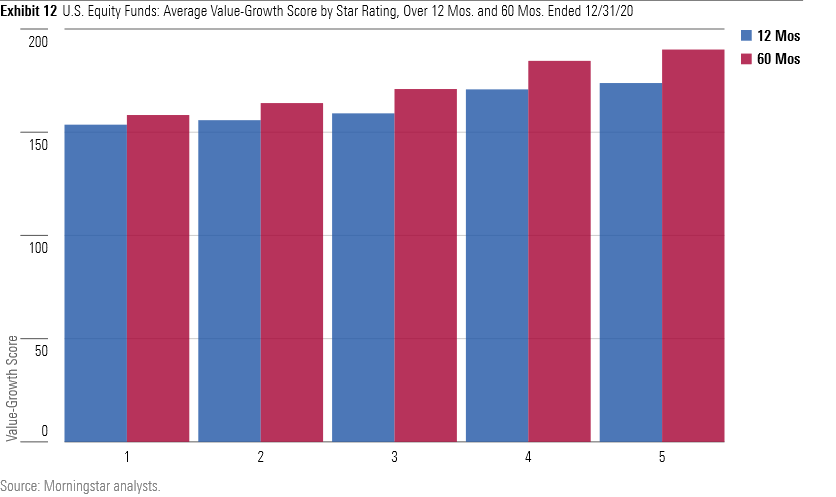
Differences like these can also affect performance in other areas like U.S. equity. For instance, when we examined the average market-caps and value-growth scores of U.S. stock funds, by star rating, we found that high-rated funds tended to sport higher average market caps and tilt more to growth (that is, with a higher value-growth score) than low-rated funds. This mirrors the broader performance trends.
The "Look Ma, No Hands" Market It's probably comforting to investors that past performance has predicted future returns recently. We try to find patterns to make sense of the world, after all. Yet, that's not how markets usually work. Progress isn't linear, setbacks are routine, and that makes trends harder to discern. Investing can be very gratifying and rewarding, but it's usually more a confusing slog than a clarifying walk in the park.
What this means is that investors blindly chasing returns are likely to end up disappointed. (This is why we emphasize that the star rating is a potential starting point for research, not a substitute for it.) True, that hasn’t been the story of recent years and so it’s understandable why some might feel tempted to chase after returns. But regression to the mean is the market’s way of finding equilibrium, and as it plays out formerly reliable trends will dissipate.
What to do? Manage what you can. Focus on actions like setting a plan; building an asset allocation; diversifying widely; keeping costs low; avoiding unnecessary trading; and rebalancing. While performance trends will come and go, these simple steps will ensure you’ve built a portfolio that can withstand the market’s unpredictability, which is something we underestimate when things seem to play out according to plan.
:quality(80)/cloudfront-us-east-1.images.arcpublishing.com/morningstar/T2LGZCEHBZBJJPPKHO7Y4EEKSM.png)
:quality(80)/cloudfront-us-east-1.images.arcpublishing.com/morningstar/HDPMMDGUA5CUHI254MRUHYEFWU.png)