
Digging Into Fidelity Contrafund
We reveal how the fund’s underlying holdings stack up on 11 measures of equity-related risk.
/s3.amazonaws.com/arc-authors/morningstar/360a595b-3706-41f3-862d-b9d4d069160e.jpg)
With $132 billion in assets across its various share classes, Fidelity Contrafund FCNTX ranks as one of the biggest funds in the industry. Manager Will Danoff has been at the helm since 1990 and draws on a deep pool of research from Fidelity’s team of more than 60 domestic-equity analysts. Although Contrafund’s sheer size limits its flexibility to some extent, Danoff continues to follow a growth-driven approach that focuses on finding best-of-breed companies with a sustainable competitive advantage, improving earnings potential, and outstanding management teams.
In this article, I’ll use Morningstar’s Global Risk Model to analyze the underlying characteristics of Contrafund’s equity holdings. Despite its size, the portfolio stands out for its concentrated approach and focus on companies with wide Morningstar Economic Moat Ratings. Danoff’s emphasis on management quality (with a strong preference for founder-led firms) also contributes to the portfolio’s distinctive look.
Under the Hood The fund casts a wide net, with a sprawling portfolio of close to 400 holdings. Danoff keeps portfolio turnover low and often holds on to or gradually adds to positions over many years; for example, he first purchased Amazon.com AMZN in 2007 and Apple AAPL in 2003. He's also willing to take a concentrated approach by loading up on companies that prove their worth; as a result, the top portion of the portfolio is unusually concentrated. The top 15 holdings--including longtime holdings such as Amazon, Facebook FB, Microsoft MSFT, and Berkshire Hathaway BRK.A--account for about 55% of assets. Danoff's pursuit of growth isn't limited to the United States; the fund has about 7.5% of assets allocated to international stocks. Fidelity is a frequent stop for company management teams on tour for IPO roadshows, and the portfolio includes small allocations to several recent IPOs, including Snowflake SNOW, AlloVir ALVR, and Airbnb ABNB.
Judged against the iShares Russell 1000 Growth ETF IWF, the fund's active share (a measure of portfolio overlap) stands at about 46%, indicating that only about half of its holdings replicate the index. That’s down a bit from previous levels, but it still shows clear evidence of active management as opposed to closet indexing.
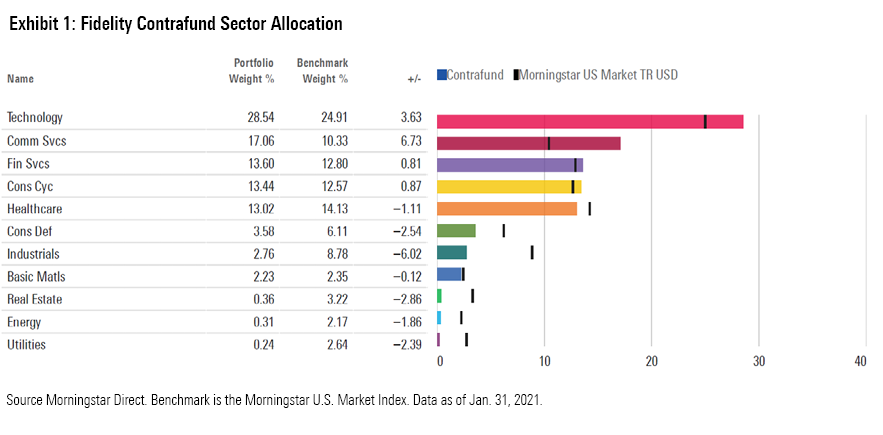
Contrafund’s portfolio has relatively large weightings in technology stocks such as Microsoft, Apple, and Salesforce.com CRM, as well as communications holdings such as Netflix NFLX, Qualcomm QCOM, and Alphabet GOOGL. It’s a bit underweight in more economically sensitive sectors, such as industrials, energy, and utilities. Contrafund’s financials exposure has significantly declined in recent years but remains above average relative to the large-growth Morningstar Category at roughly 14% of assets.
Next, let’s take a deep dive into Contrafund’s holdings using the 11 style-based factors in our Global Risk Model.
How Contrafund's Holdings Stack Up on 11 Different Factors The Morningstar Global Risk Model includes 11 style-based factors that help shed light on a portfolio's underlying risk exposure. Six of the 11 style factors (Valuation, Valuation Uncertainty, Economic Moat, Financial Health, Ownership Risk, and Ownership Popularity) are based on Morningstar's fundamental equity research and extensive ownership data. The other five factors (Liquidity, Size, Value-Growth, Momentum, and Volatility) are traditional risk factors that have been widely studied by academic research. We express each score in terms of the number of standard deviations from the average (also known as a z-score), with a score of zero indicating the average score for a universe of about 7,000 domestic stocks. We set the sign of each exposure so that positive numbers are generally associated with factors that have shown a positive effect on returns over time.
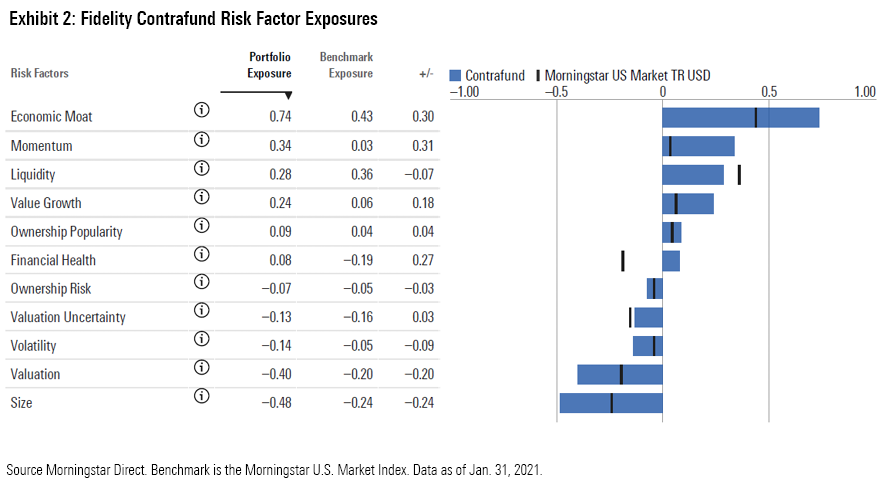
Economic Moat: The Economic Moat factor is based on Morningstar Quantitative Economic Moat Rating, which is designed to measure the strength of a firm's competitive advantage based on the sustainability of its profits. Higher scores suggest a firm will be able to keep competitors at bay for an extended period. Because Danoff specifically targets best-of-breed companies with sustainable competitive advantages, it shouldn't come as a surprise that Contrafund's holdings score well above average on this factor, with a portfolio z-score of 0.74 versus 0.43 for the Morningstar U.S. Market Index. In fact, all but three of Contrafund's top 25 stock holdings (Apple, Vertex Pharmaceuticals VRTX, and T-Mobile TMUS) have wide economic moats in Morningstar's quantitative rating system.
Momentum: The Momentum factor measures how much a stock risen in price over the past year relative to other stocks. Academic research has found that stocks with strong recent performance often continue performing well, at least over shorter periods. Contrafund's holdings score relatively high on Momentum, with a z-score of 0.34 versus 0.03 for the Morningstar U.S. Market Index. This doesn't necessarily reflect an investment strategy geared toward buying momentum stocks, but is more likely a side effect of positive stock-price performance trends for holdings such as NVIDIA NVDA, Cloudflare NET, and Shopify SHOP.
Liquidity: The Liquidity factor measures a stock's average trading volume over the past month relative to total shares outstanding. It's basically a measure of how quickly a stock's ownership base changes hands between different investors. Surprisingly, Contrafund's holdings score slightly lower than the overall market for liquidity, with a z-score of 0.28 versus 0.36 for the Morningstar U.S. Market Index. Contrafund's huge asset base would likely make it difficult to take meaningful positions in more thinly traded stocks. But as mentioned above, Danoff often adds small positions toward the bottom of the portfolio and lets them expand over time. As a result, the portfolio includes some smaller positions in less-liquid shares, such as Clean TeQ Holdings, Sartorius Stedim Biotech SA, and Hansoh Pharmaceutical Group.
Value-Growth: This factor measures value and growth characteristics based on how the market is pricing a stock. If the stock's current price is high relative to a simple price estimate derived from earnings yield, dividend yield, and book value, that suggests the stock has higher growth expectations baked into its current price. On the flip side, a low current price indicates a value leaning. Contrafund's holdings score higher than the overall market on the Value-Growth factor, reflecting higher growth expectations for holdings such as Apple, Netflix, and The Home Depot HD.
Ownership Popularity: The Ownership Popularity factor represents changes in popularity of a particular stock from the perspective of fund manager ownership. High Ownership Popularity scores indicate that more fund managers have been increasing their positions in the stock over the past several months. Contrafund's holdings rank slightly above average based on this metric, with a z-score of 0.09 versus 0.04 for the Morningstar U.S. Market Index. However, most of its larger holdings rank toward the middle of the road on popularity, suggesting that it's neither chasing trends nor following a strong contrarian strategy.
Financial Health: The Financial Health factor is based on strength of a firm's balance sheet. Higher scores imply stronger financial health and therefore a lower risk of bankruptcy. Stocks that score well based on this factor tend to hold up better during economic downturns, such as the global financial crisis in 2008. Contrafund's holdings score well above average on Financial Health, with an average z-score of 0.08 versus negative 0.19 for the Morningstar U.S. Market Index. Nearly all of the fund's holdings have decent Financial Health scores, with only a few exceptions in smaller holdings such as PG&E Corp. PCG and American International Group AIG.
Ownership Risk: The Ownership Risk factor defines a stock's risk level based on the company it keeps. We gauge Ownership Risk by looking at the risk profiles of the funds that own shares in the same security. If funds owning the stock tend to have high risk profiles, we assign a higher Ownership Risk score. Contrafund's holdings are roughly in line with the broader equity market based on this metric, despite small weightings in areas that tend to be owned by funds with higher risk profiles, such as companies in the precious metals and mining industries.
Valuation Uncertainty: The Valuation Uncertainty factor is based on Morningstar's Quantitative Uncertainty Rating and measures the level of uncertainty embedded in a company's Quantitative Fair Value Estimate. Companies with less consistent operating earnings and capital spending tend to have less-stable cash flows, making it more difficult to pin down an estimated fair value. Higher scores imply greater uncertainty with a wider range of potential valuation outcomes. By extension, portfolios with high scores for Valuation Uncertainty tend to have more volatility in returns. Contrafund's holdings have a portfolio z-score of negative 0.13 for Valuation Uncertainty versus negative 0.16 for the Morningstar U.S. Market Index.
Volatility: Our Volatility factor is based on a stock's range of historical prices over the past year. Contrafund's holdings score below average for Volatility, with a z-score of negative 0.14 versus negative 0.05 for the Morningstar U.S. Market Index. The portfolio is heavily weighted toward less-volatile names such as Microsoft, Berkshire Hathaway, and Costco Wholesale COST, with higher-volatility holdings like Tesla TSLA and CrowdStrike Holdings CRWD occupying much smaller positions.
Valuation: The Valuation factor measures how cheap or expensive a stock is relative to Morningstar's Quantitative Fair Value Estimate, a statistical estimate of fair value based on a company's projected future cash flows. Higher scores indicate the company is undervalued and more likely to generate positive future returns. Contrafund scores well below average on this metric, with a z-score of negative 0.40 versus negative 0.20 for the Morningstar U.S. Market Index. This reflects Danoff's preference for companies with strong and improving earnings, as opposed to inexpensive stocks that are cheap for a reason.
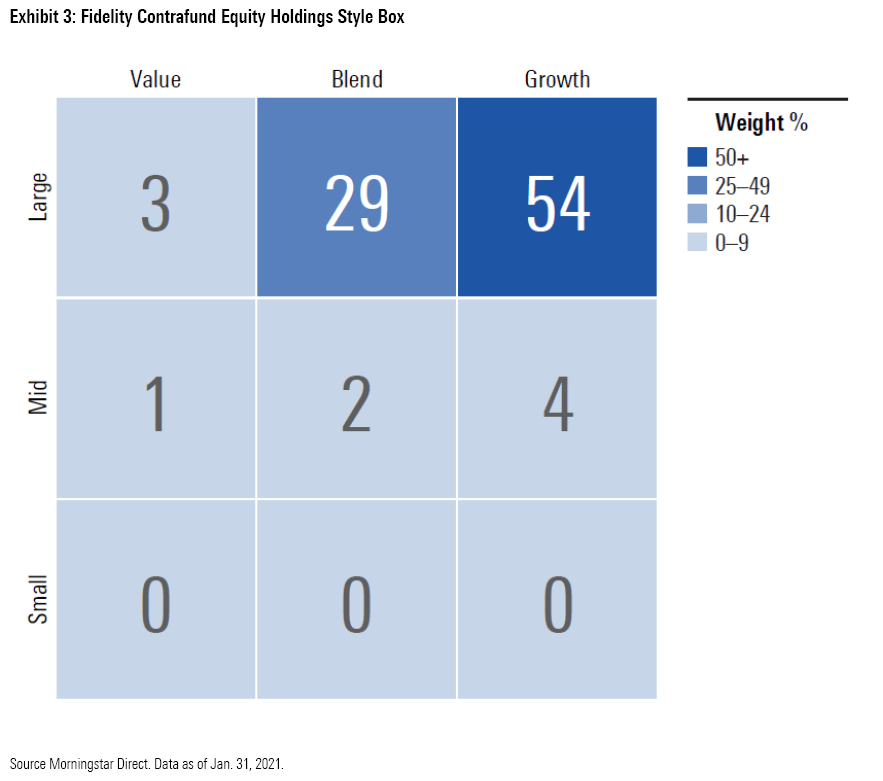
Size: The Size factor is based on the market capitalization of the stocks included in a portfolio, with higher scores indicating more exposure to smaller-cap stocks. Academic research has found that smaller-cap stocks tend to outperform over longer periods, although larger-cap names have taken a strong lead in the past decade. Contrafund's huge asset base makes it nearly impossible for it to take meaningful positions in smaller-cap stocks, so it shouldn't come as a surprise that almost none of its holdings land in the small-cap row of the Morningstar Style Box and only 7% of the portfolio lands in mid-cap territory. Instead, nearly all of the holdings land in the large-growth and large-blend squares.
Conclusion As Contrafund has grown, it has been forced to evolve. Its average market cap has climbed, and the number of portfolio holdings has expanded. Its performance has also landed more toward the middle of the pack in recent years--a step down from its glory days in the 1990s, when it trounced the market on a more regular basis. Still, the fund's long-term record over Danoff's entire tenure remains impressive. Its distinctive portfolio is also a testament to Fidelity's extensive research resources and commitment to active management.
/cloudfront-us-east-1.images.arcpublishing.com/morningstar/ZKOY2ZAHLJVJJMCLXHIVFME56M.jpg)
/cloudfront-us-east-1.images.arcpublishing.com/morningstar/IGTBIPRO7NEEVJCDNBPNUYEKEY.png)
/cloudfront-us-east-1.images.arcpublishing.com/morningstar/HDPMMDGUA5CUHI254MRUHYEFWU.png)
:quality(80)/s3.amazonaws.com/arc-authors/morningstar/360a595b-3706-41f3-862d-b9d4d069160e.jpg)