
It Was Business as Usual for ETF Investors in January
While meme stocks were making headlines, new money continued to pour into broadly diversified, low-cost index ETFs.
/s3.amazonaws.com/arc-authors/morningstar/a90ba90e-1da2-48a4-98bf-a476620dbff0.jpg)
Global stock markets stumbled out of the gate to start the new year. The Morningstar Global Markets Index--a broad gauge of global equities--dipped 0.31% in January 2021. Bonds slipped, too. The Morningstar U.S. Core Bond Index declined 0.74%, as rising yields pushed bond prices lower.
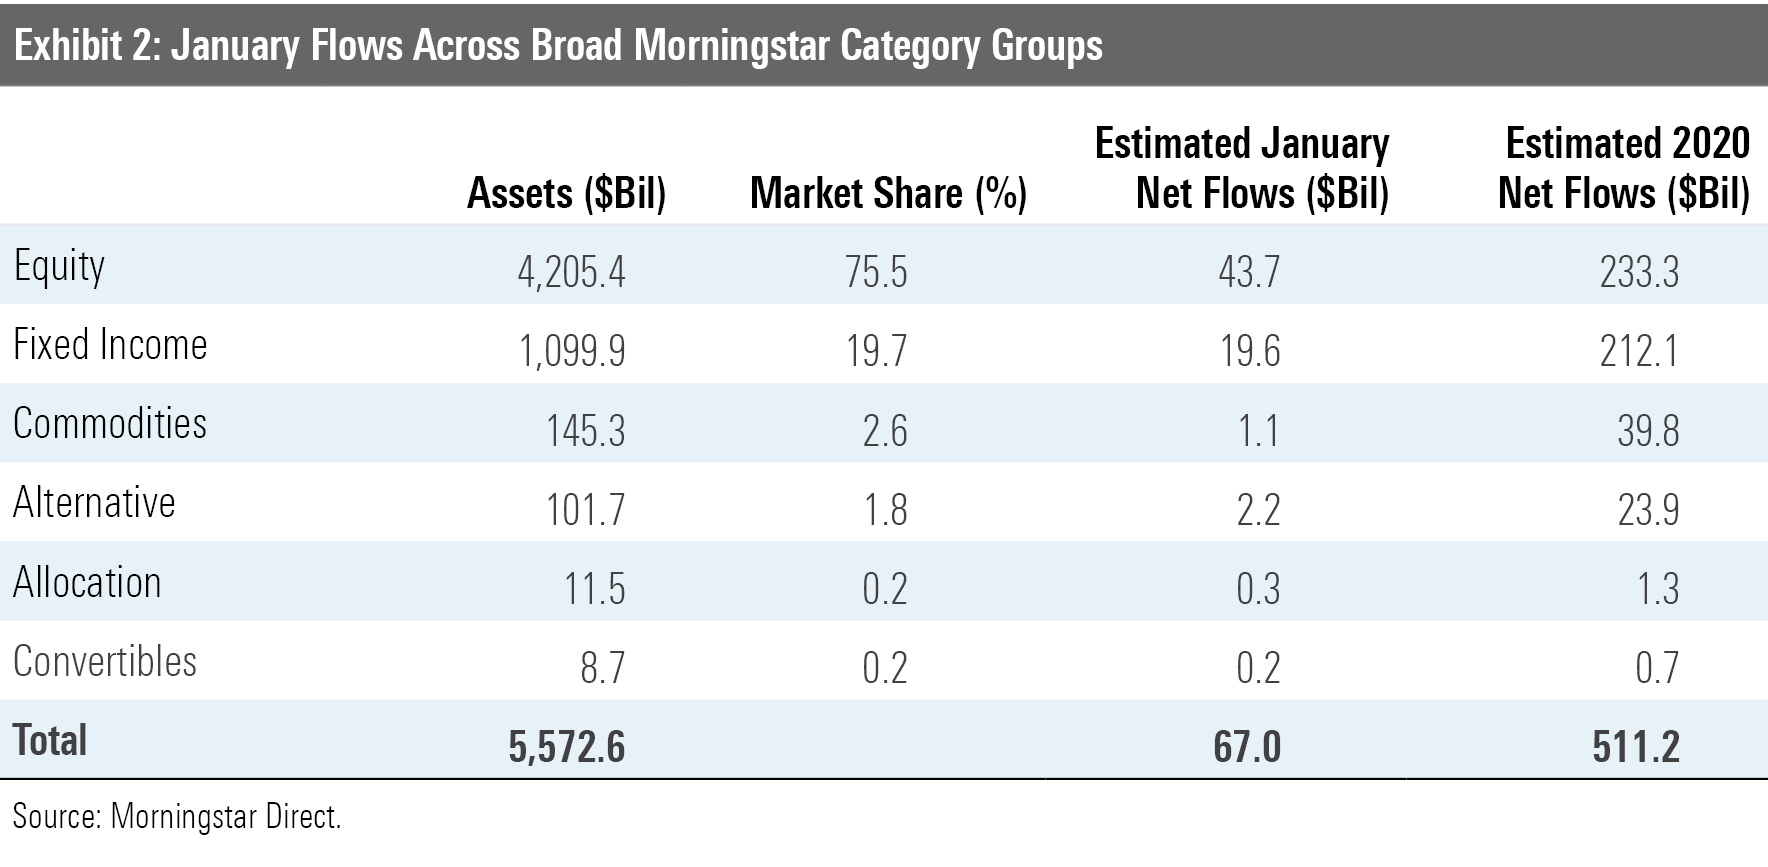
Bond exchange-traded funds captured the majority of inflows for much of 2020, but recently flows have favored stocks. After allocating a record $88.1 billion to equity ETFs in November and another $43.8 billion in December, investors poured $43.7 billion into these funds in January.
Here, I will take a closer look at how major asset classes performed last month, where investors were putting their money, and which segments of the market looked cheap and dear at month's end--all through the lens of ETFs.
Stocks Look a Bit Rich Exhibit 1 features January performance figures for a sampling of ETFs with Morningstar Analyst Ratings serving as proxies for major asset classes. Investors in a blended global market portfolio lost 0.43% during the month. At the end of January, U.S. stocks, represented here by iShares Core S&P Total U.S. Stock Market ETF ITOT, were trading 7% above their fair value, as measured by the fund's Morningstar price/fair value estimate. Foreign stocks don't appear as fully valued. Foreign developed stocks, proxied by iShares Core MSCI EAFE ETF IEFA, slipped 0.74% and were trading a shade below fair value at month's end. Emerging-markets stocks, embodied here by iShares Core MSCI Emerging Markets ETF IEMG, gained nearly 3% in January, landing 3% above fair value.
While large caps languished, small caps were still sizzling. IShares Core S&P Small-Cap ETF IJR gained 6.17% and ended the month trading at a 5% premium to its Morningstar fair value estimate. IJR spent most of 2020 trading at a considerable discount.
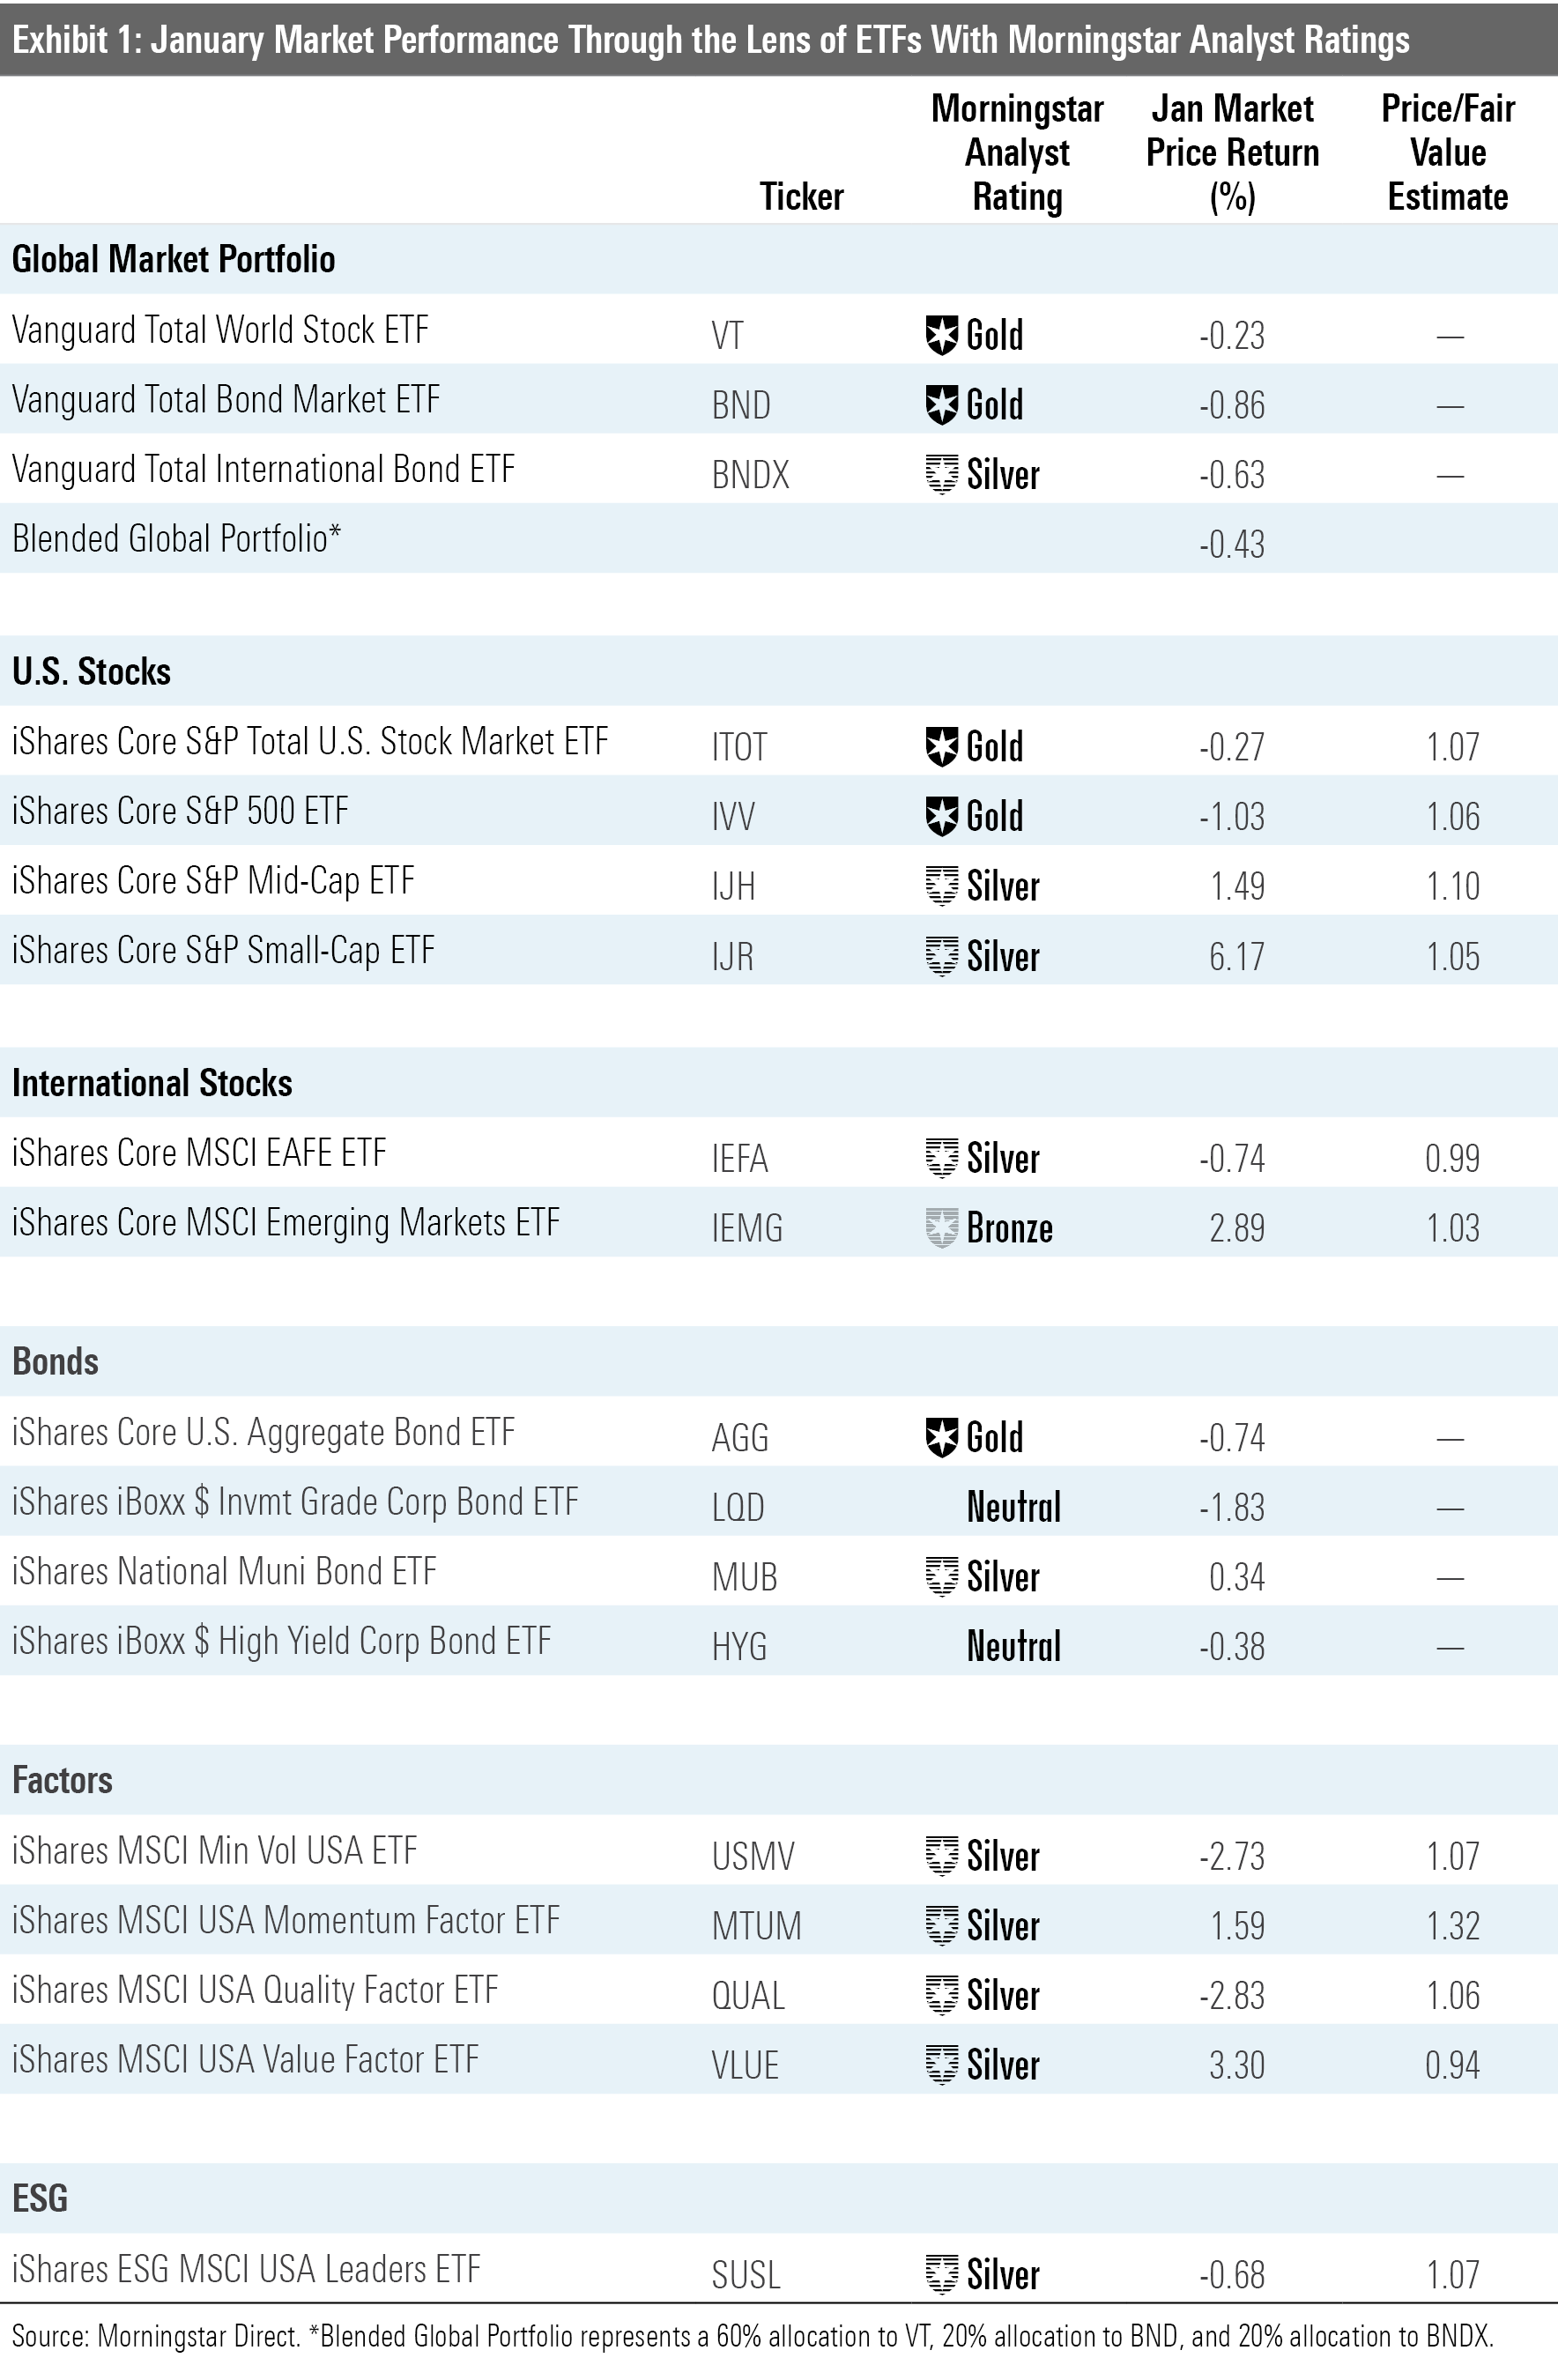
U.S. small caps have been on a tear over the past three months. IJR outgained IVV by nearly 22 percentage points during this stretch. Favorable stock exposure in the consumer discretionary and technology sectors have been the biggest contributors to IJR's recent turnaround. It is worth noting that the largest single-stock contributor to the fund's performance over this period was GameStop GME. The world's favorite meme stock spiked more than 3,000% in this time frame. At the end of January, it represented just over 1% of IJR's portfolio.
The performance spread between small-cap value and large-cap growth stocks over this same three-month period approximated the broader small versus large gap. The Morningstar US Small Value Index gained nearly 31% over the trailing three months, while the Morningstar US Large Growth Index was up by about 13%.
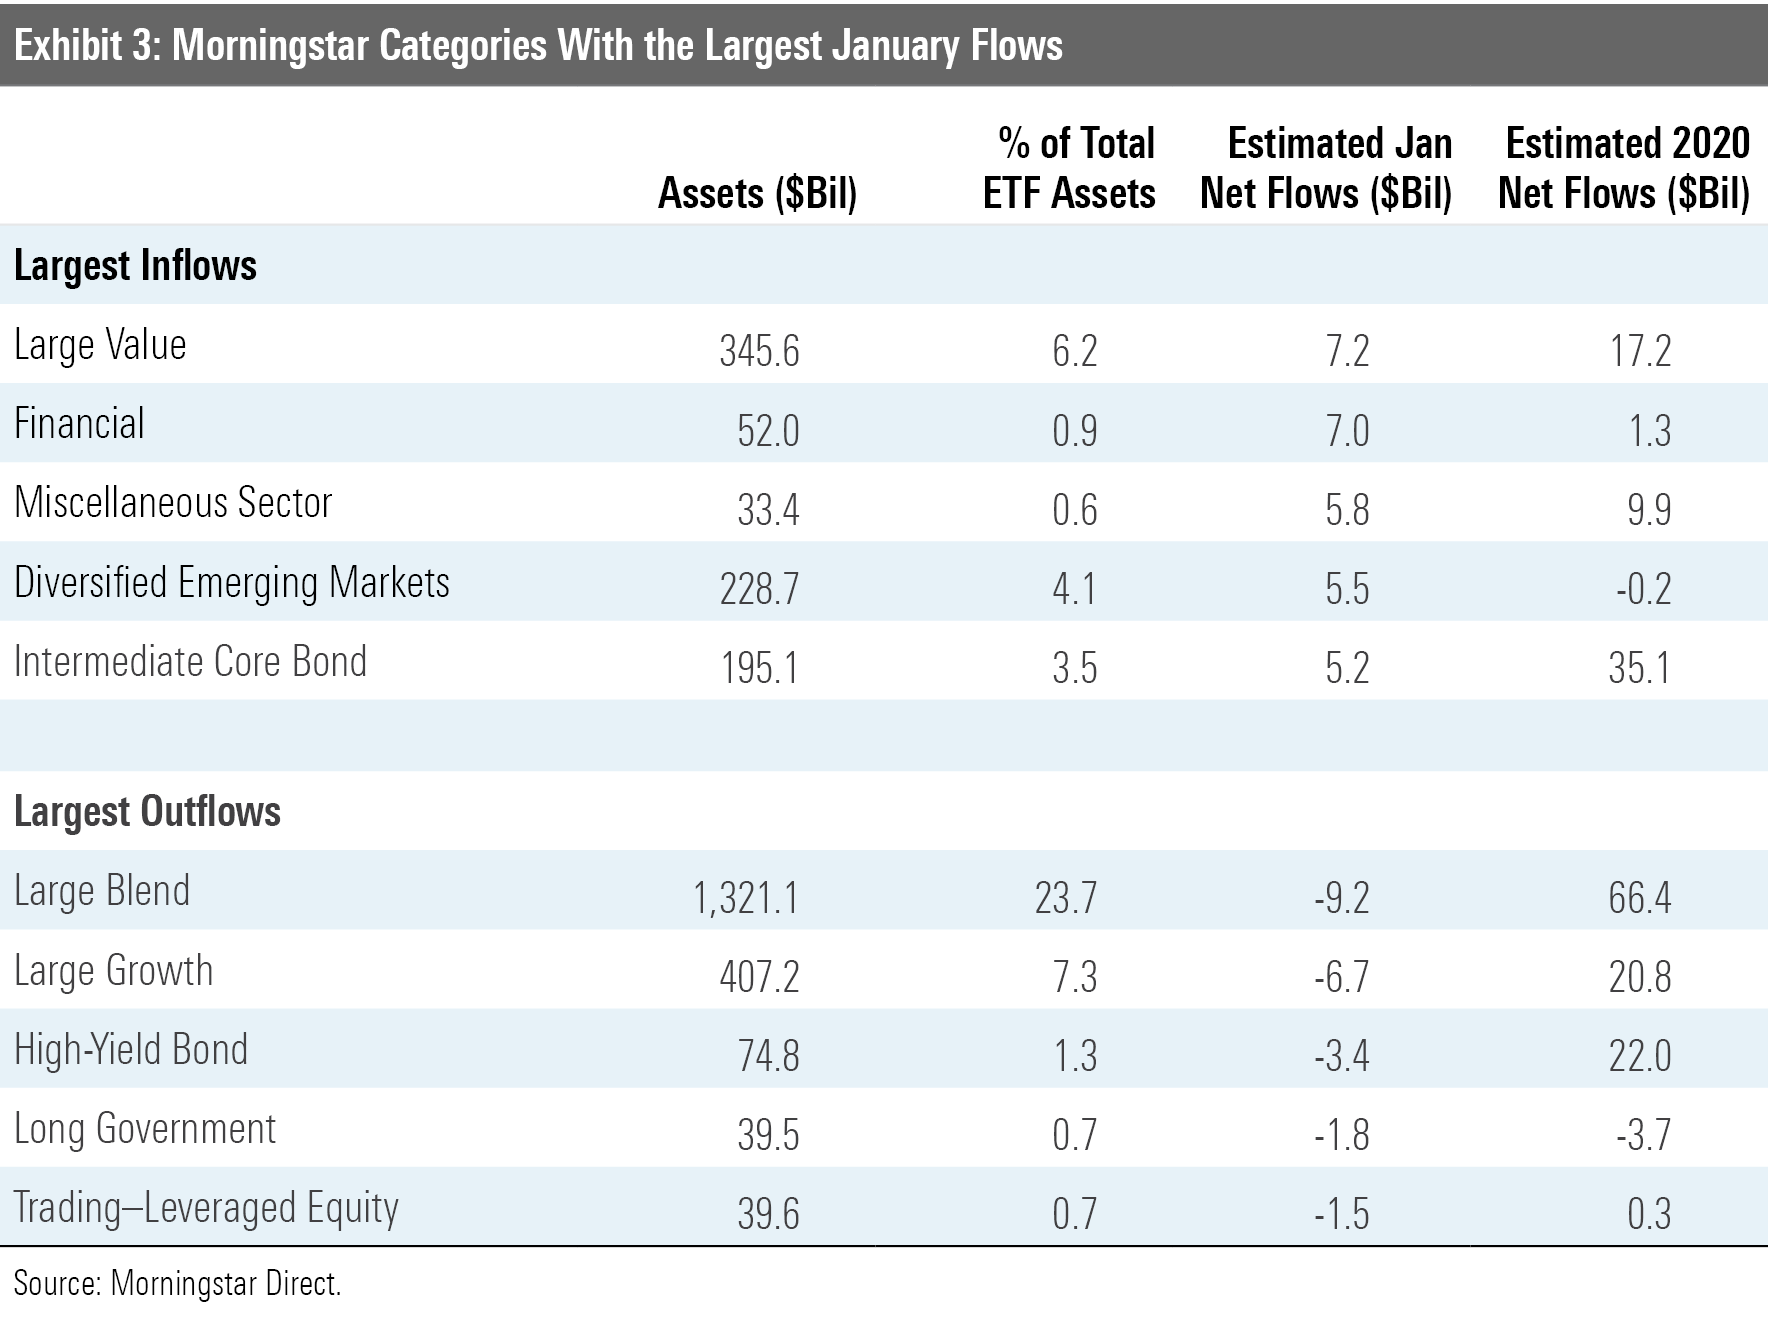
Investors have taken note of value stocks' resurgence. ETFs in the large-, mid-, and small-value Morningstar Categories found more buyers in January. Just over $10 billion flowed into these funds last month. These ETFs have gathered nearly $27 billion in net new assets in the past three months after having been largely ignored by investors for most of 2020.
The dispersion of returns and valuation spreads among single-factor strategic-beta ETFs speaks to the forces that have defined stock markets of late. For example, iShares MSCI USA Value Factor ETF VLUE lagged ITOT by more than 13 percentage points over the 12 months through January. But VLUE has been scratching its way back. Over the past three months, it outperformed ITOT by 7 percentage points. As a result, the value stocks in VLUE's portfolio have begun to look like less of a bargain. VLUE finished October trading 21% below its fair value. By the end of January, that discount had narrowed to 6%.
On the other hand, iShares MSCI USA Momentum Factor ETF MTUM outperformed ITOT by more than 6 percentage points over the past year. At the end of January, the fund was trading at a 32% premium to its fair value estimate. At the end of October, MTUM was trading 20% above its fair value.
Value and Financials Were in Vogue Stock ETFs soaked up the most flows in January. Investors were selective, favoring large-cap value and financials ETFs. The former have gotten more love lately as investors have positioned themselves for a potential value comeback. The latter tend to see increased interest when interest rates increase--which bodes well for banks. Large-growth and long government bond ETFs got the short end of this stick. Both categories landed among the five with the largest January outflows as value returned to favor and rates ticked higher.
The ETFs with the biggest January inflows were a motley crew. Within their ranks were portfolio staples like Vanguard Total Stock Market ETF VTI and iShares Core Total USD Bond Market ETF IUSB as well as more high-flying fare like Ark Innovation ETF ARKK and iShares Global Clean Energy ETF ICLN.
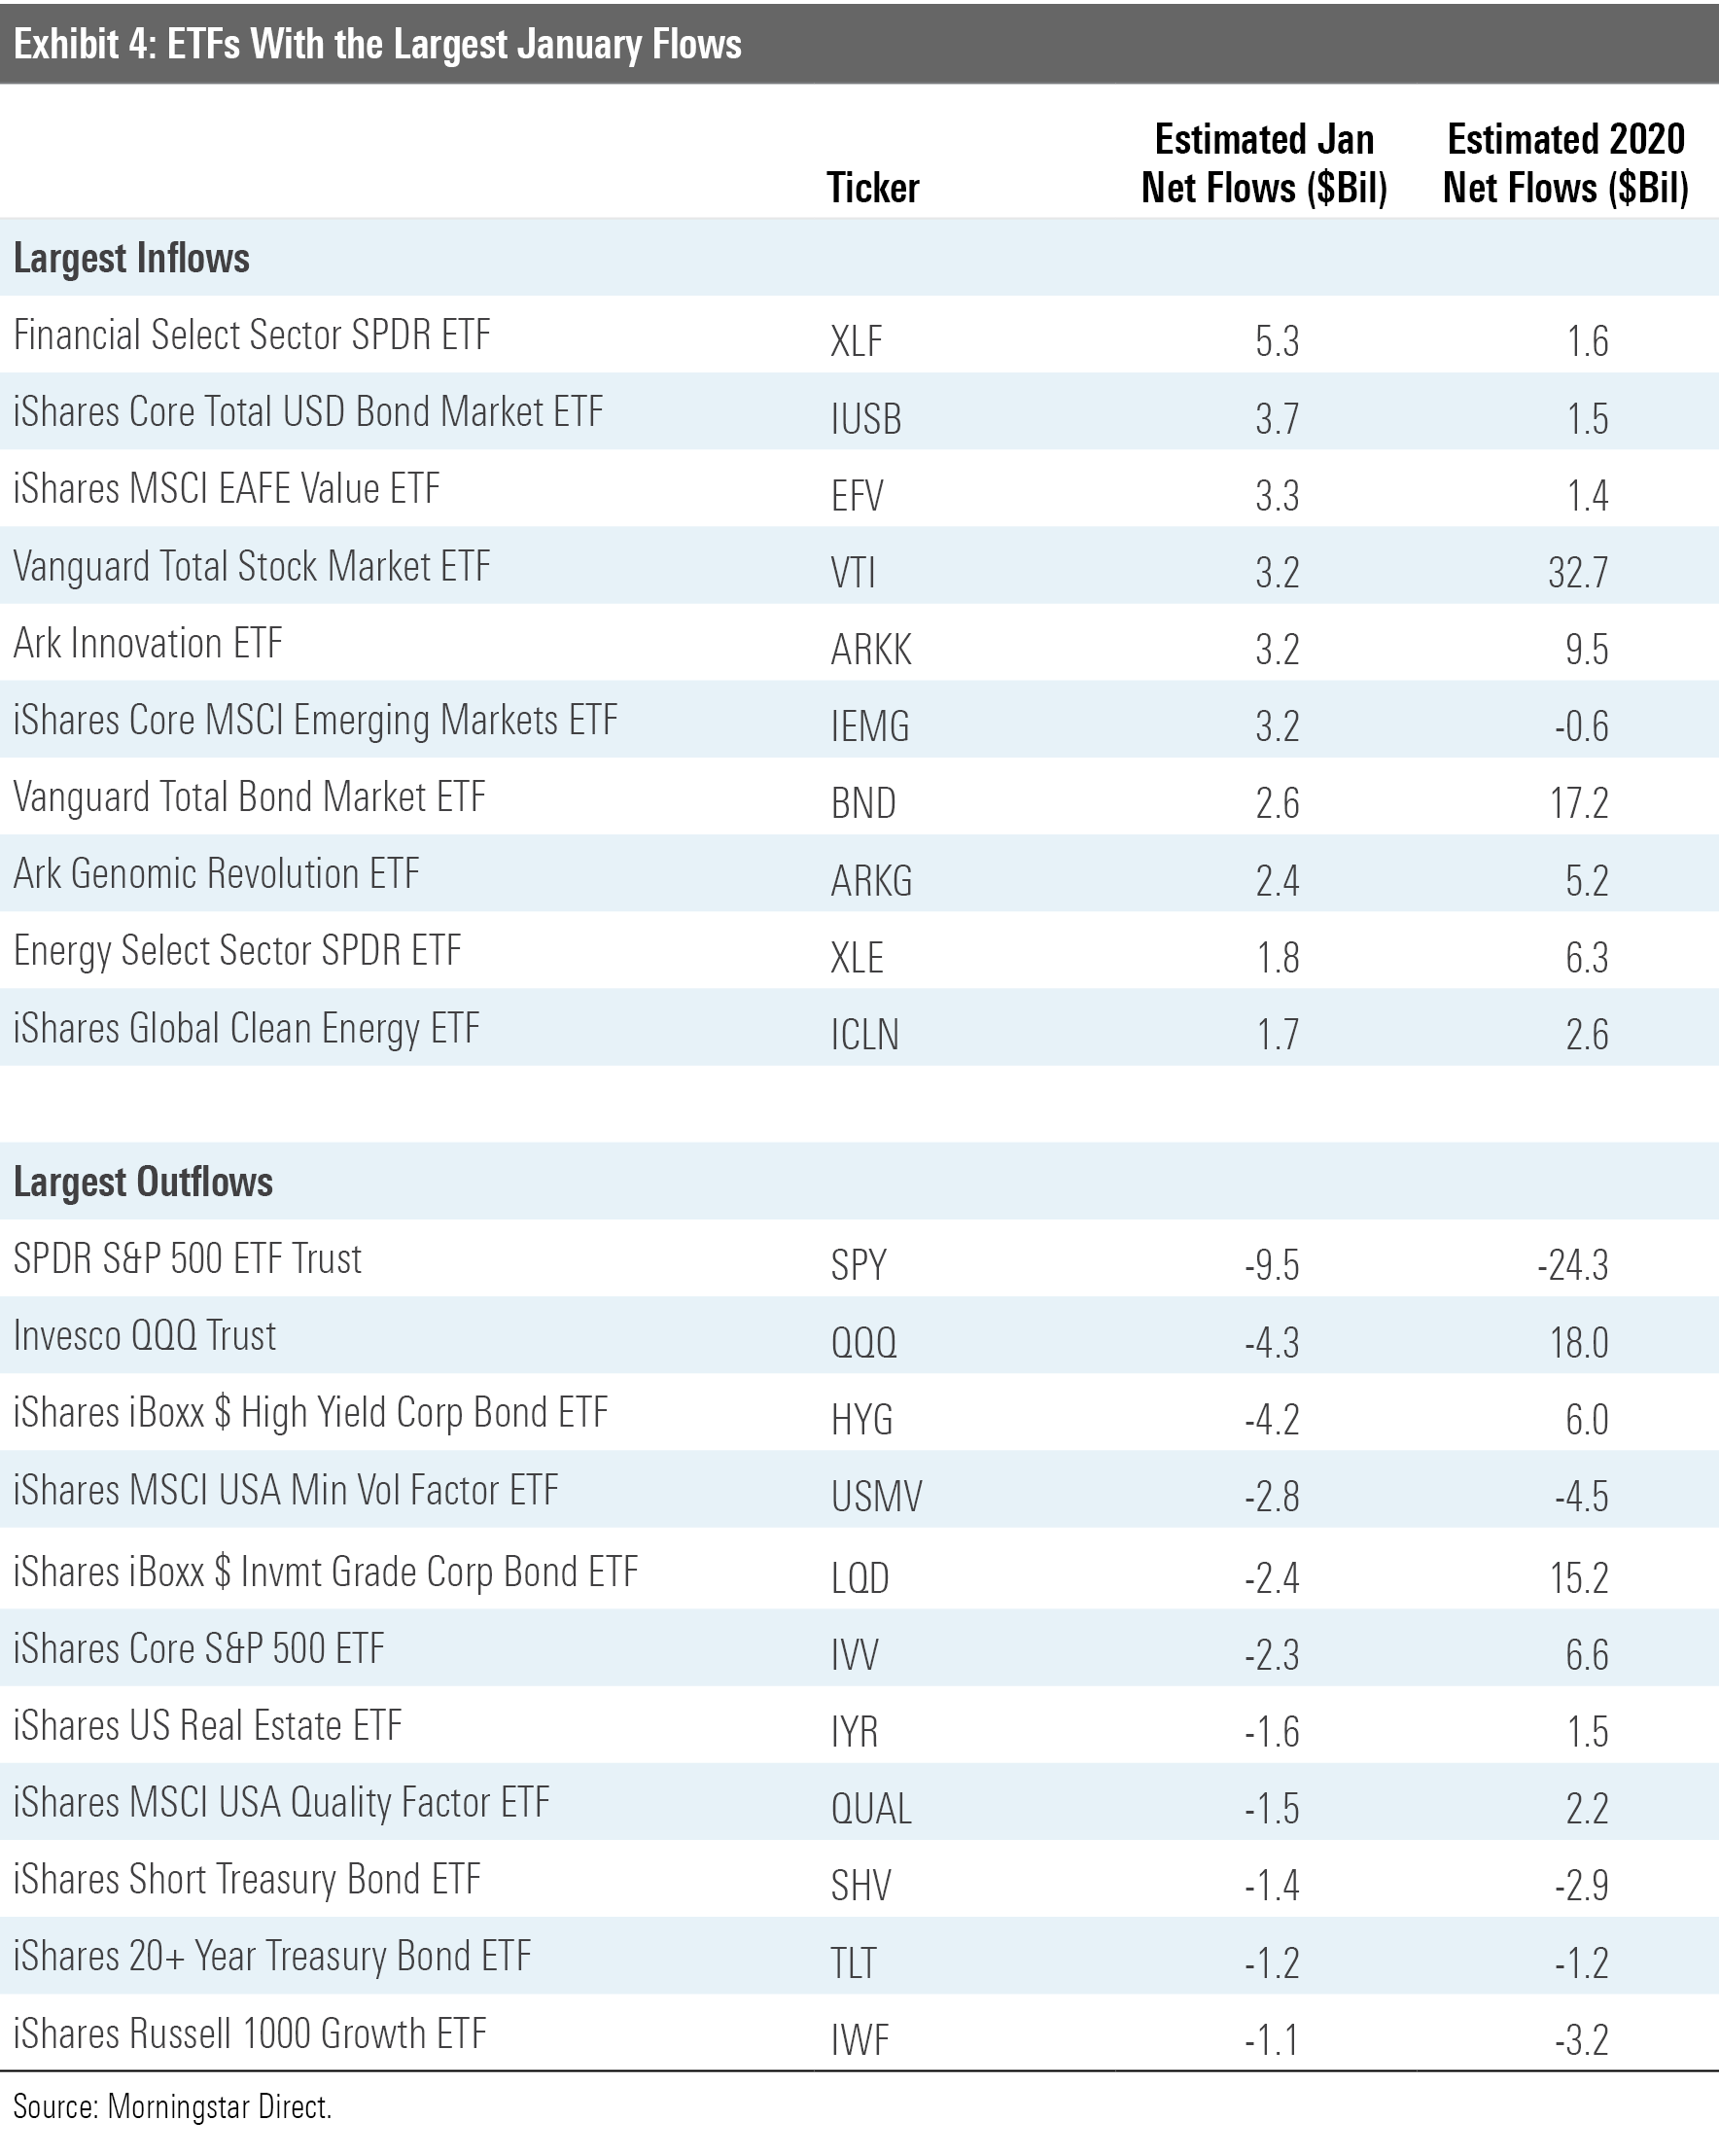
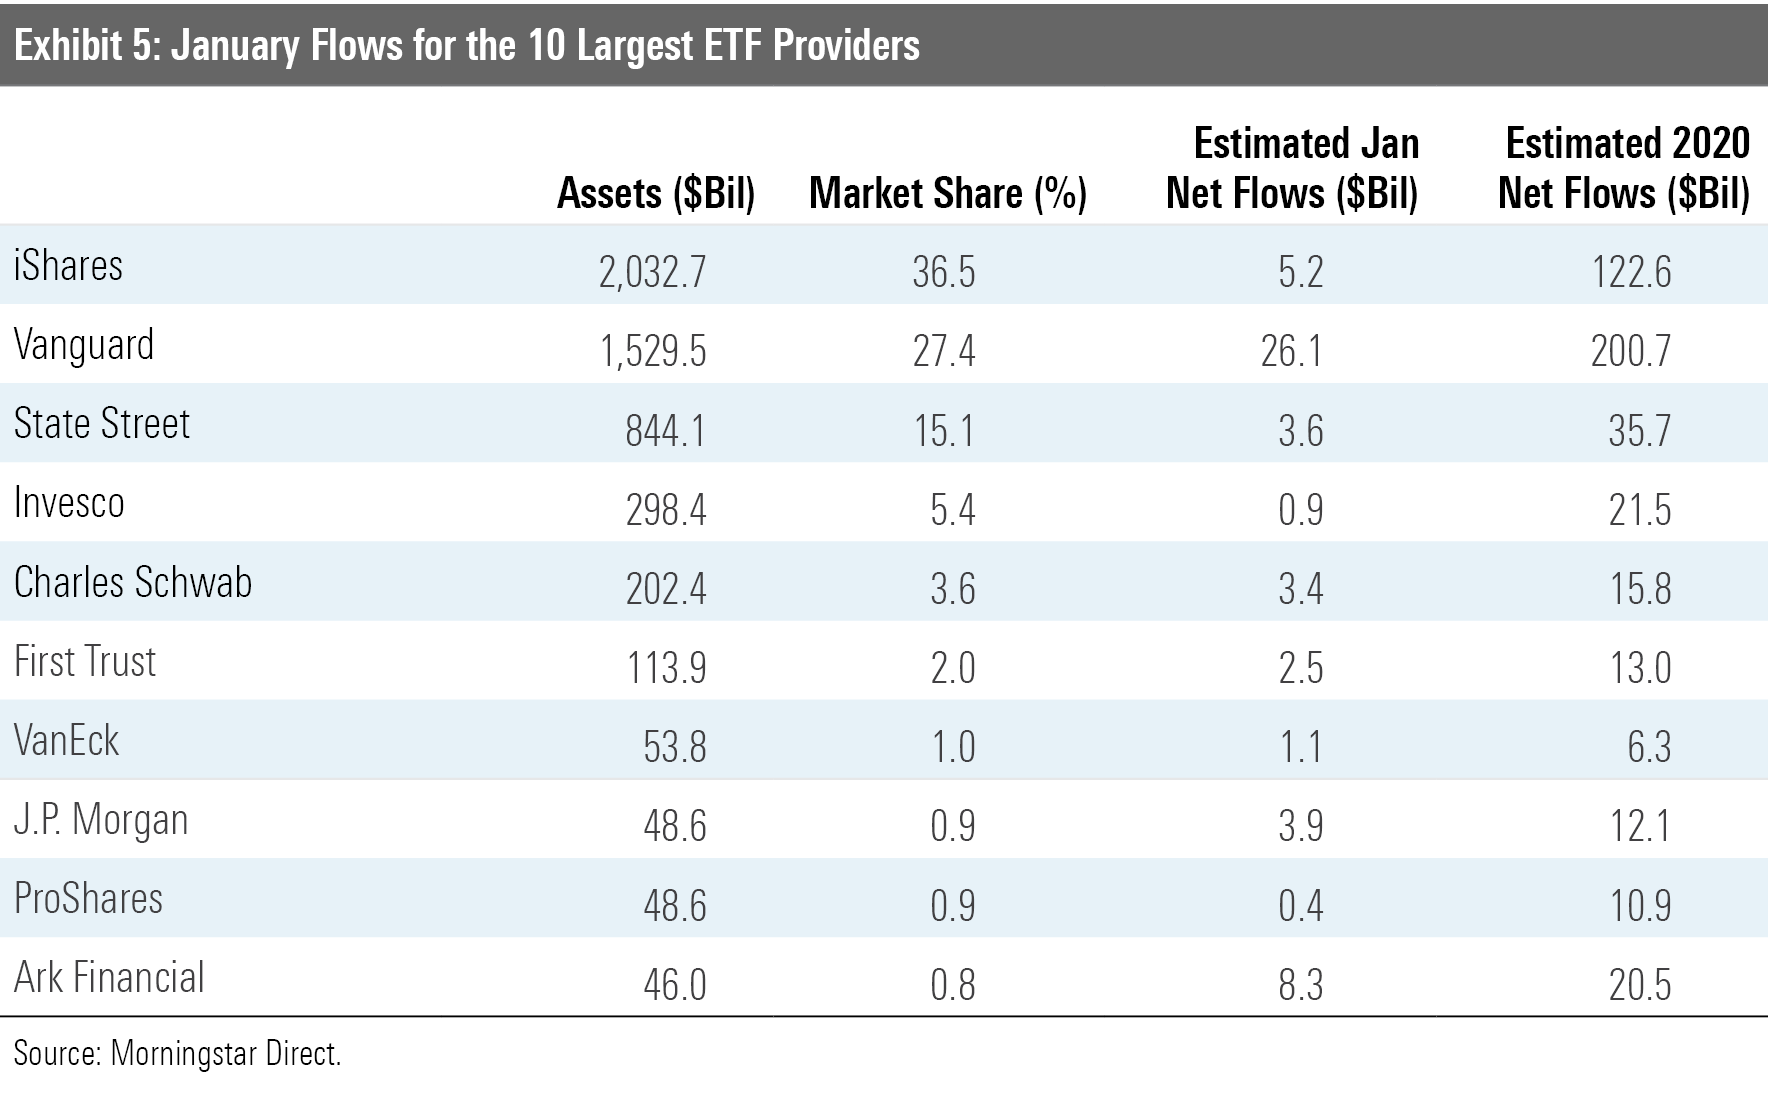
Vanguard topped the ETF provider flows league table in January. The firm's ETFs raked in $26.1 billion--$10.5 billion more than its five largest competitors combined. Some of Vanguard's recent ETF flows have resulted from conversions of assets in the firm's Admiral share class to ETF shares, which are now cheaper than the Admiral shares of the same funds after a wave of recent repricing. The firm has since either directly converted some of its investors' existing Admiral share class allocations to the ETF share class or otherwise nudged them to do it on their own. That said, the majority of its new inflows have come from new investments--not conversions. As these conversions run their course, their impact on the firm's ETF flows will diminish.
At the end of January there was a new name on the ETF industry's leaderboard: Ark Financial. The firm took in $8.3 billion in net new money during the month. This amounted to an astonishing one-month organic growth rate of 24%. The firm's flagship fund ARKK has delivered incredible performance. Over the five years through January, it gained 54.4% annually, making it the second-best performing fund among all equity mutual funds and ETFs in Morningstar's U.S. funds database over this span. The top performer? ARKK's sibling, Ark Next Generation Internet ETF ARKW, which gained 57.4% annually.
As Ark's performance has skyrocketed, flows have followed. Investors have added $28.6 billion to the firm's family of ETFs over the past 12 months. Assets in these funds have swelled to $46 billion from $3.3 billion at the end of January 2020. Investors considering these funds today should be asking themselves two key questions: 1) Is performance like this too good to last? and 2) Given the firm's sizable stakes in smaller stocks, how can it effectively manage capacity given that ETFs can't close to new investors?
There's Still Value in Value, and Momentum Has Gained Momentum The fair value estimate for ETFs rolls up our equity analysts' fair value estimates for individual stocks and our quantitative fair value estimates for stocks not covered by Morningstar analysts into an aggregate fair value estimate for stock ETF portfolios. Dividing this value by the ETFs' market prices yields the price/fair value ratio. This ratio can point to potential bargains and areas of the market where valuations are stretched.
Exhibit 6 features the 10 ETFs that were trading at the largest discounts and premiums to their fair value estimates as of the end of January. Eight of the 10 funds trading at the largest discounts belong to the equity energy category. Pain was pervasive in the energy sector in 2020 as demand declined and supply continued to flood the market. As producers ran out of places to store their output, prices collapsed, as did the share prices of firms operating in the oil- and gas-services industry.
But the market is a discounting mechanism, and in recent months, it was hopeful that a return to some semblance of normalcy was in sight. The rollout of coronavirus vaccines and the prospect of reopening the global economy has lifted oil prices and energy ETFs. But even after getting a proverbial shot in the arm, valuations in the sector remain depressed, and these funds continue to feature prominently in the ETF bargain bin. That said, they don't look nearly as cheap as they did at the end of March last year. For example, at the end of March 2020, VanEck Vectors Oil Services ETF OIH was trading at a price/fair value estimate of 0.29. Since then, the fund's share price has doubled. As of the end of January, its price/fair value ratio was 0.64.
This month's list of ETFs trading at the largest premiums to their fair value estimates features four clean energy funds. Notable among them are VanEck Vectors Low Carbon Energy ETF SMOG and ICLN. Both ranked among 2020's top performers. SMOG spiked 118.63% for the year, while shares of ICLN were up 141.31%. Both funds added to their gains in January as the Biden administration unveiled its plans to address climate change.
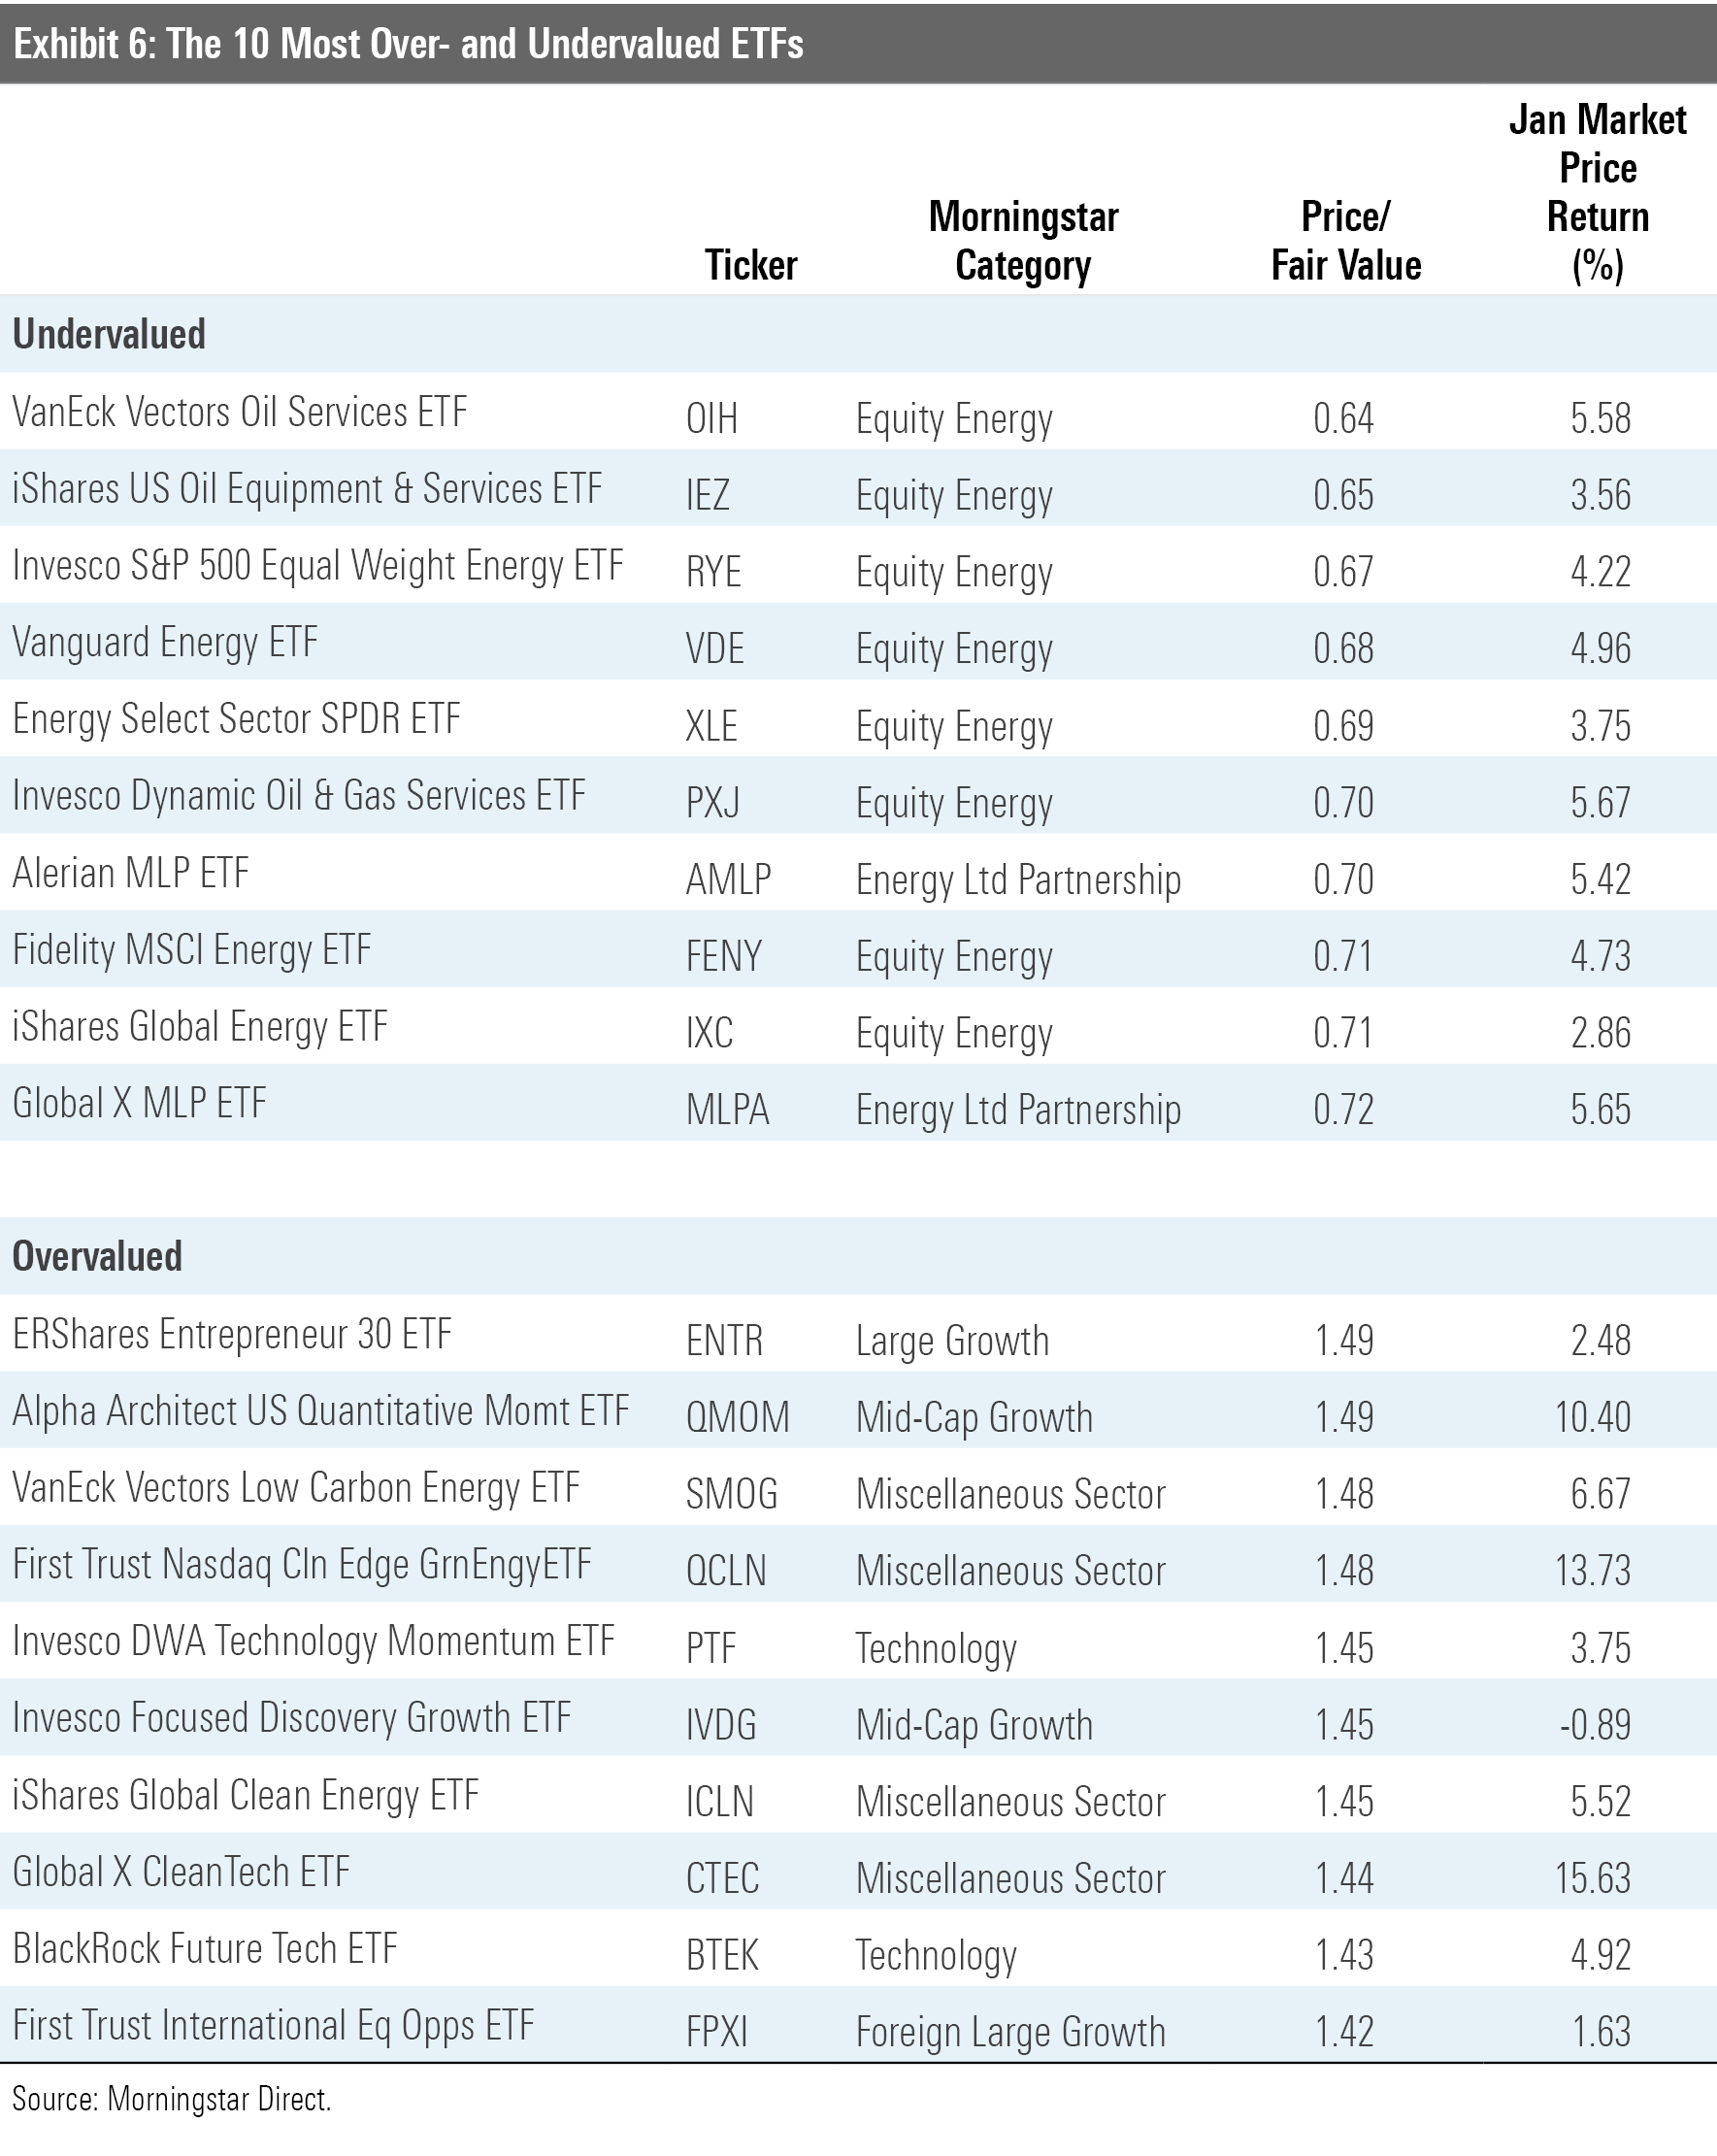
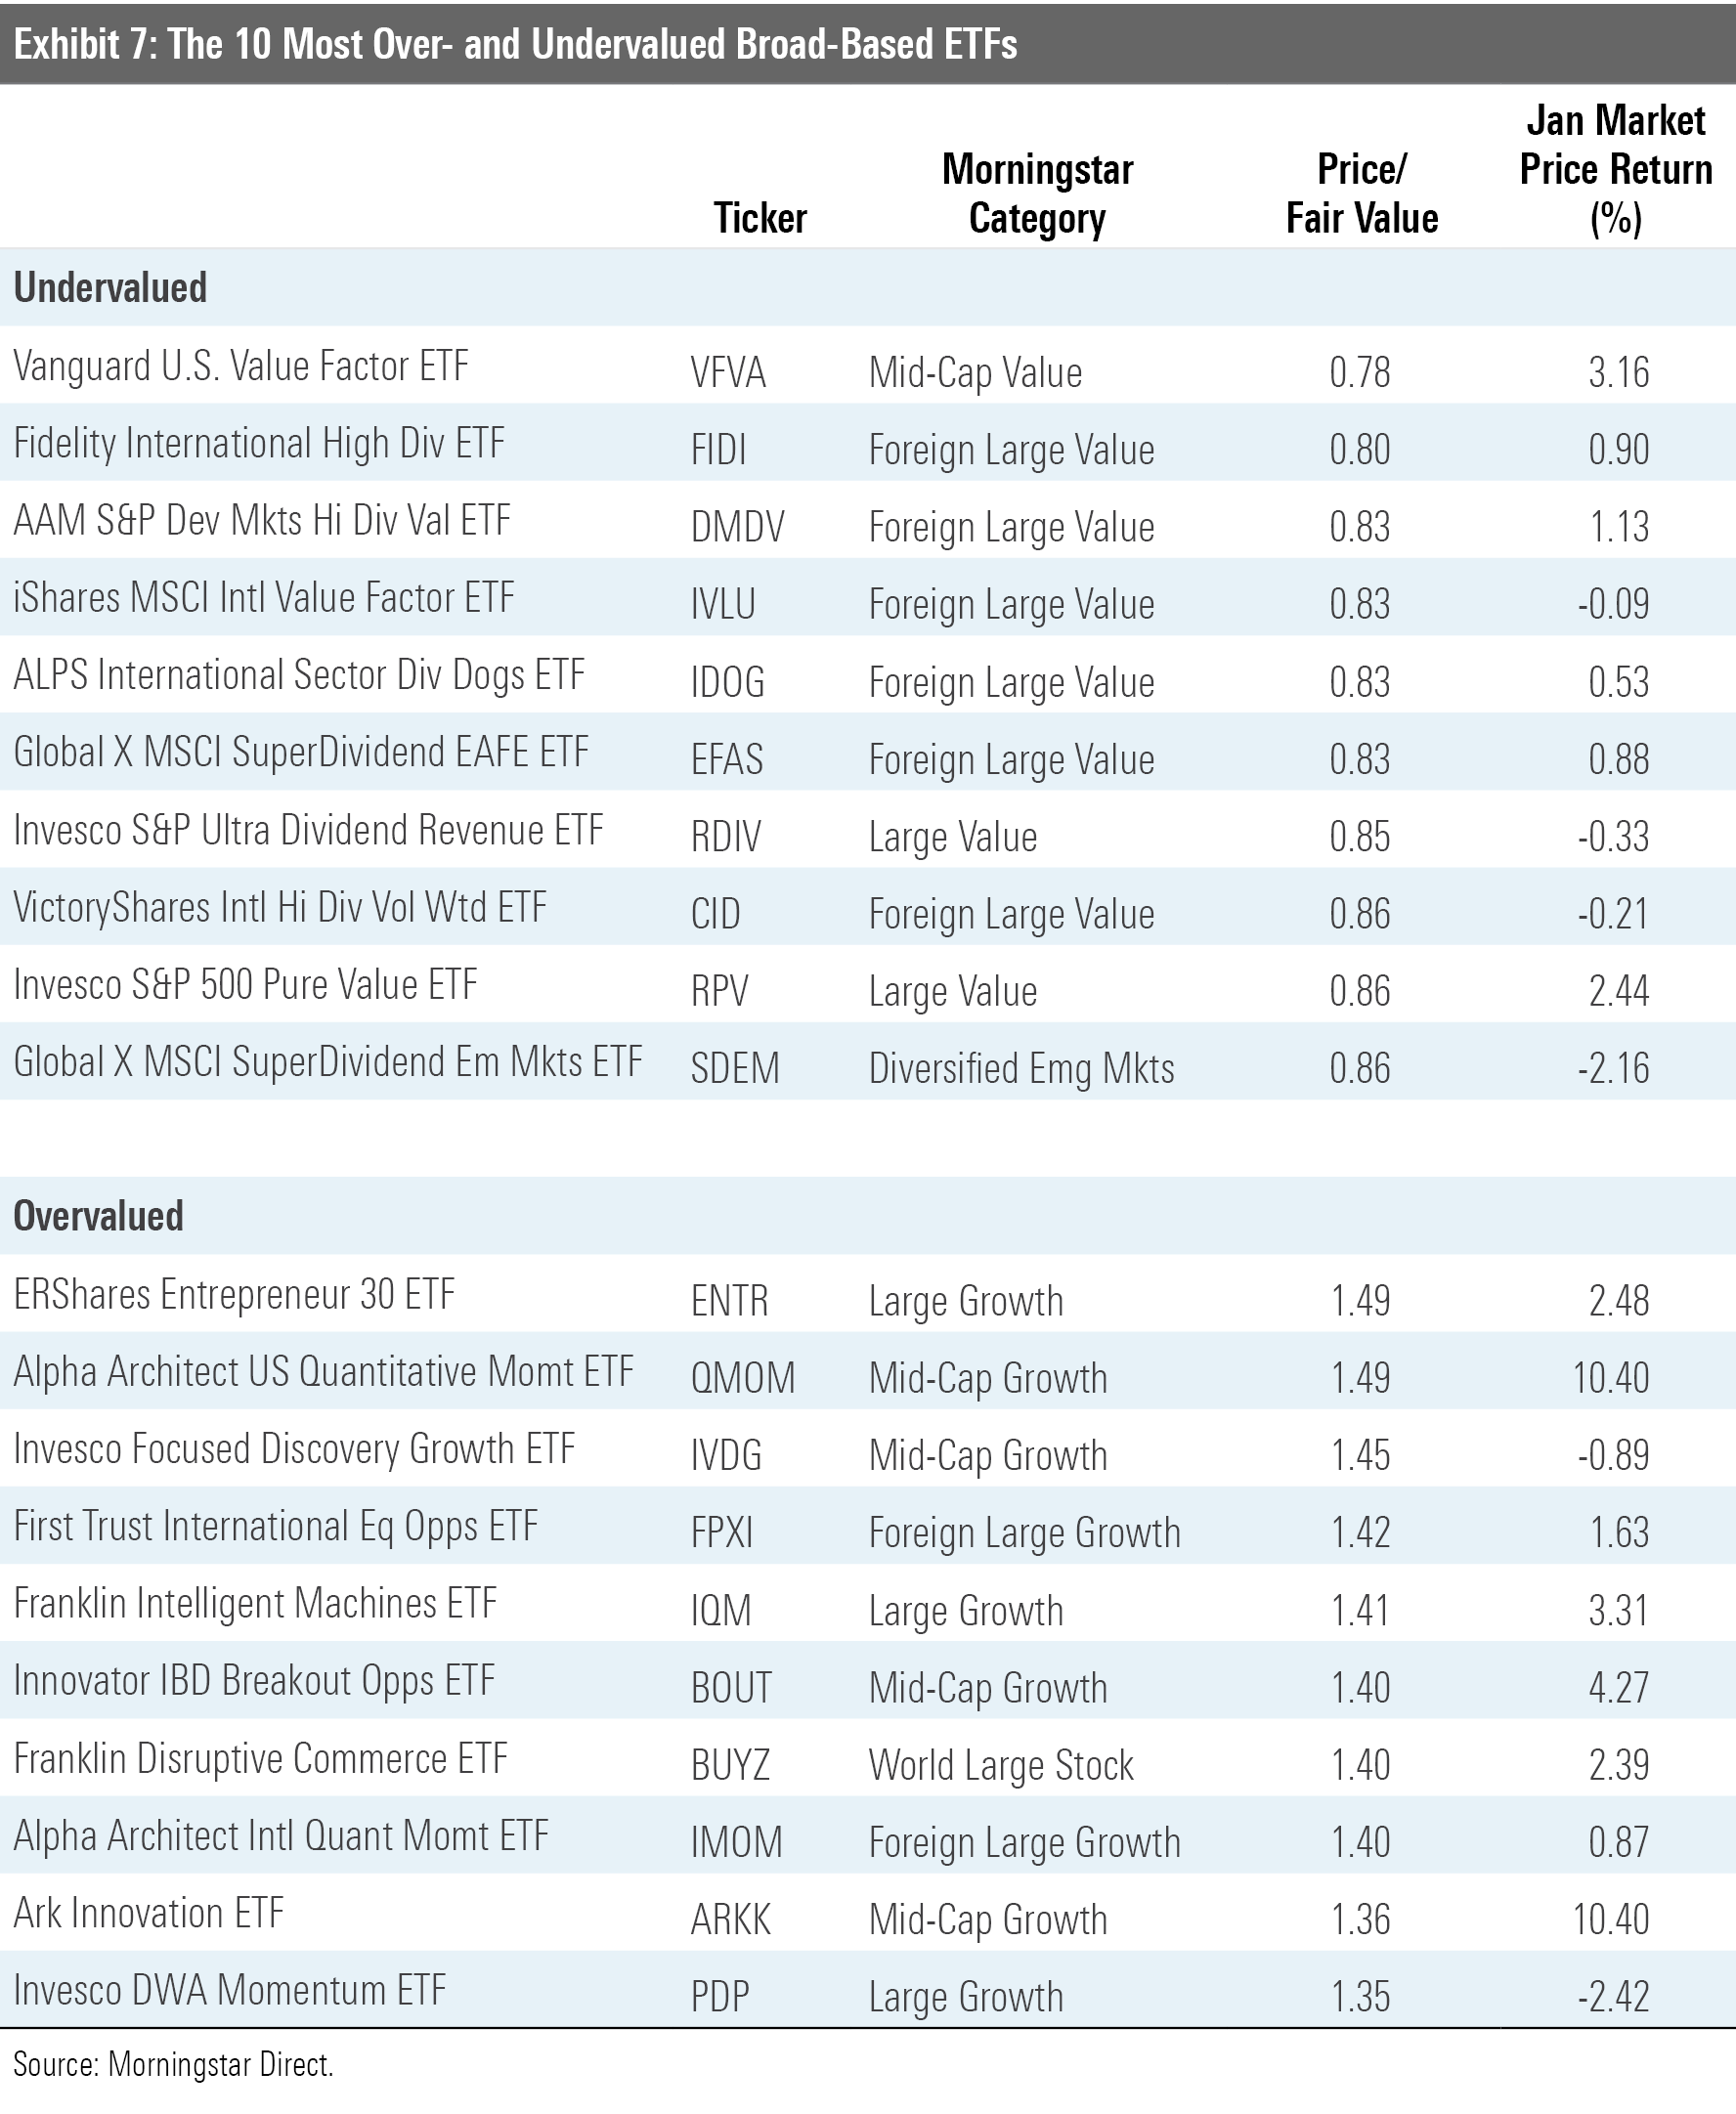
Exhibit 7 features the 10 broad-based ETFs (those belonging to one of the mainline Morningstar Style Box or other broader geographic categories) that were trading at the largest discounts and premiums to their fair value estimates as of month-end. The common thread among all these funds is an orientation toward smaller, cheaper stocks. Some of them deliberately lean into value by virtue of selecting and weighting stocks based on their relative cheapness. This is the case for Vanguard U.S. Value Factor ETF VFVA. Seven value-leaning funds that invest in international stocks also make this month's list. Notable among them is iShares MSCI International Value Factor ETF IVLU, the foreign cousin of VLUE. Like its U.S. counterpart, IVLU takes a sector-neutral approach, sweeping in the cheapest stocks within each sector and weighting them based on a combination of their market cap and the strength of their value characteristics. The result is a portfolio with a strong and consistent value orientation.
Three of the 10 most overvalued broad-based ETFs ply momentum strategies--sweeping in the markets' best recent performers. After momentum stocks' recent run, it isn't surprising to see these three make the list. Alpha Architect U.S. Quantitative Momentum ETF QMOM gained nearly 44% over the three months through January, outpacing the Russell Midcap Growth Index (its Morningstar Category index) by 24 percentage points. Equally unsurprising is the presence of some thematic ETFs that have been swept up in some momentum trades of their own. Most notable among them is ARK Innovation ETF. The fund's share price increased almost 170% during the 12 months through January.
Disclosure: Morningstar, Inc. licenses indexes to financial institutions as the tracking indexes for investable products, such as exchange-traded funds, sponsored by the financial institution. The license fee for such use is paid by the sponsoring financial institution based mainly on the total assets of the investable product. Please click here for a list of investable products that track or have tracked a Morningstar index. Neither Morningstar, Inc. nor its investment management division markets, sells, or makes any representations regarding the advisability of investing in any investable product that tracks a Morningstar index.
/cloudfront-us-east-1.images.arcpublishing.com/morningstar/T2LGZCEHBZBJJPPKHO7Y4EEKSM.png)
/d10o6nnig0wrdw.cloudfront.net/04-18-2024/t_34ccafe52c7c46979f1073e515ef92d4_name_file_960x540_1600_v4_.jpg)
/d10o6nnig0wrdw.cloudfront.net/04-09-2024/t_e87d9a06e6904d6f97765a0784117913_name_file_960x540_1600_v4_.jpg)
:quality(80)/s3.amazonaws.com/arc-authors/morningstar/a90ba90e-1da2-48a4-98bf-a476620dbff0.jpg)