
The Dramatic Evolution of Emerging Markets
What does the dynamic nature of these markets mean for portfolio construction?
/s3.amazonaws.com/arc-authors/morningstar/a90ba90e-1da2-48a4-98bf-a476620dbff0.jpg)
Per MSCI, emerging-markets stocks made up about 13% of the global stock market (using the MSCI All Country World Investable Market Index as a proxy) as of the end of 2020. When the MSCI Emerging Markets Index was launched in 1988, these stocks represented less than 1% of the world’s investable equity market capitalization.
Emerging markets are dynamic by definition. They have changed dramatically in the past three-plus decades, and the pace of change has only accelerated in recent years. Here, I’ll look at emerging-markets stocks’ long- and short-term performance, the most recent phase in their ongoing evolution, how their makeup may evolve in the future, and what this all might mean with respect to portfolio construction.
Back in the Saddle The current version of the MSCI Emerging Markets Index was launched on Jan. 1, 2001. From its inception through the end of 2020, its annualized return amounted to 9.59% versus 6.02% for its developed-markets counterpart, the MSCI World Index. Though these headline performance figures are compelling, they belie the gut-wrenching volatility that has characterized this span. During this period, the emerging-markets index's standard deviations of monthly returns and maximum drawdown were 21.59% and 61.59%, respectively. The comparable figures for the MSCI World Index were 15.62% and 54.03%, respectively. Emerging markets' path to greater absolute returns has been a winding one.
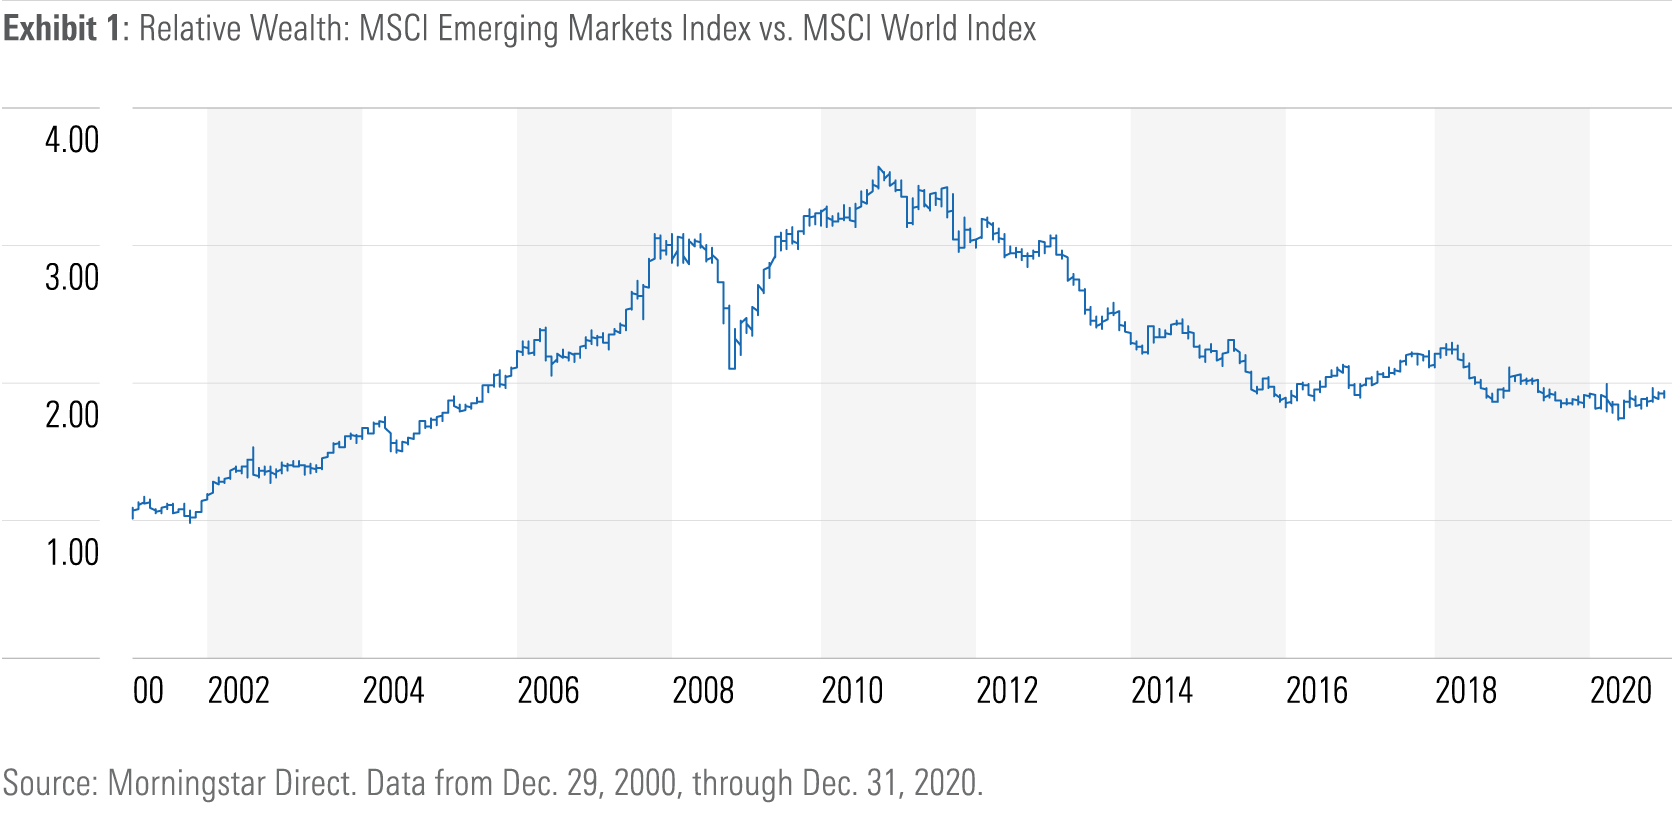
Recent years have been particularly taxing for investors in emerging-markets stocks. From the time that the emerging-markets index’s cumulative performance peaked relative to developed markets in October 2010 (see Exhibit 1) through the end of 2020, the MSCI World Index outperformed the MSCI Emerging Markets Index by 6.28 percentage points on an annualized basis. But after 10 lean years, emerging-markets equities looked set to re-emerge in 2020. From the end of February 2020 through year-end, the emerging-markets index increased 31%, while its developed-markets counterpart rose 27.38%. Digging into the drivers of the benchmark’s recent performance yields some interesting insights into how its complexion has changed in recent years.
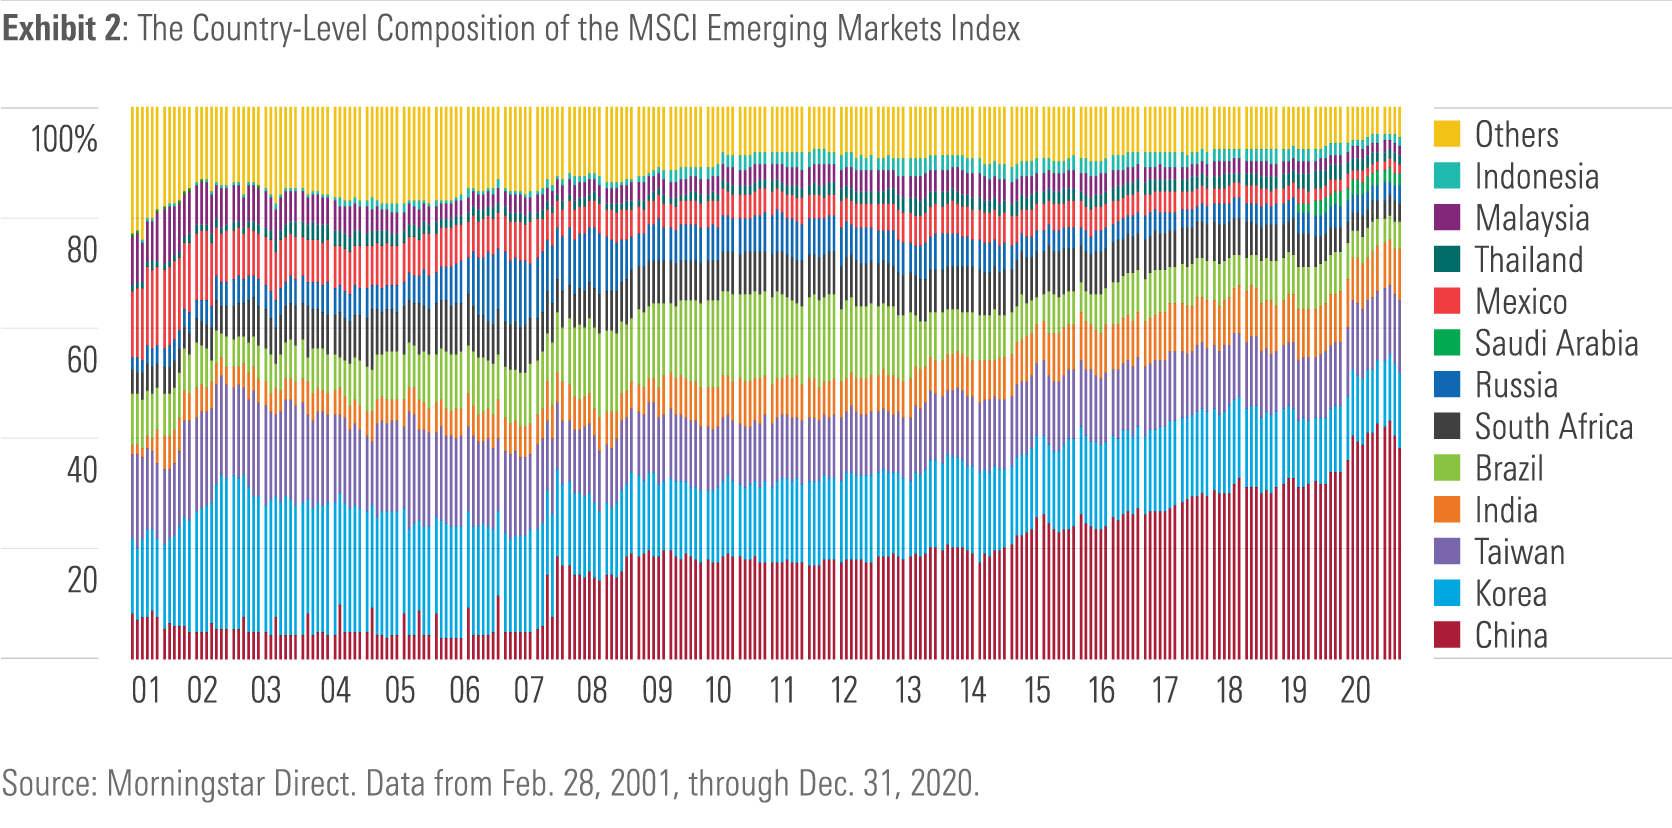
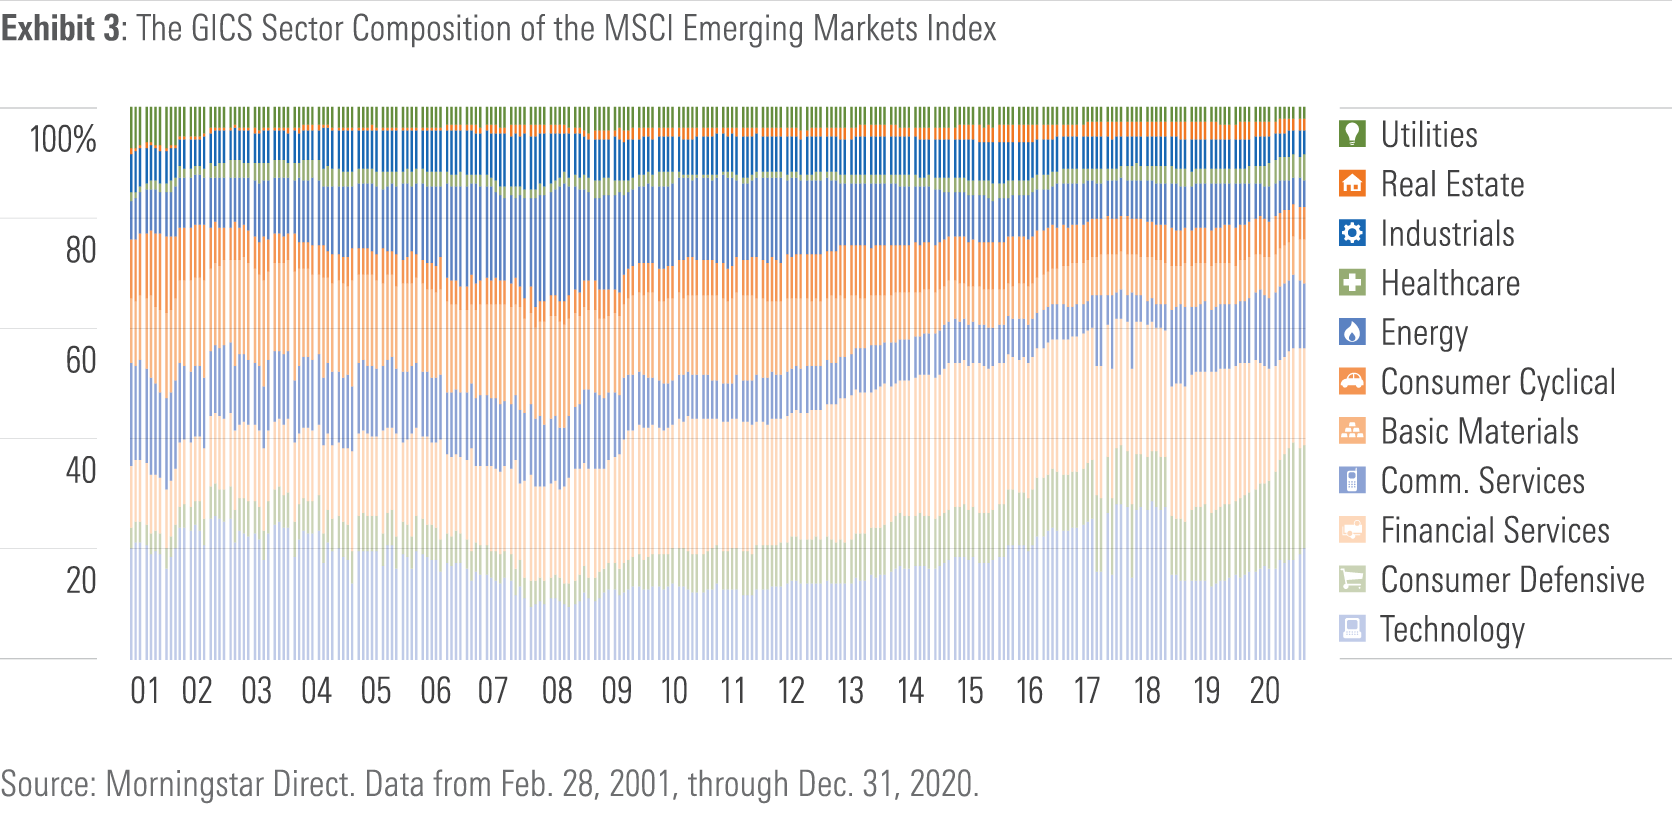
Then and Now Exhibits 2 and 3 decompose the MSCI Emerging Markets Index into its constituent country and GICS sector exposures. It is readily apparent that the composition of this cohort has changed materially over the years. From the point of view of country membership, the most significant changes have been the decline in Brazilian stocks' share of the portfolio (to 5.1% as of the end of 2020 from a peak of 16.2% in February 2010) and the increase in Chinese stocks' share (which has risen to 38.4% from 18.1% during this same span).
In terms of sector composition, there’s been an even more significant shift in the index. In June 2008, energy and materials stocks represented a combined 40.2% of the MSCI Emerging Markets Index. As of the end of 2020, this figure had declined to 12.5%. Back in 2008, technology names accounted for 10.1% of the index portfolio; by the end of 2020, that figure had increased to 20.5%.
Of course, this evolution is only natural. The MSCI Emerging Markets Index is a broad, market-cap-weighted benchmark. As such, it will reflect the ebb and flow of firm-level fundamentals, investor sentiment, capital flows, and so on across these markets. Thus, the shift in the benchmark’s makeup represents the net result of all the above, as manifested in their relative performance. For example, from June 2008 through December 2020, the MSCI China Index gained 7.18% on an annualized basis, while the MSCI Brazil Index declined by 3.11% annualized, in U.S. dollar terms. These divergent paths speak to the effects of the commodity boom and subsequent bust on Brazil’s stock market (and currency) and the emergence of a pair of tech giants--Tencent Holdings TCEHY and Alibaba Group BABA--in China. (The stocks now belong to the communications services and consumer discretionary GICS sectors, respectively, following a 2018 reclassification--another nod to the dynamism of indexing.)
This brings us to emerging markets’ 2020 reawakening. An attribution analysis of the MSCI Emerging Markets Index’s performance from the end of February 2020 through the year’s end reveals that the aforementioned Chinese tech behemoths combined to account for more than 3 percentage points of the index’s 31% gain. Rounding out the list of the index’s top five contributors are Taiwan Semiconductor TSM, Samsung SSNGY, and Meituan MPNGY, which collectively added about 7.5 percentage points to its performance over this stretch. The “new economy” stock rally is not a U.S.-only phenomenon--emerging markets are participating as well. The transition from a portfolio dominated by basic materials and energy giants to one led by emerging titans of the technology, communications, and consumer discretionary sectors has marked the most recent evolution of emerging stock markets, but what might come next?
What the Future Might Hold While the makeup of the universe of emerging-markets stocks will inevitably continue to evolve, it is impossible to say what it will look like 10 years from now. That's precisely why many investors choose to invest in this market segment using a broad, market-cap-weighted index fund. However, if history is any guide, it's safe to say that country membership and the level of access to previously closed markets will remain in flux.
For example, in 2017 as part of its annual market classification review, MSCI announced that it would begin to include China A-shares in the MSCI Emerging Markets and MSCI All Country World indexes. MSCI’s decision, which followed FTSE Russell’s 2015 launch of China A-shares inclusion indexes, recognized the significant strides China had made toward opening its capital markets to foreign investors in recent years. Fast forward to the end of 2020, and MSCI had made four steps down the path toward full China A-shares inclusion in its mainline benchmarks, and China A-shares represented 4.3% of iShares Core MSCI Emerging Markets ETF’s IEMG portfolio. Ultimately, these moves will bring China’s standing in equity indexes more in line with the true footprint of the nation’s capital markets and its economy at large.
Also of note is the fact that both MSCI and FTSE Russell include Saudi Arabia in their emerging-markets benchmarks. MSCI completed this in 2019, adding Saudi stocks in a two-step process, while FTSE Russell completed its more gradual, six-step inclusion process in mid-2020. Further opening of the kingdom’s capital markets and the potential for additional share issuance by Saudi Aramco--whose 2019 initial public offering fell flat--could have a significant effect on the character of the pool of emerging-markets stocks.
Implications for Portfolio Construction Per MSCI's definition, emerging-markets stocks represent about 7% of a globally diversified 60/40 stock/ bond portfolio, at market weight. These stocks' potential contribution to long-term returns is clear but will likely come at the expense of pronounced volatility. As is the case with international stocks more broadly, the prospective diversification benefits of an allocation to emerging-markets stocks may be limited and could even wane with time.
Exhibit 4 shows the rolling three-year correlation between the MSCI Emerging Markets, MSCI World, and S&P 500. As you can see, the level of correlation between developing- and developed-markets stocks has generally been high over the past two decades. This could be attributable to a number of factors.
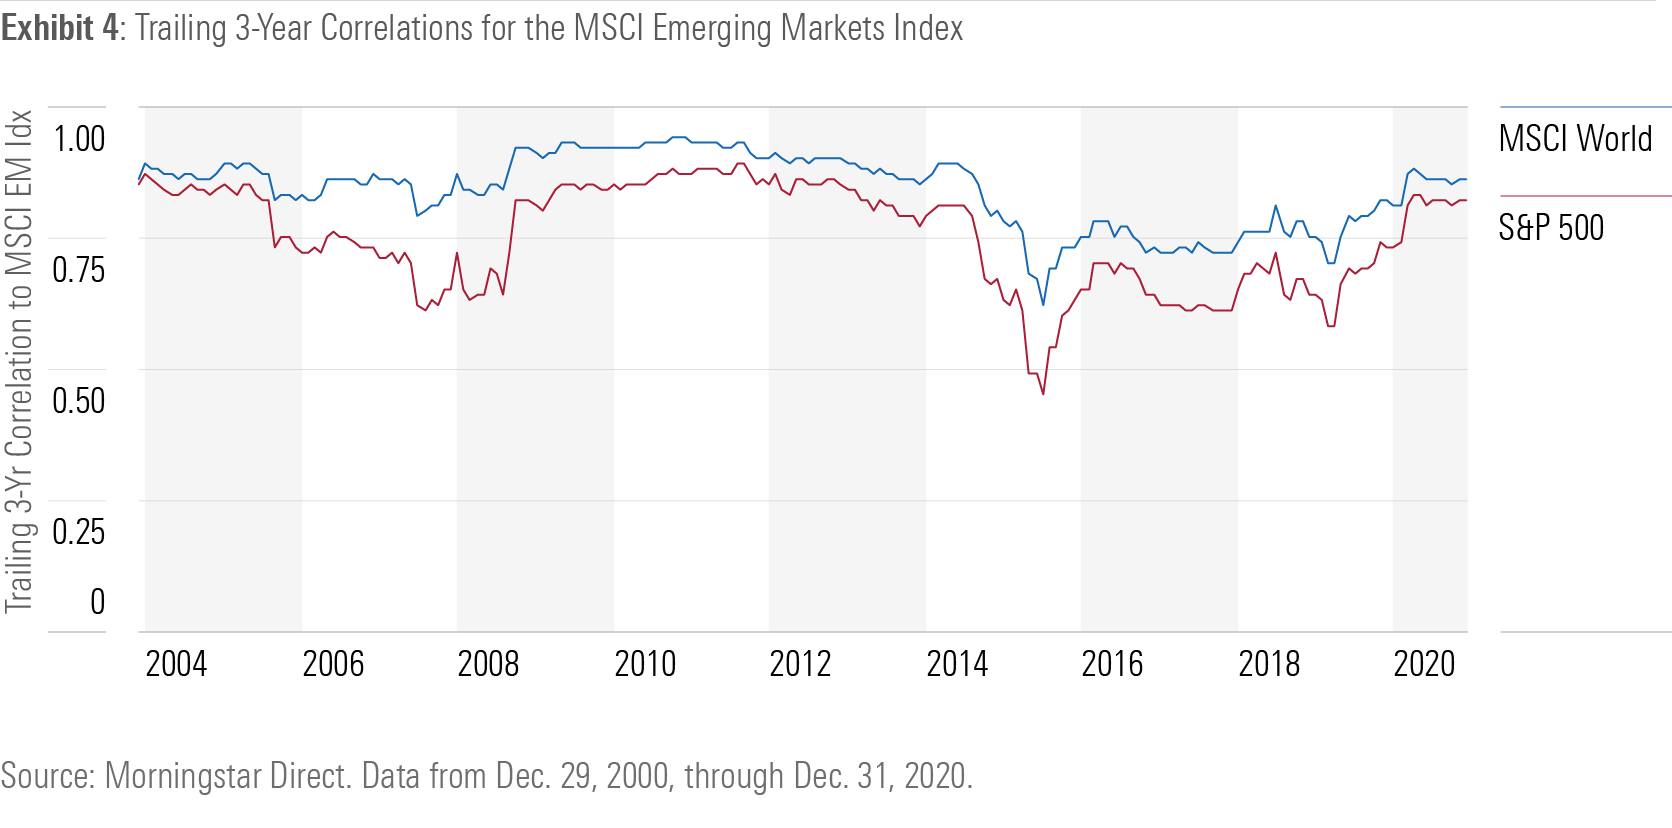
More widespread recognition of the group as a distinct asset class and greater investment--particularly by foreign investors--could be partly to blame. Simultaneously, the degree to which these countries have become integrated in the broader global economy has unquestionably increased. To the extent that these nations’ prospects have forged stronger ties to those of more advanced economies, the greater degree of co-movement among their stock markets makes sense.
In addition, growth in emerging markets has been a boon for many global firms that have stocks trading on developed-markets exchanges. The MSCI USA with EM Exposure Index selects constituents from the MSCI USA Index and weights them on the basis of the proportion of their revenue derived from emerging-markets countries. The benchmark’s largest holding is Apple AAPL, which received a 23.78% weighting as of the end of 2020. This underscores the degree of connectivity between emerging and developed markets. It is unlikely this interdependence will diminish anytime soon. As such, it could mean that the correlation between emerging and developed markets will remain elevated, become less volatile, and may even increase. That would diminish the prospective diversification benefits of an allocation to emerging-markets stocks from the perspective of a U.S. investor.
Key Takeaways 1. Emerging markets are dynamic by definition. The makeup of this group will continue to evolve as these nations continue to either climb or fall off the economic development ladder.
2. Expect a bumpy ride. These countries’ progress will be lumpy and their stock markets’ returns lumpier still. As always, reaping the prospective rewards of an allocation to emerging-markets stocks hinges on investors’ ability to buckle up and sit tight.
3. Diversification benefits may dwindle. To the extent that emerging markets continue to integrate into the global economy, they may move in lockstep with their developed-markets counterparts.
Disclosure: Morningstar, Inc. licenses indexes to financial institutions as the tracking indexes for investable products, such as exchange-traded funds, sponsored by the financial institution. The license fee for such use is paid by the sponsoring financial institution based mainly on the total assets of the investable product. Please click here for a list of investable products that track or have tracked a Morningstar index. Neither Morningstar, Inc. nor its investment management division markets, sells, or makes any representations regarding the advisability of investing in any investable product that tracks a Morningstar index.
/d10o6nnig0wrdw.cloudfront.net/09-25-2023/t_f3a19a3382db4855b642d8e3207aba10_name_file_960x540_1600_v4_.jpg)
/d10o6nnig0wrdw.cloudfront.net/04-09-2024/t_e87d9a06e6904d6f97765a0784117913_name_file_960x540_1600_v4_.jpg)
/cloudfront-us-east-1.images.arcpublishing.com/morningstar/T2LGZCEHBZBJJPPKHO7Y4EEKSM.png)
:quality(80)/s3.amazonaws.com/arc-authors/morningstar/a90ba90e-1da2-48a4-98bf-a476620dbff0.jpg)