
U.S. Fund Flow Records Fell in 2020
ETFs sizzled, open-end funds fizzled, and bond funds kept on rolling.
/s3.amazonaws.com/arc-authors/morningstar/a25c5a3e-6a5c-495e-9278-eb867855f392.jpg)

Editor's note: This is adapted from the Morningstar Direct U.S. Asset Flows Commentary for December 2020. Download the full report.
December capped a wild year in markets and fund flows. Equities sold off sharply in 2020's first quarter, but the S&P 500 rallied to close at a record high on Dec. 31. Actions by the Federal Reserve midyear helped shore up bond markets. Amid the upheaval, investors appeared to rebalance away from equities and toward bonds in record numbers, often eschewing open-end mutual funds in favor of exchange-traded funds.
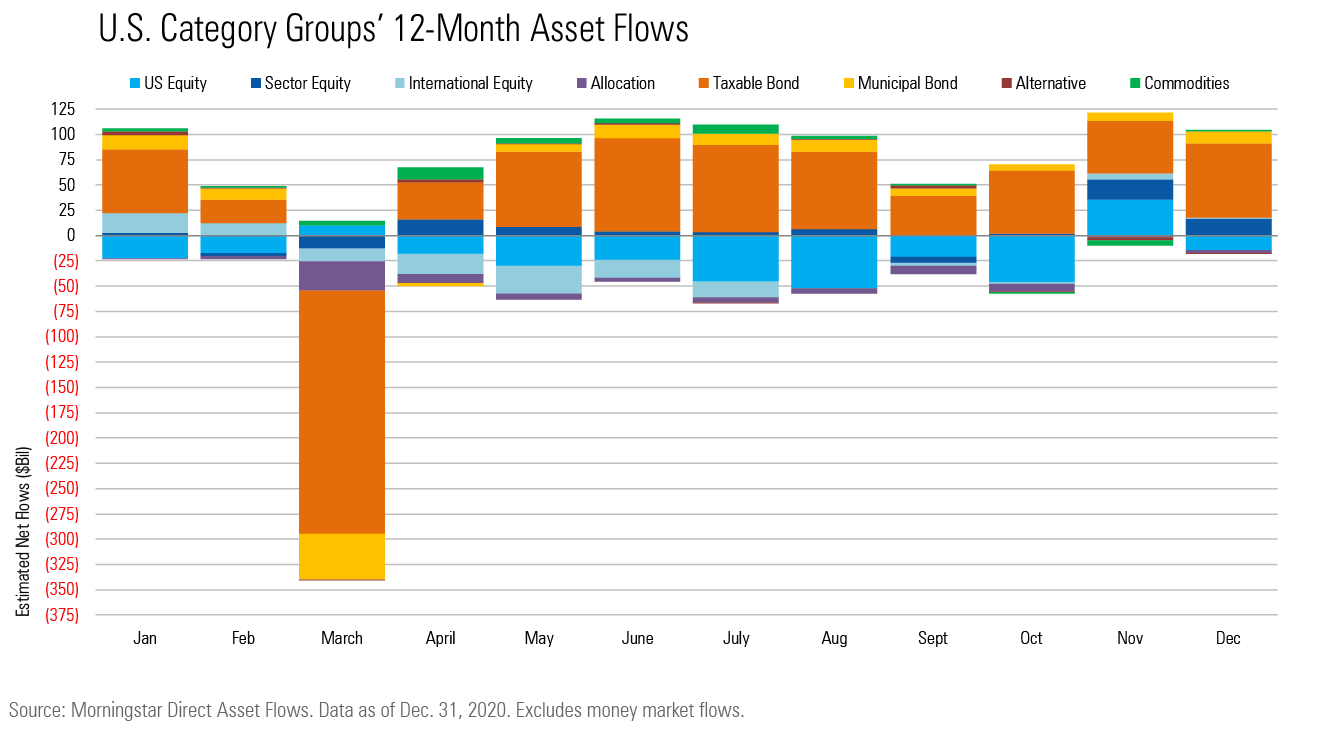
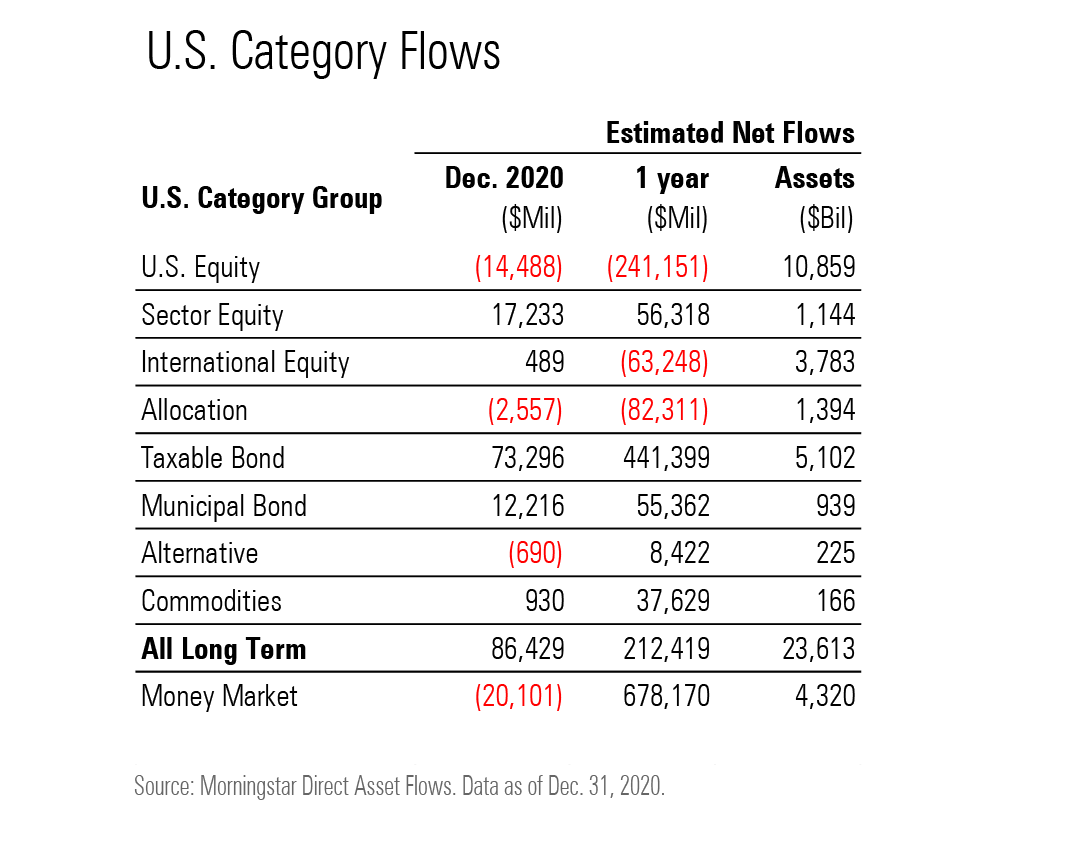
All told, long-term mutual funds and ETFs collected more than $86 billion in December. For the year, long-term funds gathered $212 billion, though that was well below the $356 billion average annual inflow from 2010 through 2019.
It was a banner year for ETFs. Not only did ETFs launch and close at record rates in 2020, but they also posted record calendar-year inflows of $502 billion--an 11% year-over-year organic growth rate. That included a record $95 billion of inflows in November and another $64 billion in December.
Investors are increasingly using ETFs for fixed-income investments. Taxable-bond ETFs got nearly $195 billion in 2020--the most of any U.S. category group. Although taxable-bond and muni-bond ETFs held only 20% of ETF assets at the end of 2020, they accounted for 42% of ETF inflows for the year.
Mutual funds never really recovered from the beating they took in March, when investors yanked a record $336 billion from them. For the year, their $289 billion of net outflows easily surpassed the previous record of $169 billion set in 2018. Still, mutual funds held more than $18.2 trillion in assets at the end of 2020, more than 3 times the assets in ETFs.
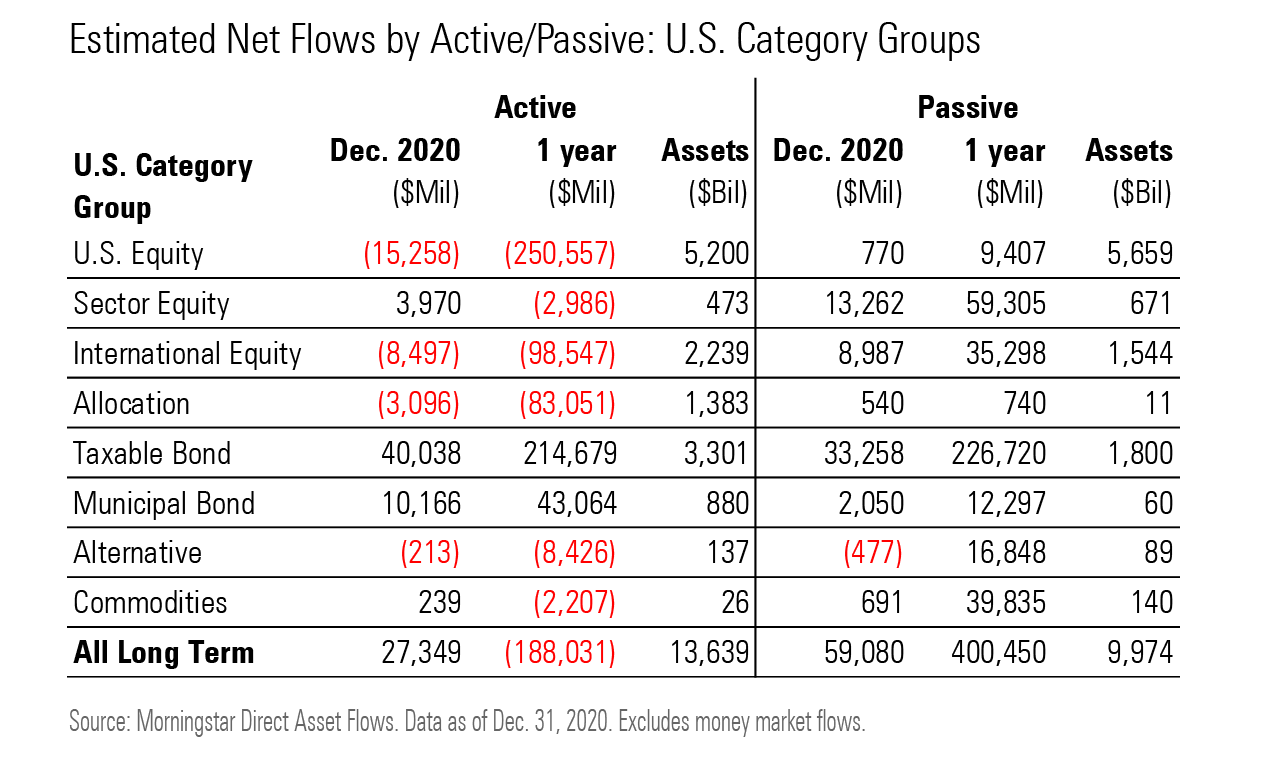
That said, investors' turn toward ETFs took a toll on actively managed funds. Although they added $27 billion in December, actively managed funds shed $188 billion for the year, with all category groups suffering outflows except taxable bond and municipal bond. In contrast, passively managed products took in $400 billion. For those funds, every category group had positive flows for the year, but the taxable-bond group led the way with nearly $227 billion.
U.S. equity funds' $241 billion of outflows in 2020 was 4 times the previous record of $58 billion set in 2015, and their negative 2.6% organic growth rate was the sharpest hit to total assets in data going back to 1993. The calendar-year outflows for 2020 were more than the four next-worst years combined (2015, 2011, 2009, and 2012).
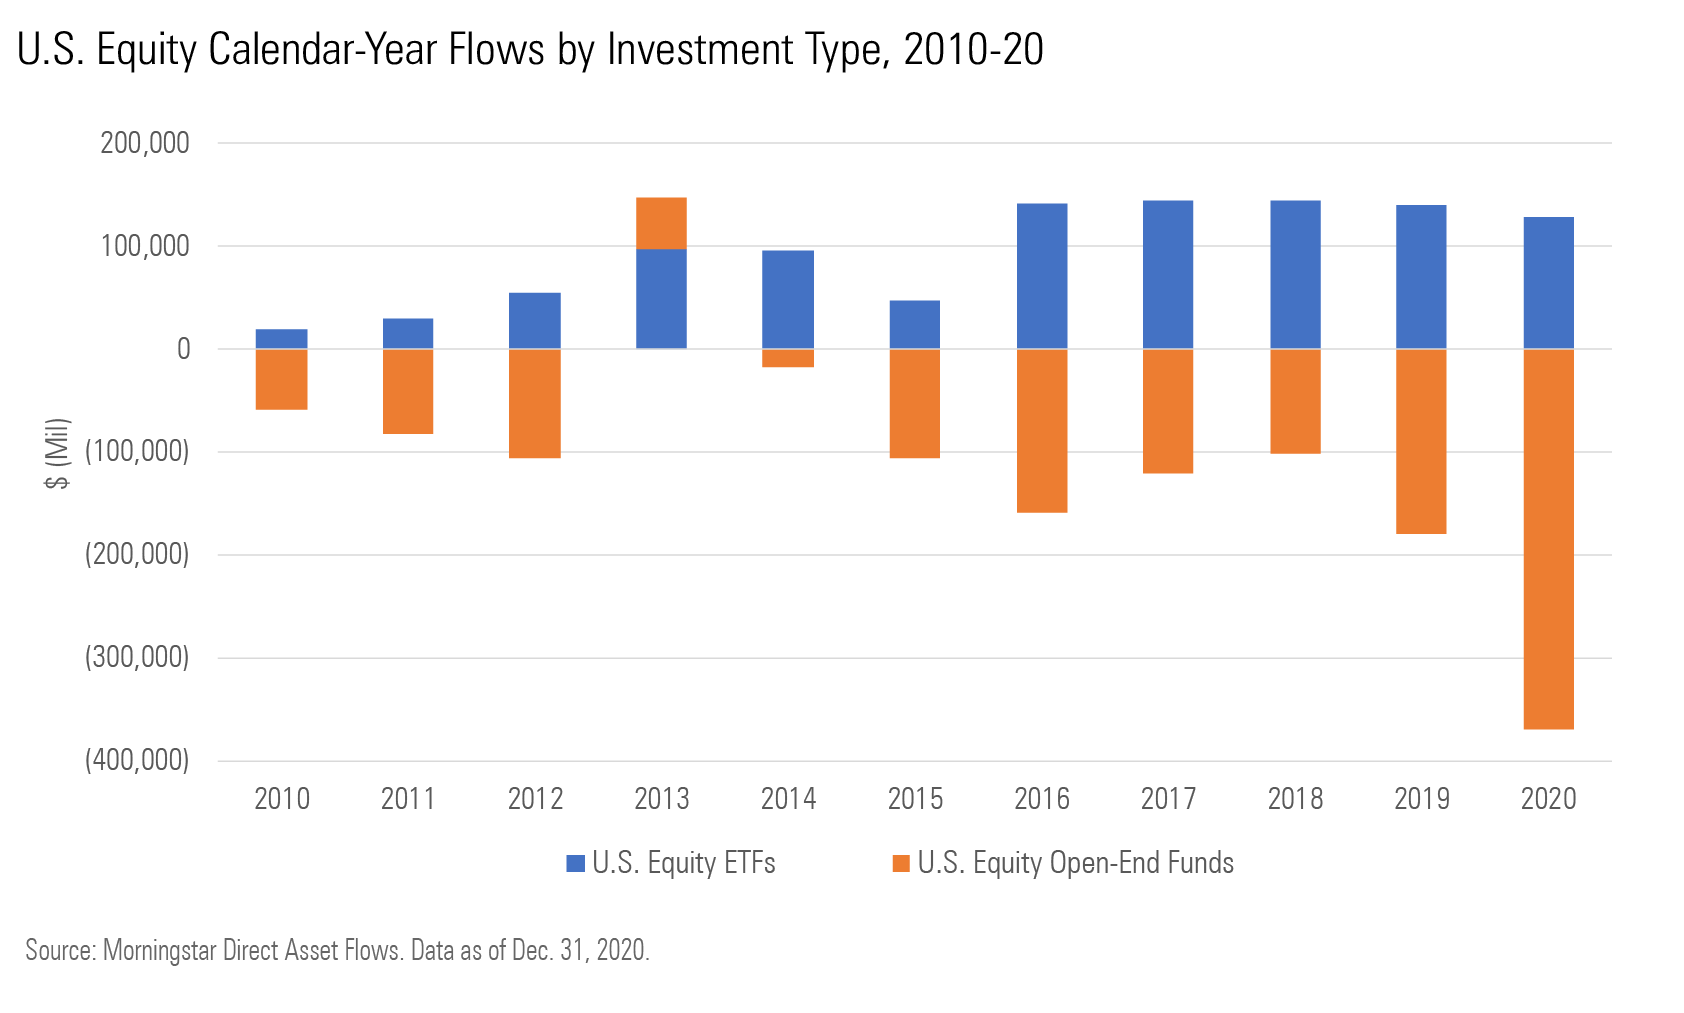
Open-end funds bore the brunt of U.S. equity outflows. Their record $370 billion of outflows in 2020 more than doubled the previous record of $180 billion set in 2019. What's worse, open-end U.S. equity funds have suffered calendar-year outflows in 13 of the past 14 years, totaling $1.46 trillion. In contrast, U.S. equity ETFs picked up nearly $11 billion in December, pushing 2020's total inflows to $129 billion.
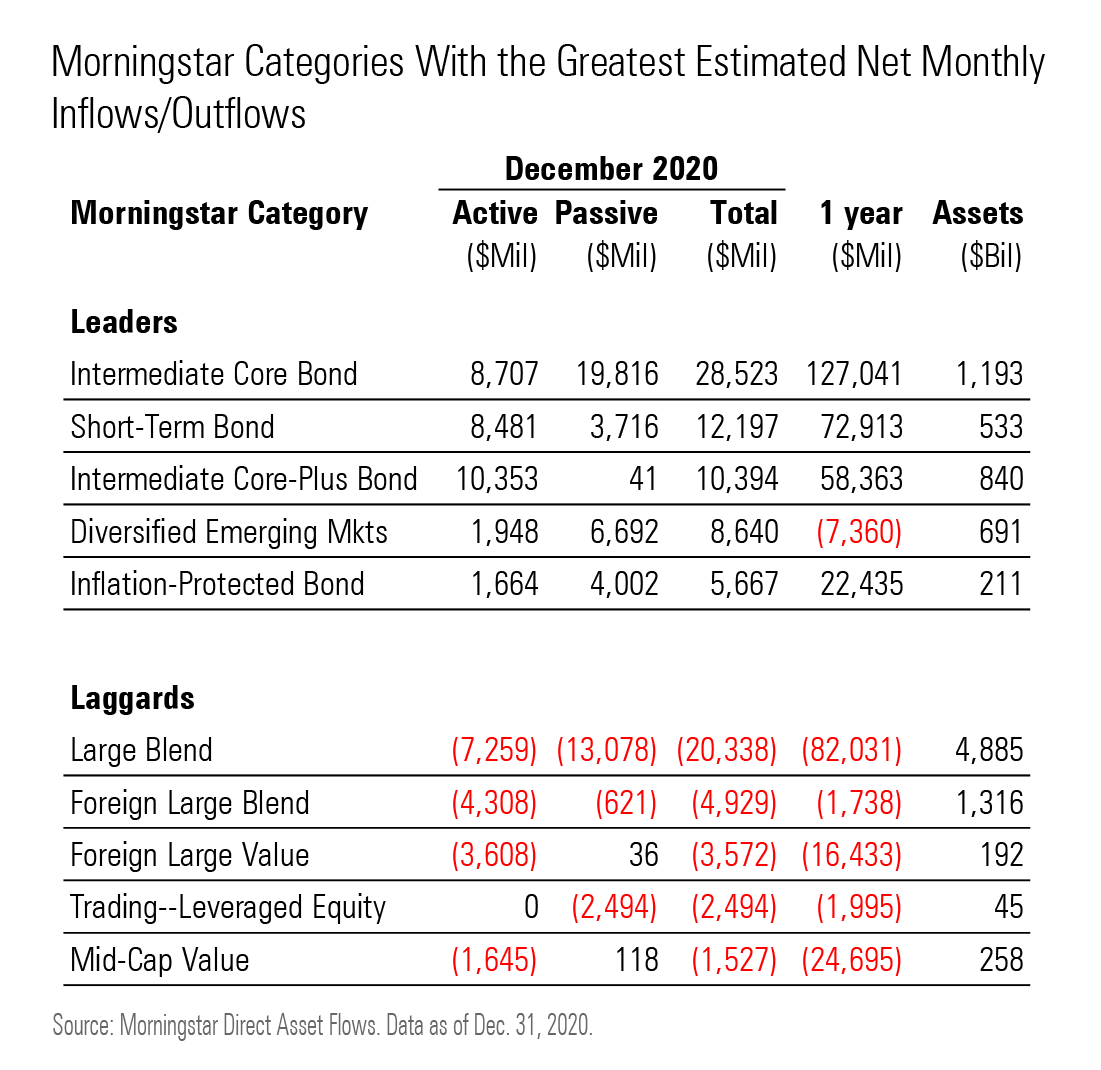
Outflows also hit every Morningstar Style Box equity category in 2020. In a year when the S&P 500 returned 18%, a record $82 billion left large-blend funds. Their $20 billion of outflows in December topped the list of Morningstar Categories with outflows for the month. The calendar-year tally was almost 4 times heavier than the previous record of $22 billion set in 2009. Large-growth funds had $66 billion of outflows in 2020--their 17th consecutive year of outflows.
Overall, taxable-bond funds had a stellar 2020 as measured by asset flows. The category group landed $73 billion of inflows in December and a record $441 billion for the year. That was despite a horrific March when taxable-bond funds bled a record $240 billion.
Investors largely hewed to middle-of-the-road categories like intermediate core bond, which soaked up a record $29 billion in December and a record $127 billion for the calendar year. But other segments did well, too. The Federal Reserve bought high-yield and corporate-bond funds midyear to shore up the fixed-income market, and its actions--along with those of investors who saw the Fed's moves as a buying opportunity or wanted incremental yield advantages in a period of low interest rates--helped both categories garner record inflows in 2020.
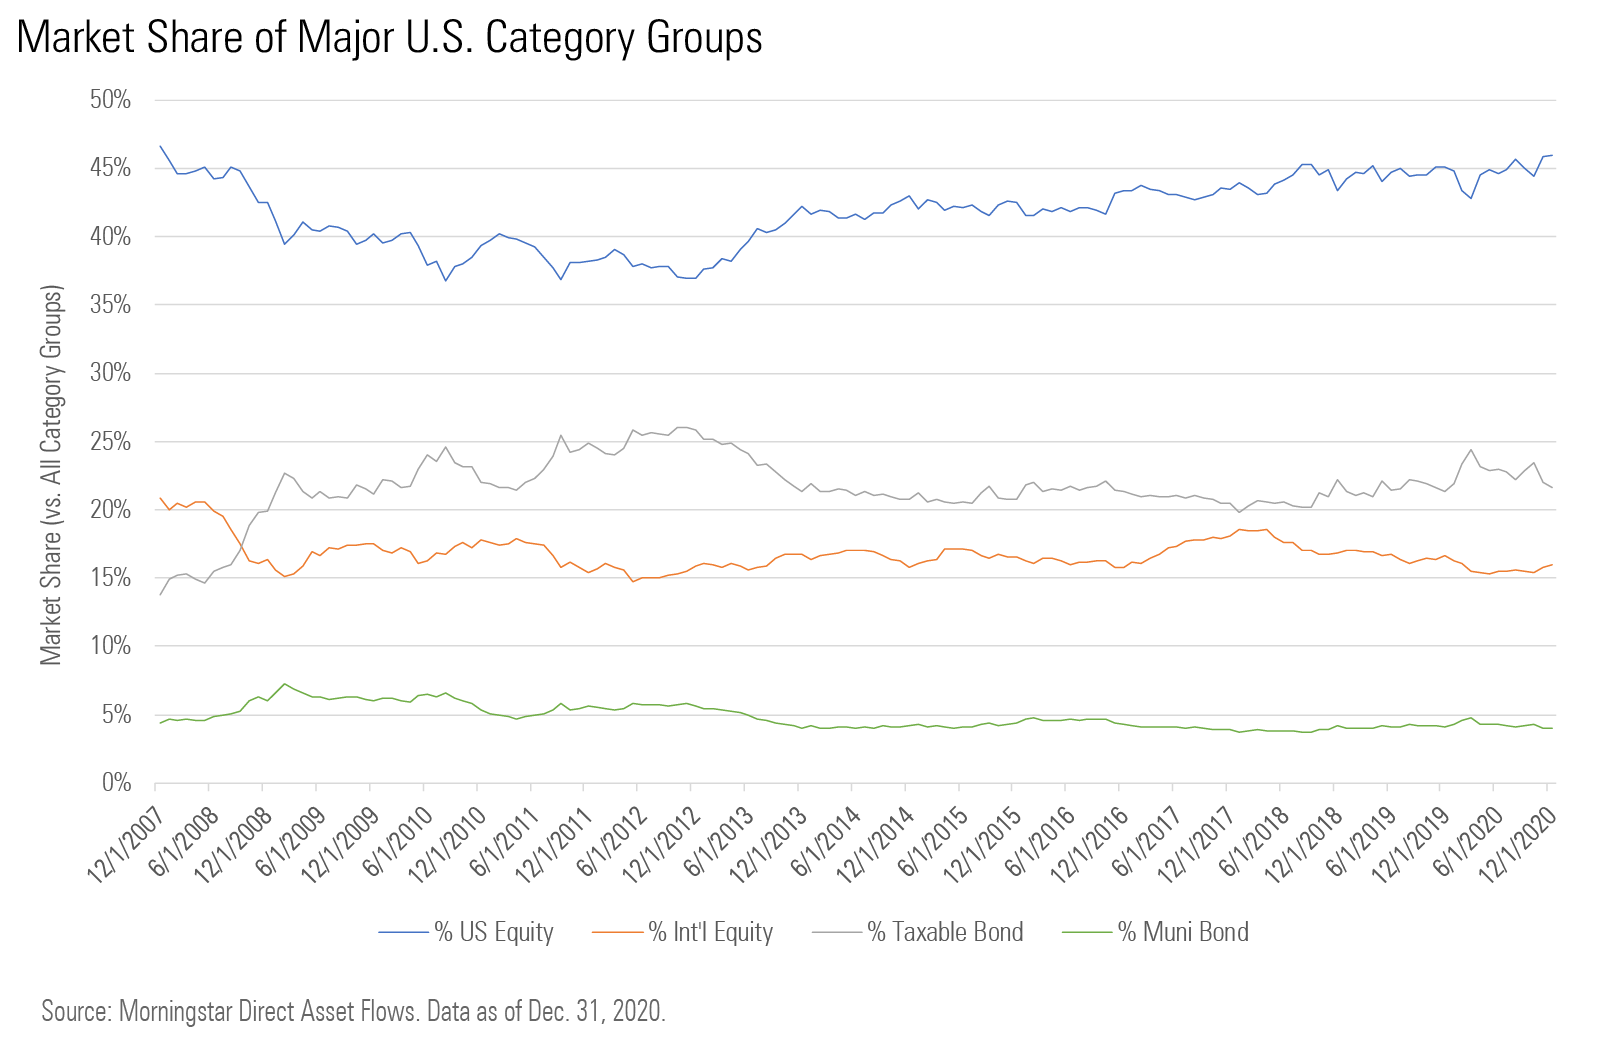
Rebalancing is likely playing a significant role in equity and fixed-income fund flows. In the aggregate, fund investors don't appear to be chasing the ebullient equities market. Whether because of greater individual discipline, the impact of financial advice, changes to investment models and target-date funds, or some combination of those factors, the market shares of equity and fixed-income funds has stayed remarkably stable in recent years despite rising stock prices and heavy bond-fund inflows.
Among the fund families, Vanguard ended 2020 on a high note. Its $25.2 billion of inflows in December was its second-most for the year behind January's $42.7 billion. Vanguard Total Bond Market Index VBMFX and Vanguard Total Bond Market II Index VTBIX were the top two flow-getters in December, collecting a combined $12.6 billion.
Vanguard led all rivals with nearly $141 billion of inflows for the year. That amount--which was greater than the total assets of all but 23 U.S. asset managers in Morningstar's database--was the smallest annual increase since 2013. The firm managed more than $6 trillion of assets in December--26% of all reported long-term net assets.
IShares finished third in December with $11.7 billion of inflows. That pushed the BlackRock unit's calendar-year inflows to $122 billion, second only to Vanguard. It was the firm's fifth consecutive year of $100 billion inflows or greater.
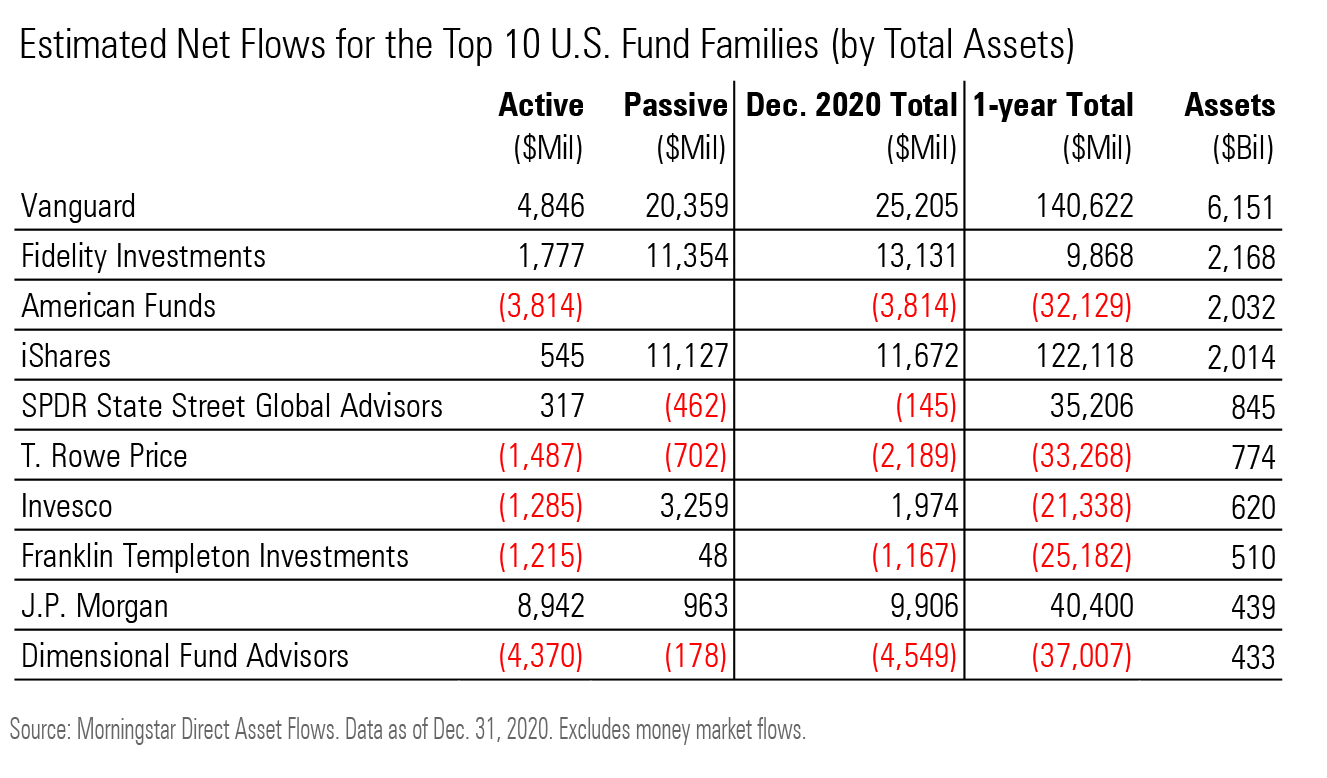
Many large active managers limped into the end of the year. American Funds gave back $3.8 billion in December and $32 billion in 2020--the firm's worst year of outflows since 2012. T. Rowe Price had $2.2 billion of outflows in December and $33 billion for the full year. Franklin Templeton notched its sixth consecutive year of outflows, with $25 billion leaving in 2020.
Dimensional Fund Advisors’ value and small-cap tilts were out of favor in a market dominated by large-cap growth equities. As a result, investors jumped ship: $37 billion left in 2020, for an organic growth rate of negative 8.3% (the worst among the top 10 firms by total assets).
Note: The figures in this report were compiled on Jan. 12, 2021, and reflect only the funds that had reported net assets by that date. Artisan had not reported. Morningstar Direct clients can download the full report here.
/cloudfront-us-east-1.images.arcpublishing.com/morningstar/HDPMMDGUA5CUHI254MRUHYEFWU.png)
/cloudfront-us-east-1.images.arcpublishing.com/morningstar/OMVK3XQEVFDRHGPHSQPIBDENQE.jpg)
:quality(80)/s3.amazonaws.com/arc-authors/morningstar/a25c5a3e-6a5c-495e-9278-eb867855f392.jpg)