
2020 Was a Record Year for ETF Records
Record flows, launches, and closures were among the major milestones.
/s3.amazonaws.com/arc-authors/morningstar/a90ba90e-1da2-48a4-98bf-a476620dbff0.jpg)
Global stock markets put an exclamation point at the end of a remarkable year in December. The Morningstar Global Markets Index--a broad gauge of global equities--gained 4.86% during the month and ended the year 16.07% higher than where it began. After favoring bond exchange-traded funds for most of the year, investors jumped on the equity ETF bandwagon in the final two months of 2020. While the $44.8 billion that investors allocated to stock ETFs in December was sharply lower than November’s record $81.8 billion, it marked the sixth-largest monthly inflow ever into this group. When the books closed on 2020, ETFs had taken in a record $499 billion in net flows and held just under $5.5 trillion of investors’ money.
Here, I will take a closer look at how the major asset classes performed in 2020, where investors were putting their money, and which segments of the market looked cheap and dear at year’s end--all through the lens of ETFs.
Stocks Finish the Year Looking Fairly Valued Exhibit 1 features December performance figures for a sampling of Morningstar Medalist ETFs representing most major asset classes. Investors in a blended global market portfolio gained 3.07% during the month. Stock markets were higher across the board. U.S. stocks, as proxied by iShares Core S&P Total U.S. Stock Market ETF ITOT finished the month trading 8% above their fair value, as measured by the fund's Morningstar price/fair value estimate. Small caps had another strong showing in December. IShares Core S&P Small-Cap ETF IJR gained 8.24% and ended the year trading at a 3% premium to its Morningstar fair value estimate after spending most of the year at a considerable discount. Meanwhile, iShares Core S&P 500 ETF IVV and iShares Core S&P Mid-Cap ETF IJH were trading at respective premiums of 8% and 11%.
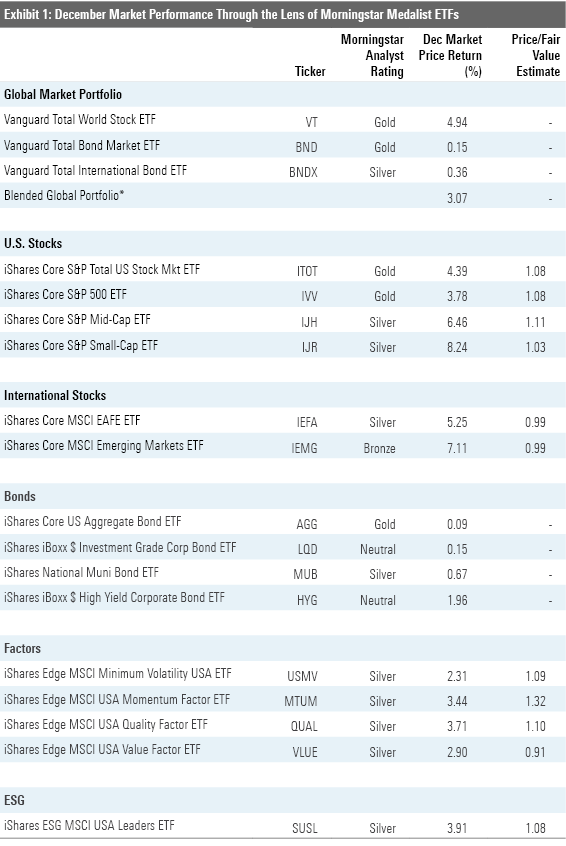
While U.S. small caps turned a corner in November, they still lagged mid- and large caps by a wide margin for the year. IJR trailed IVV by more than 7 percentage points in 2020. Missing out on the gains of the market’s Fab Five (Apple AAPL, Microsoft MSFT, Amazon.com AMZN, Facebook FB, and Alphabet GOOG) and sticking with REITs and regional banks that were hit hard by the coronavirus crisis explains most of IJR’s 2020 underperformance.
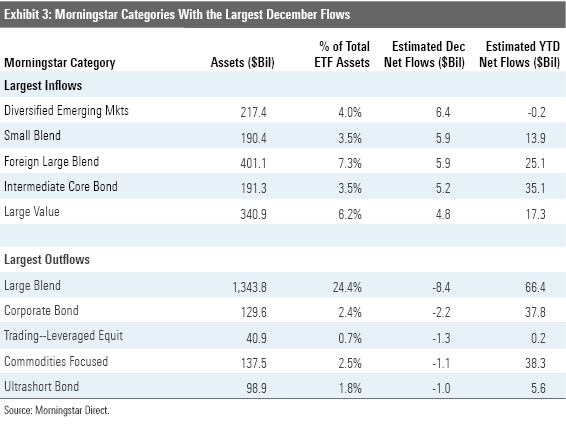
Despite posting double-digit gains during the last two months of the year, value stocks still finished 2020 in the hole. The Morningstar U.S. Value Index rose 18.65% from Nov. 1 through year-end but lost 2.33% for the full year. Meanwhile, the Morningstar U.S. Growth Index gained 44.44% in 2020. ETFs in the large-, mid-, and small-value Morningstar Categories found buyers once again in December. Just over $11 billion flowed into these funds last month. After experiencing net outflows through the first 10 months of 2020, these ETFs gathered nearly $17 billion in net new assets in the last two months of the year.
The spread of valuations among strategic-beta ETFs representing a variety of individual factors speaks to the themes that defined stock markets in 2020. At year-end, after falling 0.32% over the preceding 12 months, iShares MSCI USA Value Factor ETF VLUE was trading at an 9% discount to its Morningstar fair value estimate. It finished October trading 21% below its fair value. On the other hand, iShares MSCI USA Momentum Factor ETF MTUM gained 29.69% in 2020 and closed the year at a 32% premium to its fair value estimate.
A Record Year for ETF Records It was a year of ETF records. New records were set for total flows; flows into bond ETFs; flows into environmental, social, and governance ETFs; and flows into active ETFs. There was a record number of new ETFs launched, and a record number of ETFs closed.
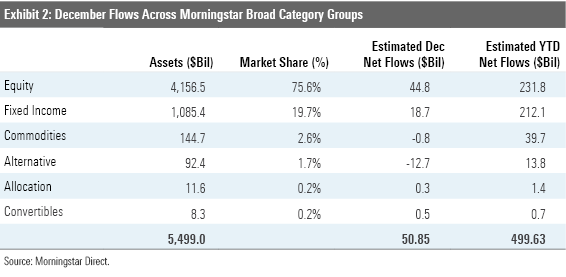
While the $231.8 billion in flows fell shy of a new record for equity ETFs in 2020, they outstripped the record $212.1 billion that investors poured into bond ETFs. Over the course of the year, most flows went to portfolio staples like Vanguard Total Stock Market ETF VTI and Vanguard Total International Stock ETF VXUS. But many investors weren’t willing to suffice for market-matching returns. The Ark family of ETFs shot the lights out in 2020. All five of the firm’s mainline funds produced triple-digit returns. Investors took notice. The firm pulled in $20.5 billion in net flows in 2020, representing 646% organic growth. As 2020 came to a close, the firm ranked as the 11th-largest ETF provider.
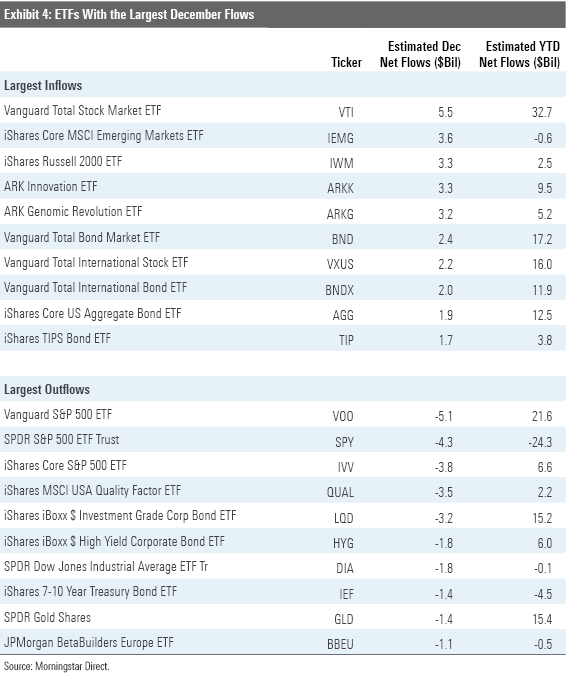
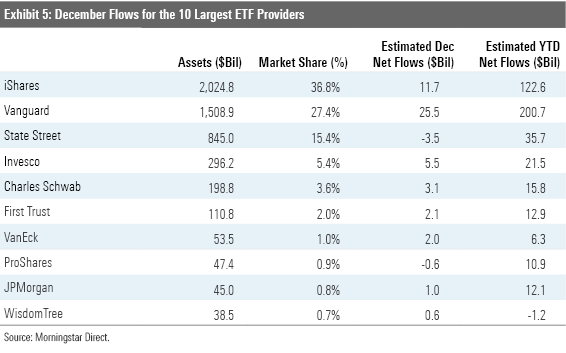
Vanguard was back on top of the ETF flows league table in December. The firm’s ETFs raked in $25.5 billion, putting it well ahead of the competition for the full year. Some of Vanguard's recent ETF flows have resulted from conversions of assets in the firm's Admiral share class to ETF shares, which are now cheaper than the Admiral shares of the same funds after a wave of recent repricing. The firm has since either directly converted some of its investors’ existing Admiral share class allocations to the ETF share class or otherwise nudged investors to do it on their own.
ProShares had record inflows in 2020. The leveraged and inverse ETF specialist brought in $11.1 billion in net new money as investors used these specialized funds to try to capitalize on whipsawing markets. First Trust also had a record haul in 2020. The firm’s ETFs amassed $12.9 billion in net inflows, aided by nearly $3.4 billion of inflows into the First Trust TCW Opportunistic Fixed Income ETF FIXD.
Following a three-month streak of outflows spanning from April to June, Schwab's ETF lineup experienced its sixth consecutive month of inflows in December. Its three-month drought earlier in the year broke the firm's long record of steady net inflows, which had gone uninterrupted from its 2009 inception through April 2020. Outflows were likely driven by changes to the firm's proprietary ETF model portfolios. The firm’s $15.8 billion 2020 flow tally was its lowest since 2015, when its ETFs brought in $14.2 billion.
WisdomTree was alone among the 10 largest ETF issuers in experiencing outflows in 2020. The firm’s currency-hedged duo of WisdomTree Europe Hedged Equity ETF HEDJ and WisdomTree Japan Hedged Equity ETF DXJ--which were once its largest offerings--saw a combined $1.98 billion of outflows for the year. The two funds’ combined assets peaked near $40 billion in 2015. At the end of 2020, the pair held a total of $3.5 billion.
Old Economy Stocks Look Cheap, New Economy Stocks Appear Dear The fair value estimate for ETFs rolls up our equity analysts' fair value estimates for individual stocks and our quantitative fair value estimates for stocks not covered by Morningstar analysts into an aggregate fair value estimate for stock ETF portfolios. Dividing this value by the ETFs' market prices yields the price/fair value ratio. This ratio can point to potential bargains and areas of the market where valuations are stretched.
Exhibit 6 features the 10 ETFs that were trading at the largest discounts and premiums to their fair value estimates as of the end of December. Eight of the 10 funds trading at the largest discounts belong to the equity energy category. Pain was pervasive in the energy sector in 2020 as demand declined and supply continued to flood the market. As producers ran out of places to store their output, prices collapsed, as did the share prices of firms operating in the oil- and gas-services industry.
But the market is a discounting mechanism, and in the last two months of the year, it was hopeful that a return to some semblance of normalcy was in sight as the first doses of coronavirus vaccines were administered. The prospect of reopening the global economy gave a lift to oil prices and energy ETFs. But even after getting a proverbial shot in the arm, valuations in the sector remain depressed and these funds continue to feature prominently in the ETF bargain bin.
Notable among this month’s list of ETFs trading at the largest premiums to their fair value estimates are VanEck Vectors Low Carbon Energy ETF SMOG and iShares Global Clean Energy ETF ICLN. Both ranked among 2020’s top performers. SMOG spiked 118.63% for the year, while shares of ICLN were up 141.31%. Their gains accelerated toward year-end, reflecting investors’ enthusiasm for clean energy names, which increased following the U.S. presidential election and the prospect that the incoming Biden administration will advocate for some form of “Green New Deal.”
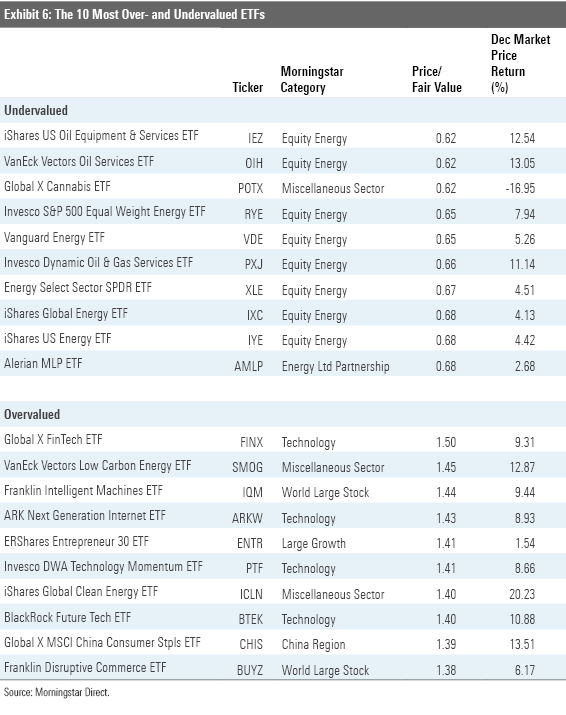
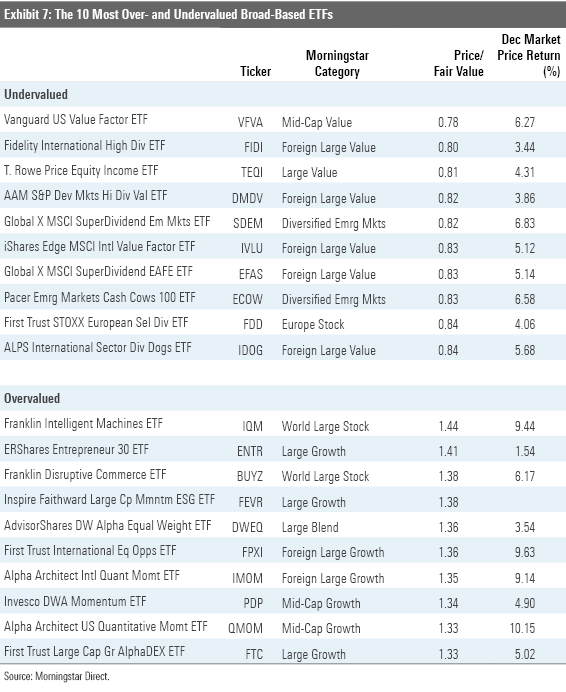
Exhibit 7 features the 10 broad-based ETFs (those belonging to one of the mainline Morningstar Style Box or other broader geographic categories) that were trading at the largest discounts and premiums to their fair value estimates as of month-end. The common thread among all these funds is an orientation toward smaller, cheaper stocks. Some of them deliberately lean into value by virtue of selecting and weighting stocks based on their relative cheapness. This is the case for Vanguard U.S. Value Factor ETF VFVA. Eight value-leaning funds that invest in international stocks also make this month's list. Notable among them is iShares Edge MSCI International Value Factor ETF IVLU, the foreign cousin of VLUE. Like its U.S. counterpart, IVLU takes a sector-neutral approach, sweeping in the cheapest stocks within each sector and weighting them based on a combination of their market cap and the strength of their value characteristics. The result is a portfolio with a strong and consistent value orientation.
Four of the 10 most overvalued broad-based ETFs ply momentum strategies--sweeping in the markets’ best recent performers. At the end of a year where momentum stocks reaped big gains, it isn’t surprising to see these four make the list. Equally unsurprising is the presence of some thematic ETFs that also got swept up in the momentum trade in 2020. Notable among them is Franklin Disruptive Commerce ETF BUYZ, which includes some of last year’s highfliers like Shopify SHOP and Amazon among its top holdings.
Disclosure: Morningstar, Inc. licenses indexes to financial institutions as the tracking indexes for investable products, such as exchange-traded funds, sponsored by the financial institution. The license fee for such use is paid by the sponsoring financial institution based mainly on the total assets of the investable product. Please click here for a list of investable products that track or have tracked a Morningstar index. Neither Morningstar, Inc. nor its investment management division markets, sells, or makes any representations regarding the advisability of investing in any investable product that tracks a Morningstar index.
/cloudfront-us-east-1.images.arcpublishing.com/morningstar/T2LGZCEHBZBJJPPKHO7Y4EEKSM.png)
/d10o6nnig0wrdw.cloudfront.net/04-18-2024/t_34ccafe52c7c46979f1073e515ef92d4_name_file_960x540_1600_v4_.jpg)
/d10o6nnig0wrdw.cloudfront.net/04-09-2024/t_e87d9a06e6904d6f97765a0784117913_name_file_960x540_1600_v4_.jpg)
:quality(80)/s3.amazonaws.com/arc-authors/morningstar/a90ba90e-1da2-48a4-98bf-a476620dbff0.jpg)