
How to Value Berkshire Hathaway
We believe our discounted cash flow approach best captures the company's complexity.

Valuing Berkshire Hathaway BRK.A/BRK.B is an arduous task. The company is a decentralized conglomerate, with operations spanning several different market sectors and a multitude of industries. It is also far less transparent than it should be when reporting results for some parts of its business. Even so, we continue to use a sum-of-the-parts methodology, valuing four segments of the company--the insurance operations, BNSF, Berkshire Hathaway Energy, and the manufacturing, service, and retail operations--where we can make a reasonable effort to strip out their individual operating metrics and utilize a discounted cash flow valuation methodology to value each part separately before combining them to arrive at our fair value estimate for the company as a whole.
Other methods can be used to value the company, and most of them are easier to tabulate than our own. However, they also have limitations owing to their oversimplification, a lack of intuitive justification, and/or a lack of applicability to peer companies. We believe that understanding the benefits and shortfalls of each can provide valuable insight into the ways some investors approach Berkshire’s valuation. While there are limitations to our own process--which requires time and prudence--we believe that using a sum-of-the-parts methodology to value Berkshire provides a more robust and reliable valuation than the other methods.
- Earnings-based multiple valuation methods are simplistic and miss aspects of Berkshire's value. While price/earnings and enterprise value/EBITDA multiples might work well when comparing similar companies operating in the same industry, there are no real comparisons for Berkshire, which is a large collection of disparate companies operating independently of each other, making it difficult to determine the multiple that best reflects the company's overall value.
- Much like the earnings-based multiple approaches, using book value multiples to value Berkshire is simple and straightforward, but it can paint an oversimplified picture with little insight into the company's value drivers. While CEO Warren Buffett has attempted to discourage investors from focusing on book value per share, we still view it as a valuable gauge for assessing changes in Berkshire's intrinsic value--until such time that the company is buying back a ton of its own common stock on a regular basis.
- The two-column approach to valuing Berkshire can be useful but requires prudence. Investors must be careful not to treat all cash and investments as excess capital available to shareholders, as a large percentage of these investments are required to cover Berkshire's insurance and financial operations, and what remains has to be adjusted for taxation and the adverse value outcomes that might crop up when concentrated stock positions are unwound.
- While a float-based method has been widely used over the years, it has become less relevant as Berkshire's operations continue to diversify away from its core insurance operations. The process itself is also extremely sensitive to relatively minor changes to the input variables used to calculate the present value of Berkshire's float: investment returns, the company's cost of float, the growth of its insurance float, and the discount rate.
We believe that each of the aforementioned methods has its failings due to oversimplification, a lack of intuitive justification, and/or a lack of applicability to peer companies. Many of the methods, when used to value the insurance operations, do not seem to work consistently when applied to other insurers. We believe our discounted cash flow approach provides a more robust and reliable valuation for Berkshire Hathaway.
Our DCF Approach Best Captures Berkshire's Complexity We rely on a sum-of-the-parts methodology that values the different businesses separately and then combines these values to arrive at a total value for Berkshire Hathaway. As part of this process, we use discounted cash flow methodologies to value each of the company's major segments: the insurance operations (including the investment portfolio attached to this business), BNSF, Berkshire Hathaway Energy, and the manufacturing, service, and retail operations. Our discounted cash flow approach allows us to explicitly model all of the cash flows, along with necessary reinvestments and excess capital, associated with Berkshire's total enterprise. As a result, we believe it provides investors with a more robust and reliable valuation of the company's shares than any of the shortcut or alternate methods we've examined.
Our valuation model for Berkshire is built on our insurance discounted cash flow template with supplemental models created for the noninsurance businesses in the portfolio. Given the segmentation that exists in Berkshire’s reported financial statements, as well as the fact that both BNSF and BHE are far more transparent than the other operating segments, filing fairly comprehensive 10-Q and 10-K reports even after being folded into Berkshire’s holdings, we are able to strip out and model the results for these businesses. With our discounted cash flow model for insurance companies, we explicitly forecast the income statement, balance sheet, and resulting cash flows for Berkshire’s insurance operations, accounting for earned premium growth, loss and expenses of the insurance operations (which leads to the booking of and increases/decreases in reserves), investment cash flows, and the required capital levels of the business, among numerous other factors, during the initial five-year projection period. We believe this method captures all the different dynamics and moving parts associated with Berkshire’s insurance operations.
The company’s noninsurance operations encompass a wide array of businesses, including BNSF (railroad), Berkshire Hathaway Energy (energy generation and distribution), Precision Castparts (aerospace and power/energy components), Lubrizol (specialty chemicals), Clayton Homes (manufactured housing), Marmon (industrial conglomerate), IMC/ISCAR (metalworking), Shaw Industries (carpeting and flooring), Forest River (recreational vehicles), Johns Manville (building products), TTI (specialty manufacturing distributor), and MiTek Industries (building products). We model three distinct segments--BNSF, BHE, and the manufacturing, service, and retailing segment (which includes all of the noninsurance operations that are not housed in either BNSF or BHE)--to the extent of the level of information we have to work with for each of these areas of operation. Much like we do with Berkshire’s insurance operations, we use a discounted cash flow approach to model the growth and profitability of each of these segments, along with the cash flows and investments necessary to support this growth, to arrive at our fair value estimates.
In a few cases, we will triangulate the DCF-derived estimates with multiple-based approaches--including EV/EBITDA and price/book--to arrive at our final per-share fair value estimate. As part of this process, we also run BNSF and BHE through our general discounted cash flow model, further ensuring that our fair value estimate for each of these subsidiaries is within range of the stand-alone valuations that can be produced for each company, and ensuring that their valuations are in line with the rest of our coverage. Once we’ve calculated our per-share fair value estimates for each of the segments, we roll them up to arrive at our total value for the company. We believe that our approach to valuing Berkshire allows us to capture more than a few important valuation factors that a quick back-of-the-envelope approach is likely to miss, But we also recognize that, as with most models, a DCF model is only as good as its inputs, which require a broader level of knowledge about each of the operations being valued.
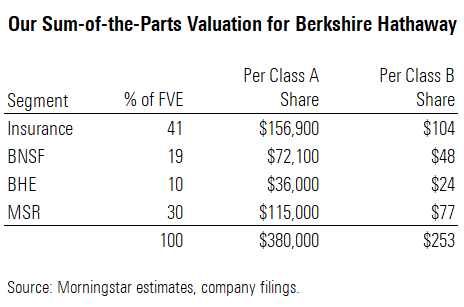
- Insurance continues to be an important contributor to Berkshire's overall value. During 2015-19, insurance unit (including the bulk of its investment portfolio) accounted for 22% of Berkshire's pretax earnings and an estimated 39% of free cash flow on average. It currently accounts for 41% of our fair value estimate for the company. Buffett has traditionally relied on the large amounts of float generated by these operations to make investments and acquisitions that not only support the insurance business, but also can create long-term value.
- BNSF is another large contributor to Berkshire's overall value. During the past five years, the railroad operations accounted for 25% of Berkshire's pretax earnings and an estimated 16% of free cash flow on average. BNSF is the largest freight railroad in North America, with 40,750 employees moving 70,000 company-owned or leased freight cars using 8,000 locomotives over 32,500 miles of track in 28 states and three Canadian provinces. It is expected to produce revenue of $20.8 billion and EBITDA of $8.0 billion during 2020.
- While a smaller contributor to Berkshire's overall value, Berkshire Hathaway Energy remains a key area of investment. During 2015-19, BHE accounted for 10% of Berkshire's pretax earnings and an estimated 3% of free cash flow on average. BHE should continue to have an advantage over its publicly traded peers when it comes to capital expenditures and acquisitions because of the greater amount of freed-up internally generated capital the company has available to spend, its ability to tap Berkshire's balance sheet for larger deals, and a speedier decision-making process for acquisitions at Berkshire and its subsidiaries.
- The manufacturing, service, and retail segment is one of the largest contributors to Berkshire's overall value. During the past five years, the MSR operations accounted for 43% of Berkshire's pretax earnings and an estimated 42% of free cash flow on average. This segment is one of the hardest parts of Berkshire's business to evaluate, as it houses more than 70 different subsidiaries, tends to be more economically sensitive and more acquisitive than the rest of the operations, and offers very little financial information.
We believe Berkshire Hathaway offers one of the better risk-adjusted returns in the financial services sector. We continue to be impressed by its ability to generate high-single-digit to double-digit growth in book value per share (in most years), comfortably above our estimate of the company’s cost of capital. We believe that it will take some time before Berkshire finally succumbs to the impediments created by the sheer size and scale of its operations, and that the ultimate departure of Buffett and vice chairman Charlie Munger will have less of an impact on the business than many believe it will. Therefore, we are always looking for opportunities to put money to work in the name.
/cloudfront-us-east-1.images.arcpublishing.com/morningstar/TP6GAISC4JE65KVOI3YEE34HGU.jpg)
/cloudfront-us-east-1.images.arcpublishing.com/morningstar/RFJBWBYYTARXBNOTU6VL4VSE4Q.png)
/cloudfront-us-east-1.images.arcpublishing.com/morningstar/YQGRDUDPP5HGHPGKP7VCZ7EQ4E.jpg)