
ETF Flows Smash Record
Investors poured an estimated $81.8 billion into equity ETFs in November.
/s3.amazonaws.com/arc-authors/morningstar/a90ba90e-1da2-48a4-98bf-a476620dbff0.jpg)
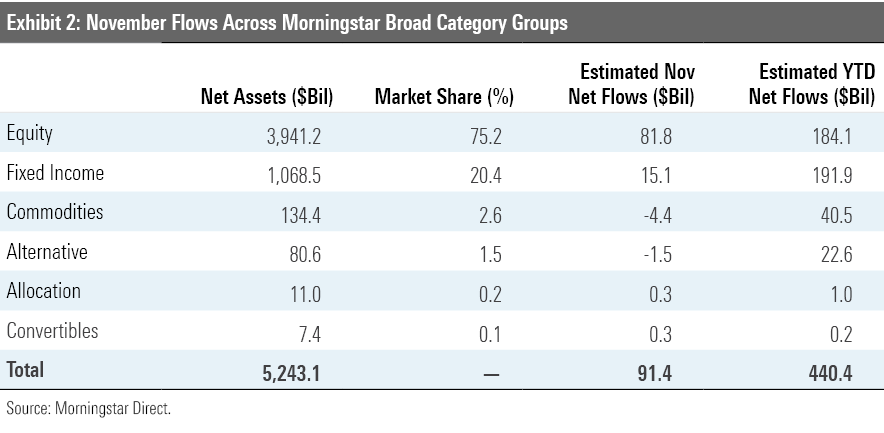
After slumping for two straight months, global stock markets rallied in November. The Morningstar Global Markets Index--a broad gauge of global stock markets--climbed 12.61% during the month. Using the MSCI All Country World Index as a proxy, this marked the best month for global stock markets in at least 20 years. Exchange-traded fund investors went along for the ride. After months of relatively tepid demand, equity ETFs experienced a surge of inflows, amounting to an estimated $81.8 billion. This pushed total monthly flows into ETFs to a record $91.4 billion, smashing the prior monthly record of $63.4 billion from June 2019.
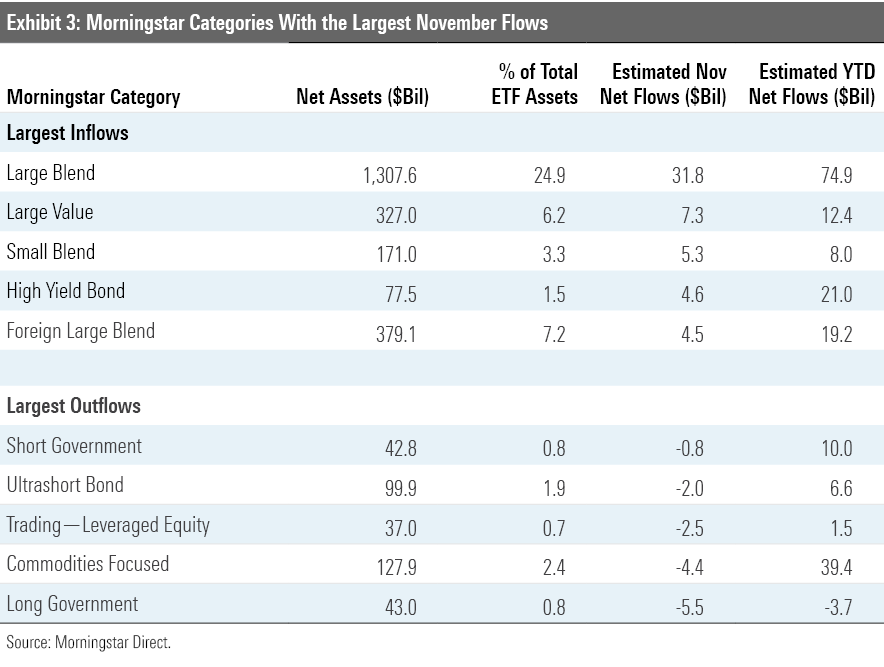
Bonds also notched gains in November. The Morningstar U.S. Core Bond Index--a barometer of U.S. fixed-income markets--rose 0.96%, as long-term Treasury yields ticked lower and credit spreads tightened. Flows into bond ETFs slowed, clocking in at an estimated $15.1 billion. Flows were mixed across fixed-income categories. Investors added money to high-yield bond ETFs and withdrew from government and ultrashort-duration bond ETFs.
Here, I will take a closer look at how the major asset classes performed last month, where investors were putting their money, and which segments of the market look cheap and dear--all through the lens of ETFs.
November's Rally Put U.S. Stocks Above Fair Value Exhibit 1 features November performance figures for a sampling of Morningstar Medalist ETFs representing most major asset classes. Investors in a blended global market portfolio gained 7.74% during the month. Stock markets were higher across the board. U.S. stocks, as proxied by iShares Core S&P Total U.S. Stock Market ETF ITOT finished the month trading 6% above their fair value, as measured by the fund's Morningstar Price/Fair Value Estimate. It was a record month for U.S. small caps. The Russell 2000 Index, the longest-standing measure of this segment of the market, shot up 18.43%. This was the largest monthly gain in the benchmark's history. At the end of November, iShares Core S&P Small-Cap ETF IJR was trading at a 1% premium to its Morningstar Fair Value Estimate, while iShares Core S&P 500 ETF IVV and iShares Core S&P Mid-Cap ETF IJH were trading at respective premiums of 5% and 9%.
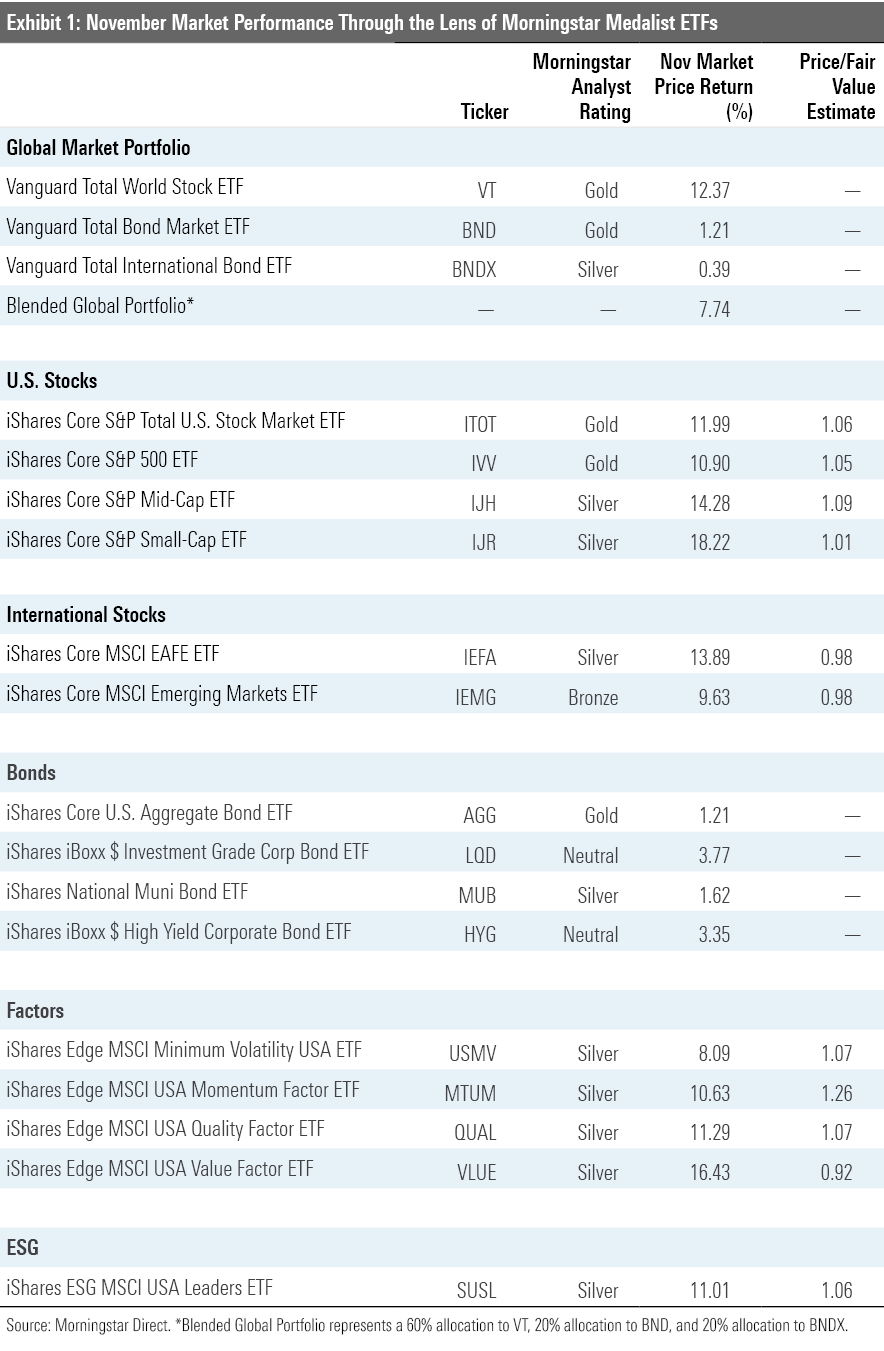
While U.S. small caps’ fortunes took a sharp turn for the better, they’ve still lagged mid- and large caps by a wide margin for the year to date. IJR still trails IVV by more than 11 percentage points through the first 11 months of the year. Missing out on the gains of the market’s Fab 5 (Apple AAPL, Microsoft MSFT, Amazon.com AMZN, Facebook FB, and Alphabet GOOG) and sticking with REITs and regional banks that have been hit hard by the coronavirus crisis explains most of IJR’s 2020 underperformance.
Value stocks had their best month in years in November. The Morningstar U.S. Value Index rose 14.44%, while the Morningstar U.S. Growth Index was up 10.60%. But it is probably too early to call it a comeback for value stocks. And even if November proves to mark the beginning of a turnaround, they still have plenty of catching up to do. For the year to date through November, the growth index was up 38.89%, while its value counterpart was down 5.80%. ETFs in the large-, mid-, and small-value Morningstar Categories found buyers in November. Just over $11 billion flowed into these funds last month. This figure is 240 times the $45.9 million that these same funds attracted during the first 10 months of 2020.
Recent patterns in leadership among strategic-beta ETFs representing a variety of individual factors was shaken up in light of value stocks’ strong showing and momentum’s slide. After a strong showing, iShares MSCI USA Value Factor ETF VLUE was trading at an 8% discount to its Morningstar fair value estimate at month's end. It finished October trading 21% below its fair value. While iShares MSCI USA Minimum Volatility Factor ETF USMV didn’t experience quite the same burst, it quietly had its best month since April, gaining 8.2%. The volatility-conscious portfolio closed the month at a 7% premium to its fair value estimate.
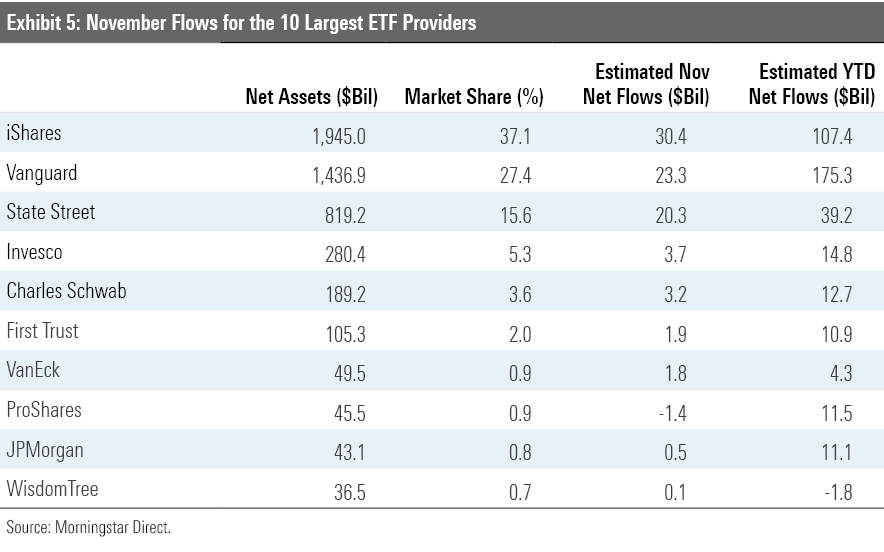
Investors Pile Into Equity ETFs, Setting a Record and Putting Another in Sight While 2020 has been a banner year for bond ETFs, their equity counterparts stole the show in November, amassing $81.8 billion in net new flows. At $91.4 billion, flows into all ETFs notched a new monthly record and put the year-to-date tally at $440.4 billion. If December flows are in the neighborhood of their average level in recent years, 2020 could be a record year for ETF flows.
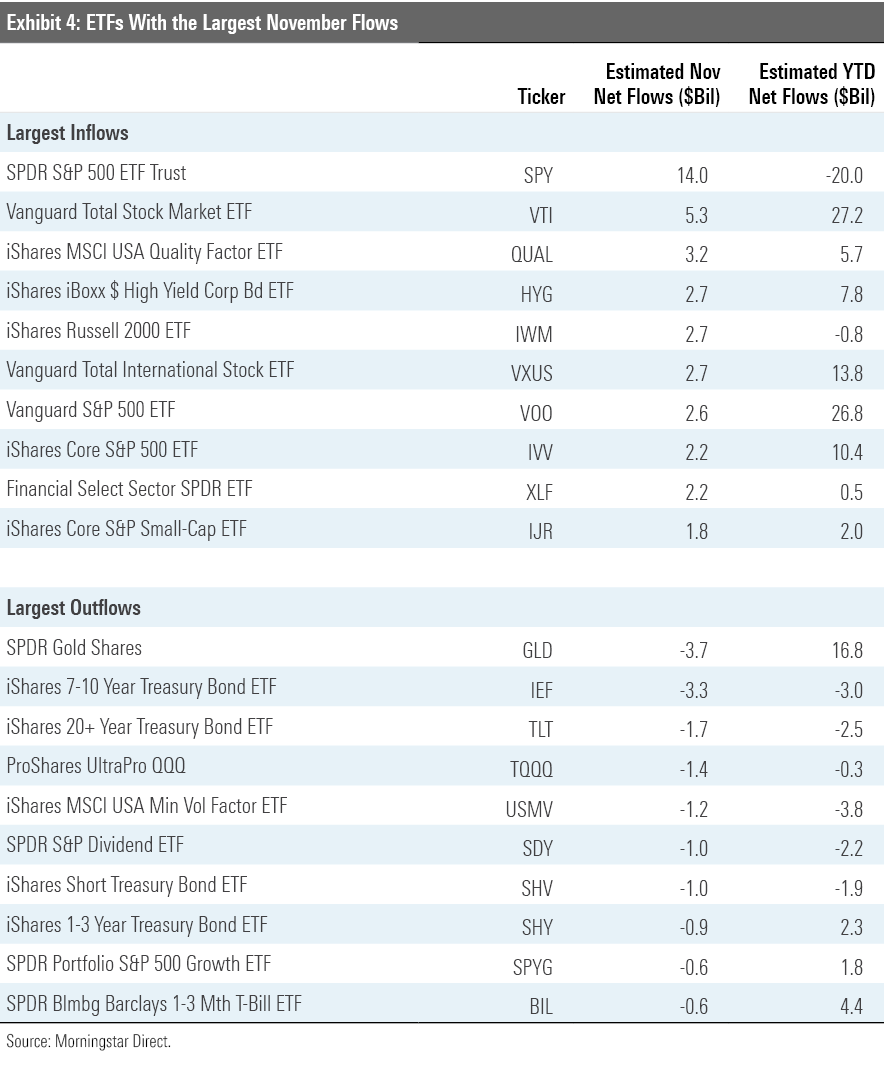
Of the estimated $81.8 billion that filed into stock ETFs, most flows went to portfolio staples like Vanguard Total Stock Market ETF VTI and Vanguard Total International Stock ETF VXUS. SPDR S&P 500 ETF SPY had the largest inflows of any ETF by a wide margin, amassing $14 billion in net new assets. Last month, the fund saw $10 billion in outflows. Big swings like this have long been the name of the game for the granddaddy of all U.S. ETFs, which has become a favorite of investors with big liquidity needs and short time horizons.
SPDR Gold Shares GLD led the list of ETFs with the biggest outflows, losing $3.7 billion in assets. The fund had benefited from flight-to-safety flows earlier in the year, which morphed into a fear-of-inflation trade. As some of the concerns that had driven these flows have subsided, flows have reversed, a familiar pattern for this fund.
BlackRock’s iShares ETF range topped the flows league table in November. The firm’s ETFs raked in $30.4 billion. Vanguard had another big month of inflows in November. The firm’s ETFs brought in $23.3 billion in net new money, bringing its year-to-date total to $175.3 billion, which lands it at the top of the pile. It is important to note that a portion of Vanguard's ETF flows have resulted from conversions of assets in the firm's Admiral share class to ETF shares, which, following a wave of repricing that was implemented over the past year, are now cheaper than the Admiral shares of the same funds.
Following a three-month streak of outflows spanning from April to June, Schwab's ETF lineup experienced its fifth consecutive month of inflows in November. Its three-month drought broke the firm's long record of steady net inflows, which had gone uninterrupted from its 2009 inception through April of this year. Outflows were likely driven by changes to the firm's proprietary ETF model portfolios.
WisdomTree remains alone among the 10 largest ETF issuers in experiencing outflows in 2020. The firm’s currency-hedged duo of WisdomTree Europe Hedged Equity ETF HEDJ and WisdomTree Japan Hedged Equity ETF DXJ have seen a combined $1.9 billion of outflows through the first 11 months of the year. The relative underperformance of European and Japanese stocks versus the U.S. and the weakness of the U.S. dollar have no doubt played some part in driving these outflows.
Energy Stocks Bounce Back The fair value estimate for ETFs rolls up our equity analysts' fair value estimates for individual stocks, and our quantitative fair value estimates for stocks not covered by Morningstar analysts, into an aggregate fair value estimate for stock ETF portfolios. Dividing this value by the ETFs' market prices yields the price/fair value ratio. This ratio can point to potential bargains and areas of the market where valuations are stretched.
Exhibit 6 features the 10 ETFs that were trading at the largest discounts and premiums to their fair value estimates as of the end of November. Nine of the 10 funds trading at the largest discounts belong to the equity energy category. Pain has been pervasive in the energy sector this year as demand has declined and supply has continued to flood the market. As producers ran out of places to store their output, prices collapsed, as did the share prices of firms operating in the oil- and gas-services industry.
But the market is a discounting mechanism, and in November, it was hopeful that a return to some semblance of normalcy was in sight following news of successful coronavirus vaccine trials. The prospect of reopening the global economy gave a lift to oil prices and energy ETFs. November gains among the list featured in Exhibit 6 ranged from 27.39% to 44.14%.
Notable among this month’s list of ETFs trading at the largest premiums to their fair value estimates are VanEck Vectors Low Carbon Energy ETF SMOG and iShares Global Clean Energy ETF ICLN. Both rank among this year’s best performers. SMOG had spiked 94.57% for the year to date through November, while shares of ICLN were up 101.98%. Their noteworthy November gains reflect investors’ enthusiasm for clean energy names, which only increased following the U.S. presidential election and the prospect that the incoming Biden administration will advocate for some form of “Green New Deal.”
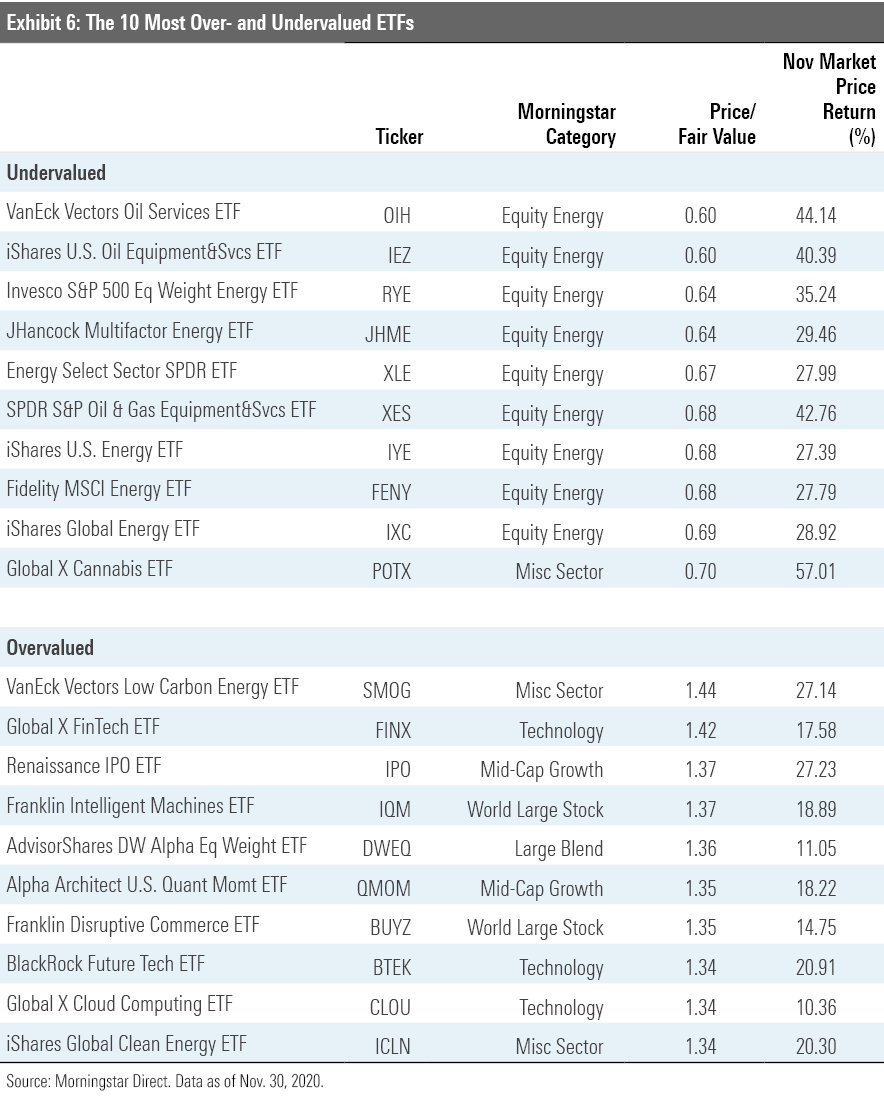
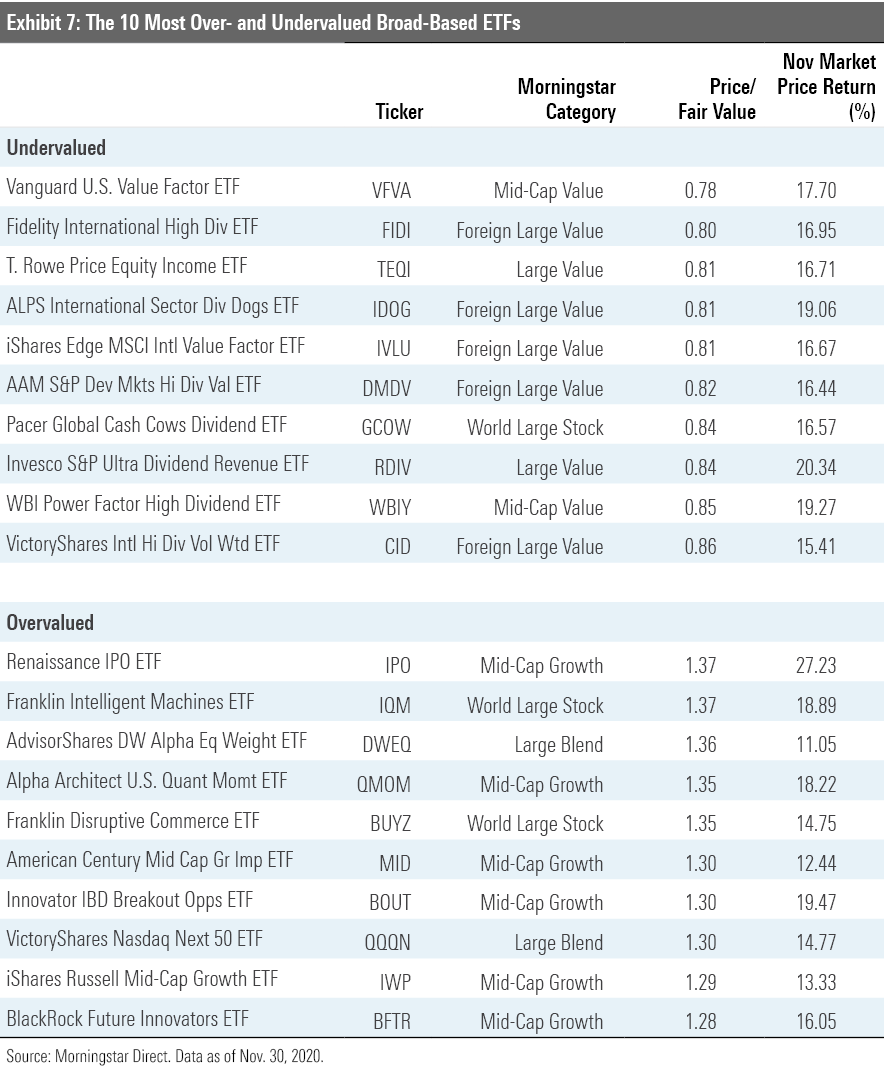
Exhibit 7 features the 10 broad-based ETFs (those belonging to one of the mainline Morningstar Style Box or other broader geographic categories) that were trading at the largest discounts and premiums to their fair value estimates as of month-end. The common thread among nine of the 10 most undervalued funds is an orientation toward smaller, cheaper stocks. Some of them deliberately lean into value by virtue of selecting and weighting stocks based on their relative cheapness. This is the case for Vanguard U.S. Value Factor ETF VFVA. Six value-oriented funds that invest in international stocks also make this month's list. Notable among them is iShares Edge MSCI International Value Factor ETF IVLU, the foreign cousin of VLUE. Like its U.S. counterpart, IVLU takes a sector-neutral approach, sweeping in the cheapest stocks within each sector and weighting them based on a combination of their market cap and the strength of their value characteristics. The result is a portfolio with a strong and consistent value orientation.
Six of the 10 most overvalued broad-based ETFs call the mid-growth category home. Among the nine categories that make up the U.S. equity style box, mid-growth has been the best performer for the year to date. The average fund in the group has gained 30.78%. In fact, it has only lagged two other categories: consumer cyclical, where the average fund gained 33.97% in the first 11 months of the year; and technology, which averaged 45.10%.
Disclosure: Morningstar, Inc. licenses indexes to financial institutions as the tracking indexes for investable products, such as exchange-traded funds, sponsored by the financial institution. The license fee for such use is paid by the sponsoring financial institution based mainly on the total assets of the investable product. Please click here for a list of investable products that track or have tracked a Morningstar index. Neither Morningstar, Inc. nor its investment management division markets, sells, or makes any representations regarding the advisability of investing in any investable product that tracks a Morningstar index.
/cloudfront-us-east-1.images.arcpublishing.com/morningstar/T2LGZCEHBZBJJPPKHO7Y4EEKSM.png)
/d10o6nnig0wrdw.cloudfront.net/04-18-2024/t_34ccafe52c7c46979f1073e515ef92d4_name_file_960x540_1600_v4_.jpg)
/d10o6nnig0wrdw.cloudfront.net/04-09-2024/t_e87d9a06e6904d6f97765a0784117913_name_file_960x540_1600_v4_.jpg)
:quality(80)/s3.amazonaws.com/arc-authors/morningstar/a90ba90e-1da2-48a4-98bf-a476620dbff0.jpg)