
Bond ETF Assets Pass $1 Trillion in October
This has been a seminal year for fixed-income ETFs.
/s3.amazonaws.com/arc-authors/morningstar/a90ba90e-1da2-48a4-98bf-a476620dbff0.jpg)
Global stock markets slid for the second month in a row in October. The Morningstar Global Markets Index--a broad gauge of global stock markets--fell 2.19% during the month. Meanwhile, the Morningstar U.S. Core Bond Index--a barometer of U.S. fixed-income markets--ticked down 0.42%, as long-term Treasury yields climbed. This marks back-to-back months of losses for both indexes. Over the past 20 years, these two indexes have both posted negative monthly returns just 12.5% of the time. This marks the fifth time they’ve strung together two consecutive losing months in the past two decades.
Here, I will take a closer look at how the major asset classes performed last month, where investors were putting their money, and which segments of the market look cheap and dear--all through the lens of exchange-traded funds.
October's Losses Left U.S. Stocks Slightly Below Fair Value Exhibit 1 features October performance figures for a sampling of Morningstar Medalist ETFs representing most major asset classes. Investors in a blended global market portfolio lost 1.27% during the month. Stock markets were down across the board. U.S. stocks, as proxied by iShares Core S&P Total U.S. Stock Market ETF ITOT came back toward their fair value, as measured by the fund's Morningstar Price/Fair Value Estimate. However, valuations look more compelling further down the market-cap ladder. U.S. small caps look cheap relative to mid-caps and large caps. At the end of September, iShares Core S&P Small-Cap ETF IJR was trading at a 15% discount to its Morningstar Fair Value Estimate.
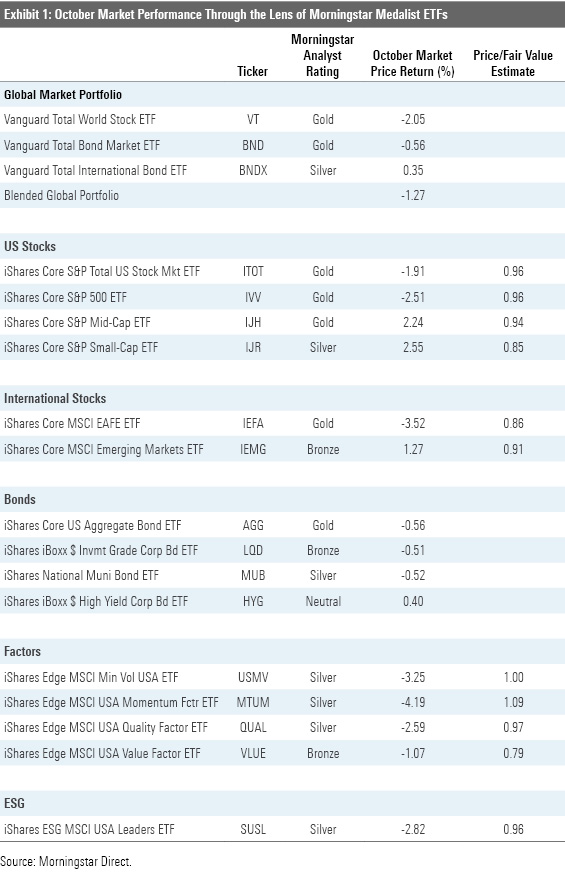
U.S. small caps’ fortunes reversed in October. IJR gained 2.6%, while iShares Core S&P 500 ETF IVV slid 2.7%. IJR still lags IVV by nearly 16 percentage points for the year-to-date through October. Missing out on the gains of the market’s Fab 5 (Apple AAPL, Microsoft MSFT, Amazon.com AMZN, Facebook FB, and Alphabet GOOG) and sticking with REITs and regional banks that have been hit hard by the coronavirus crisis explains most of IJR’s underperformance.
Value stocks bested growth stocks for the second month in a row. The Morningstar US Value Index fell nearly 1.4%, while the Morningstar US Growth Index dropped 2.1%. Value stocks are still deep in a hole. For the year to date through October, the growth index was up 25.6%, while its value counterpart was down 17.7%. This has started to bring some contrarians out of the woodwork. In October, ETFs in the large-, mid-, and small-value Morningstar Categories saw inflows of nearly $2.1 billion, marking each category’s third consecutive month of net inflows.
Strategic-beta ETFs representing a variety of individual factors had a mixed showing versus the broader U.S. stock market. Value beat growth in October, but it got cheaper. IShares Edge MSCI USA Value Factor ETF VLUE was trading at a 21% discount to its Morningstar fair value estimate at month's end. Meanwhile, momentum stocks lost steam. IShares MSCI USA Momentum Factor ETF MTUM fell 4.2% during the month and finished at a 9% premium to its fair value estimate.
Big Numbers in Bond ETFs Fixed-income ETFs took in $21.7 billion in net new flows in October, up from $12.6 billion in September. At $177 billion, year-to-date flows into fixed-income ETFs have eclipsed the annual record of $156 billion set in 2019. This also helped to push the total amount of assets in bond ETFs above $1 trillion for the first time. By any measure, this has been a seminal year for this category.
Exhibit 2: Estimated Net Flows by Global Broad Category ($ Bil)
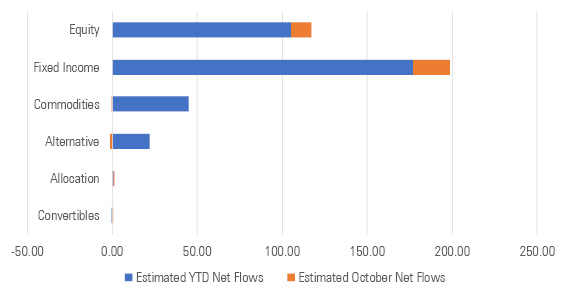
Source: Morningstar Direct.
Stock ETFs gathered $11.9 billion in net new assets in October. Most flows went to portfolio staples like Vanguard Total Stock Market ETF VTI and Vanguard Total International Stock ETF VXUS. SPDR S&P 500 ETF SPY had the largest outflows of any ETF by a wide margin, watching over $10 billion walk out the door. For years, the fund has been losing market share among S&P 500 trackers to its cheaper and more modern competitors IVV, Vanguard S&P 500 ETF VOO, and most recently its own kin, SPDR Portfolio S&P 500 ETF SPLG.
Exhibit 3: Estimated Flows by Morningstar Category
Source: Morningstar Direct.
Vanguard had another big month of inflows in October. The firm’s ETFs brought in $19.4 billion in net new money. On a year-to-date basis, Vanguard’s $152 billion in ETF flows were only slightly less than the sum of its nine largest competitors ($152.3 billion). It is important to note that a portion of Vanguard's ETF flows have resulted from conversions of assets in the firm's Admiral share class to ETF shares, which, following a wave of repricing that was implemented over the past year, are now cheaper than the Admiral shares of the same funds.
Following a three-month streak of outflows that spanned from April to June, Schwab's ETF lineup experienced its fourth consecutive month of inflows in October. Its three-month drought broke the firm's long record of steady net inflows, which had gone uninterrupted from its 2009 inception through April of this year. Outflows were likely driven by changes to the firm's own proprietary ETF model portfolios.
WisdomTree remains alone among the 10-largest ETF issuers in experiencing outflows for the year to date through October. The firm’s currency-hedged duo of WisdomTree Europe Hedged Equity ETF HEDJ and WisdomTree Japan Hedged Equity ETF DXJ have seen a combined $1.9 billion of outflows through the first 10 months of the year. The relative underperformance of European and Japanese stocks versus the U.S., and the weakness of the U.S. dollar, have no doubt played some part in driving these outflows.
Exhibit 5: Estimated Net Flows by ETF Provider ($Bil)
Source: Morningstar Direct.
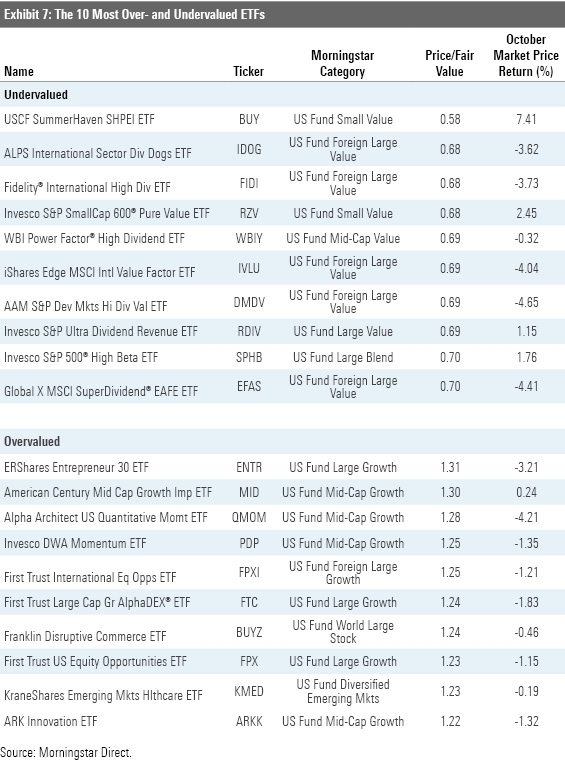
There May Be Value in Foreign Developed Value Stocks The Morningstar fair value estimate for ETFs rolls up our equity analysts' fair value estimates for individual stocks and our quantitative fair value estimates for stocks not covered by Morningstar analysts, into an aggregate fair value estimate for stock ETF portfolios. Dividing this value by the ETFs' market prices yields the price/fair value ratio. This ratio can point to potential bargains and areas of the market where valuations are stretched.
Exhibit 7 features the 10 ETFs that were trading at the largest discounts and premiums to their fair value estimates as of the end of October. All 10 of the funds trading at the largest discounts belong to the equity energy category. Pain has been pervasive in the energy sector this year as demand has declined and supply has continued to flood the market. As producers ran out of places to store their output, prices collapsed, as did the share prices of firms operating in the oil- and gas-service industry.
But the market is a discounting mechanism, and just as the oil patch appeared to be on the brink, many investors began wagering that the worst had passed. After a sharp rebound off the bottom, oil prices have normalized and energy stocks' gains have stalled. There has been a fresh wave of selling in September and October, as oil prices have been pressed lower by expanding inventories, fears that a global surge in COVID-19 cases will further curb demand, and a slowdown in China’s oil consumption.
While oil and its old-economy cohorts have suffered, new economy stocks have benefited from our abrupt shift from commuting to computing. Tech-focused funds dominate the ranks of the most overvalued ETFs. Notable among them are Ark Next Generation Internet ETF ARKW and Global X Cloud Computing ETF CLOU. Both funds were at least 31% overvalued as of the end of October. Investors' enthusiasm for the stocks that these funds own has grown amid a worldwide lockdown that's forced many people to work, shop, and live online. We have seen a number of new ETFs added to the menu this year that aim to capitalize on these trends. While their narratives may be compelling, and their recent returns enticing, investors would do well to approach these thematic funds with caution.
Exhibit 6 features the 10 broad-based ETFs (those belonging to one of the mainline Morningstar Style Box or other broader geographic categories) that were trading at the largest discounts and premiums to their fair value estimates as of month-end. The common thread among nine of the 10 most undervalued funds is an orientation toward smaller, cheaper stocks. Some of them deliberately lean into value by virtue of selecting and weighting stocks based on their relative cheapness. This is the case for Invesco S&P SmallCap 600 Pure Value ETF RZV. Four value-oriented funds that invest in international stocks also make this month's list. Notable among them is iShares Edge MSCI International Value Factor ETF IVLU, the foreign cousin of VLUE. Like its U.S. counterpart, IVLU takes a sector-neutral approach, sweeping in the cheapest stocks within each sector and weighting them based on a combination of their market cap and the strength of their value characteristics. The result is a portfolio with a strong and consistent value orientation.
The most overvalued broad-based ETFs include a number of funds with a momentum focus. Alpha Architect U.S. Quantitative Momentum ETF QMOM and Invesco DWA Momentum ETF PDP both spin highly concentrated, high-octane momentum portfolios by design. Folding in names that are priced at premium multiples is embedded in these funds' DNA. ERShares Entrepreneur 30 ETF ENTR finished the month trading 31% higher than its Morningstar fair value estimate. The fund has gained nearly 31% for the year to date through October, getting a lift from large stakes in top-performing stocks like Amazon, Nvidia NVDA, and Tesla TSLA.
/cloudfront-us-east-1.images.arcpublishing.com/morningstar/T2LGZCEHBZBJJPPKHO7Y4EEKSM.png)
/d10o6nnig0wrdw.cloudfront.net/04-18-2024/t_34ccafe52c7c46979f1073e515ef92d4_name_file_960x540_1600_v4_.jpg)
/d10o6nnig0wrdw.cloudfront.net/04-09-2024/t_e87d9a06e6904d6f97765a0784117913_name_file_960x540_1600_v4_.jpg)
:quality(80)/s3.amazonaws.com/arc-authors/morningstar/a90ba90e-1da2-48a4-98bf-a476620dbff0.jpg)