
Not All Momentum Rallies Are Led by Tech; This One Sure Is
Investors often equate momentum markets with growth and tech stocks--and this year's rally met those qualifications. But that's not always the case.

There are momentum markets, and then there are MOMENTUM markets. The stock market's rally from its coronavirus-driven lows in March 2020 qualifies as the latter: Stocks that were going up kept going up, and the laggards kept lagging, leading to a winning streak that is unprecedented in the past decade. And momentum has been driving portfolios higher than any other factor.
These dynamics also played out at the mutual fund level. Growth-focused strategies whose stock-picking led them to hold stocks with a high degree of momentum have been leading in returns. For the first eight months of 2020, funds that were in the top quintile for both growth and momentum exposure gained 29.5% compared with the S&P 500's 9.7% gain.
What made this momentum market different was that it was dominated by growth and technology stocks to a degree not seen since the collapse of the dot-com bubble two decades ago. In the minds of many investors, growth, tech, and momentum investing may seem intertwined. But historically that has not been the case.
Notably, some dedicated passive momentum strategies have lagged, apparently because they didn't hold the largest, growthiest stocks. For example, SPDR S&P 1500 Momentum Tilt ETF MMTM, which casts a slightly wider net than the S&P 500, beat that index with a 13.8% return for the first eight months of the year. However, it was notably a step down from the most growth-exposed momentum funds.
Momentum and Returns For Morningstar's Risk Model, factors are drivers of portfolio return, where a factor's premium is how much return you obtain per unit of exposure for a period of time. They range from easy-to-access contributors such as stock size (small or large cap) to more esoteric factors such as quality or momentum. The momentum premium's cumulative return for the past 10 years was 40.2%, far outpacing the returns of other factors, including that of the second-most-positive factor, quality at 7.6%.
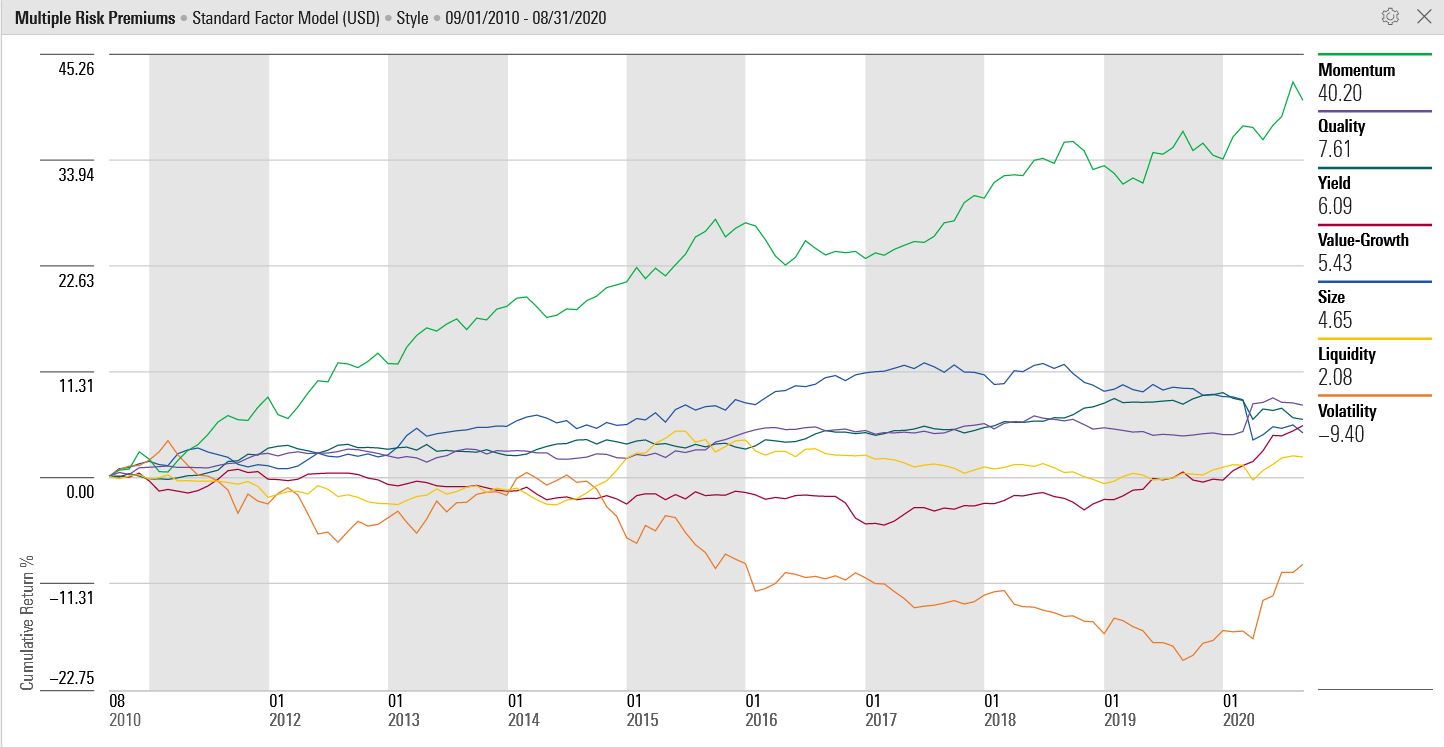
Source: Morningstar.
Another aspect of the momentum-and-growth stock market has been the widening gap between the stock market's winners and losers. Our definition of growth is consistent with the Morningstar Style Box, where growth stocks have high growth rates of earnings, book value, revenue, and cash flow.
Much of the stock market's rally from its March lows was confined to several large technology firms, including Apple AAPL, Amazon.com AMZN, Alphabet GOOGL, Facebook FB, and Microsoft MSFT. In the first eight months of 2020, the S&P 500's outperforming constituents outperformed by a market-value-weighted average of 47.6%, and the underperformers underperformed by 21.1%. This was the largest disparity in the past 20 years.
At the mutual fund level, these dynamics were most visible through the growth-versus-value performance gap. Growth stocks--which as the data show have had a strong overlap with momentum--have been leaving value stocks further and further in the dust.
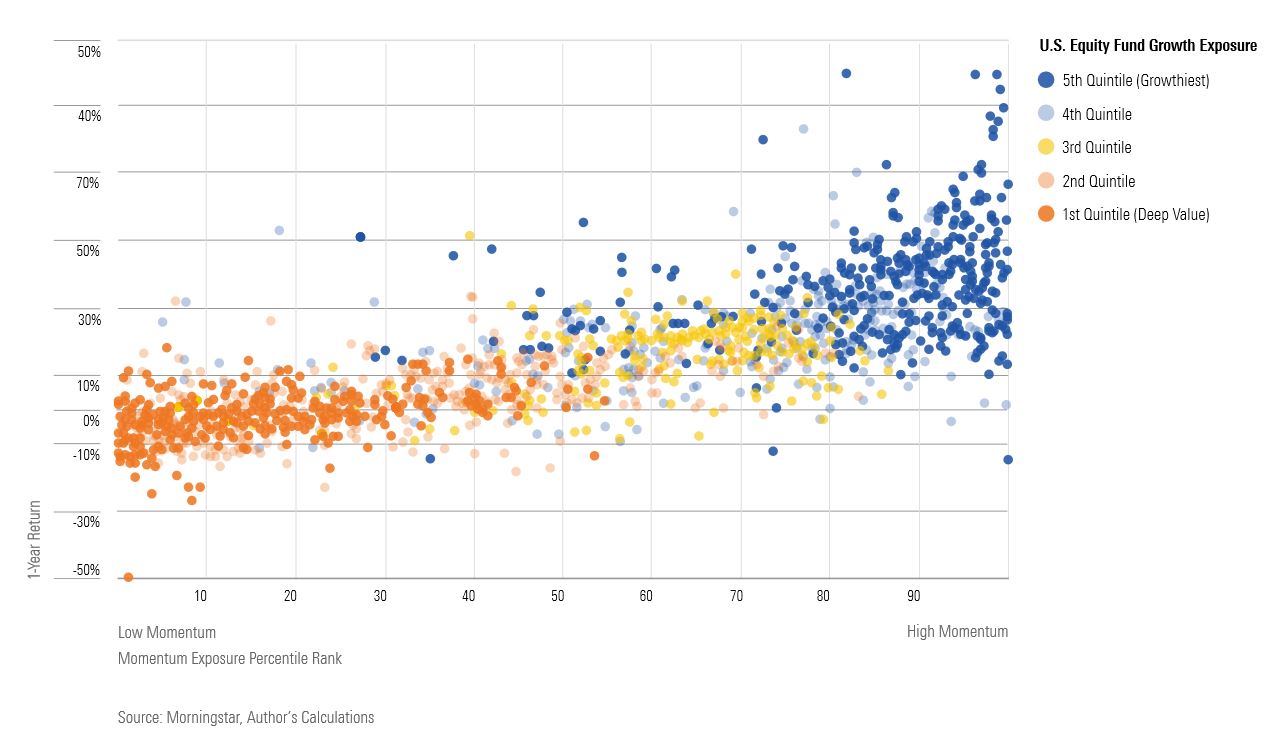
In the following chart for trailing 12-month returns, between the top momentum and growth exposure quintiles, there was a 68% overlap of funds. In other words, if you were holding the growthiest stocks, it was likely you also inherited high momentum exposure. And funds in the top quintile for growth exposure that also had momentum exposure returned an average of 36.1% over the trailing 12-month period, compared with the middle quintile's 12.8%.
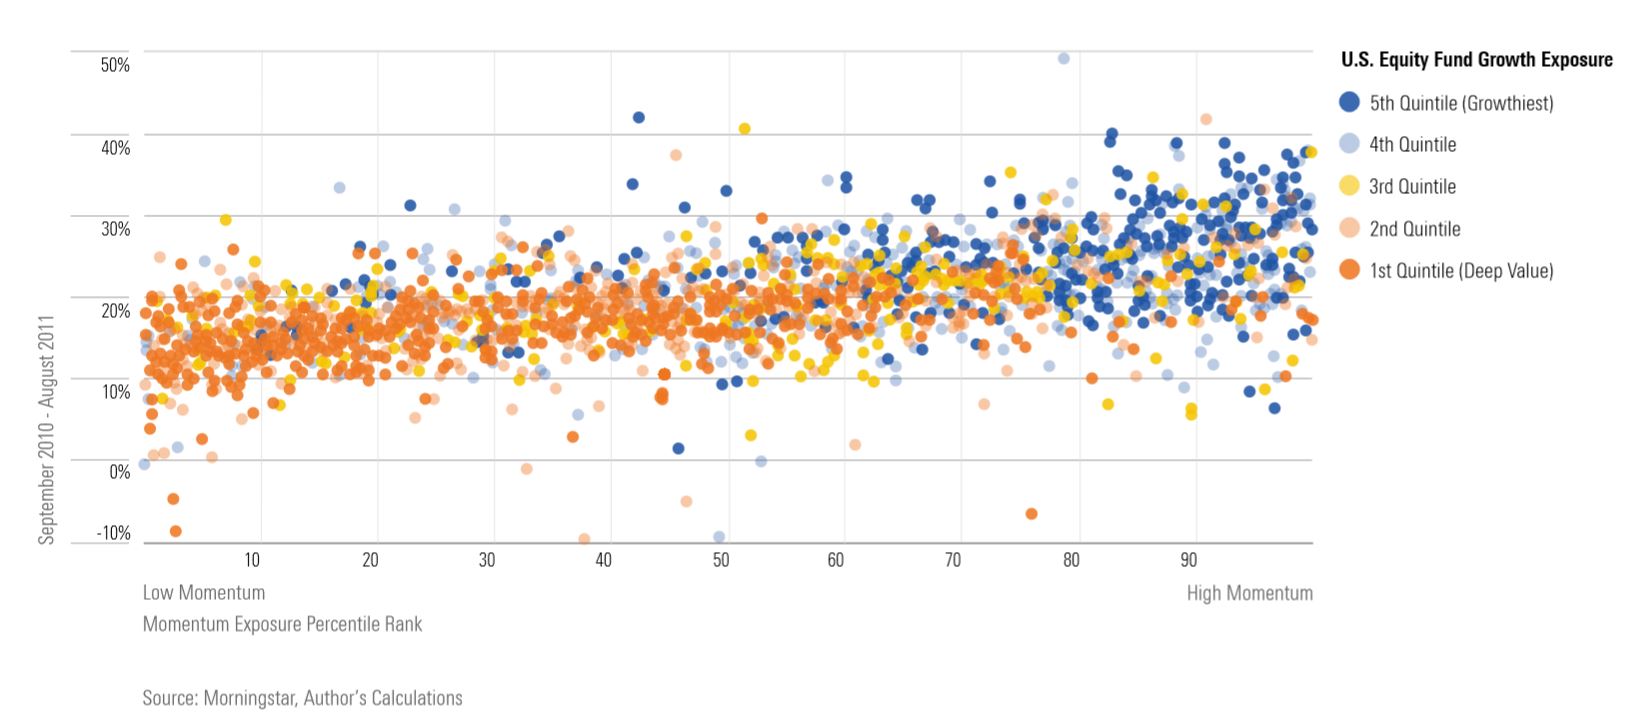
Contrast this landscape with that of 10 years ago. Where there was not much differentiation in returns by momentum exposure, the top quintile returned 24.6% to the middle quintile's 19.1%. And it was not uncommon to see a fund with both momentum and value exposure.
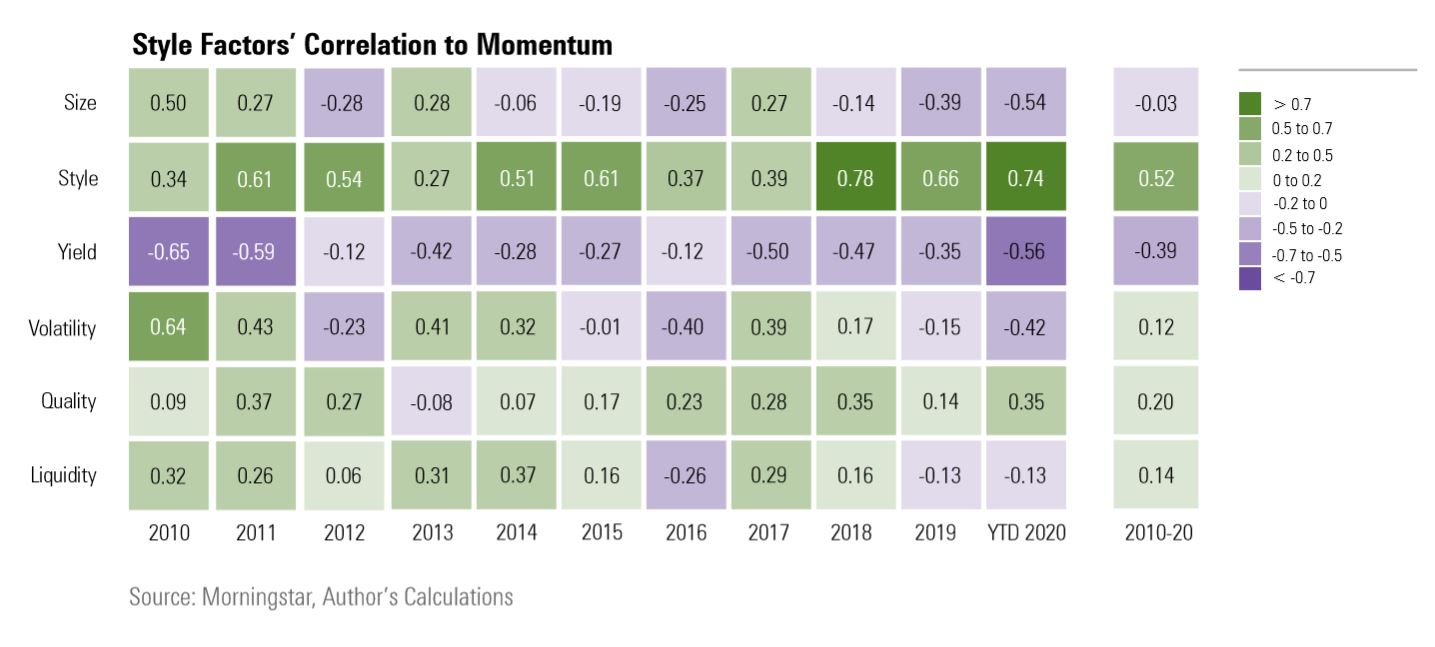
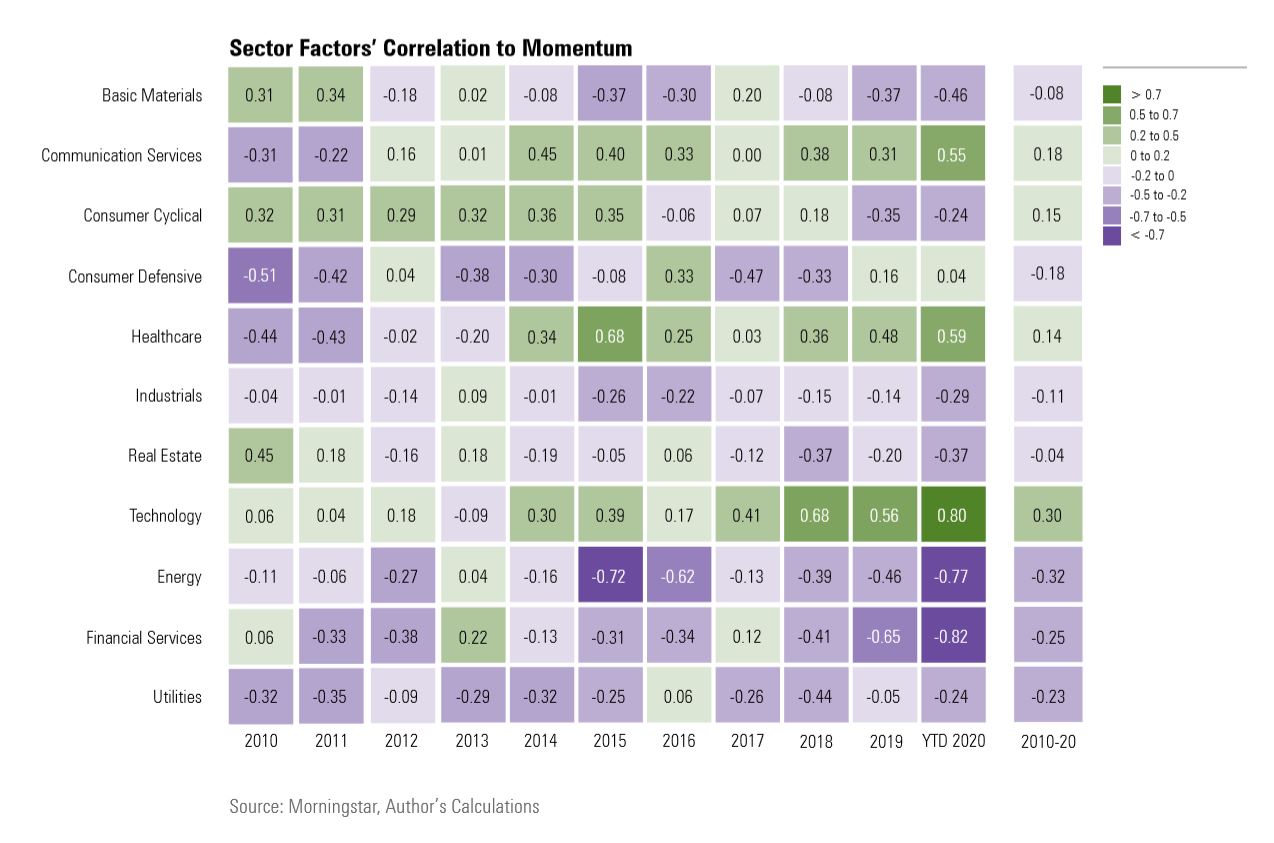
Momentum's Correlations We examined correlations between momentum and all other factors, where value-growth exposure is the highest for any style factor in the past 15 years. Compared with just three or four years ago, there was not much of a connection between momentum and growth exposure, with the correlation of portfolio holdings almost cut in half.
It is a similar story when we look at sectors. The recent levels of correlation between technology stocks and momentum have been at the highest levels for any sector in the past decade and almost triple the factor's three-year average correlation. Looking just four years prior, in 2016, there was essentially no connection between momentum and tech stocks.
Momentum-Driven Winners So, which funds were best able to ride the momentum rally?
Surprisingly, it wasn't dedicated momentum strategies. Instead it was growth funds whose stock-picking led them to a high momentum exposure.
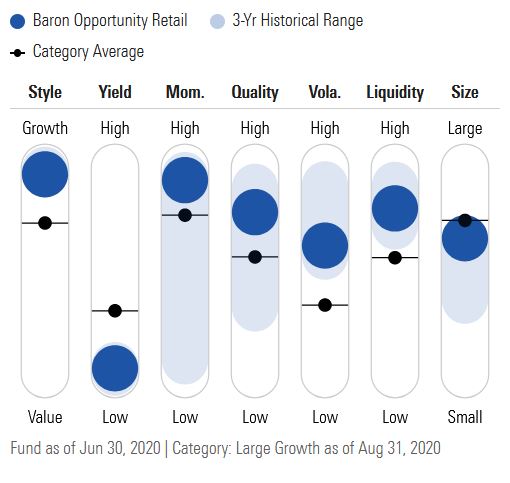
One of the biggest winners was Baron Opportunity BIOPX, which carries a Morningstar Quantitative Rating of Gold. Over the past 10 years, this fund held steady among the top 2% of U.S. equity funds for growth exposure.
At the same time, growth stocks led the fund from the low-momentum bucket into high momentum exposure. In August 2020, the fund was in the 94th percentile among U.S. equity funds for technology exposure, 99th for growth, and 91st for momentum exposure. While in August 2010, was in the 61st percentile for technology exposure, 99th for growth, and 45th for momentum exposure. The fund ranked third among its large-growth category peers for year-to-date performance.
Source: Morningstar.
Baron Opportunity's top holdings are Microsoft, Amazon, Alphabet, and Facebook. Additionally, the fund has benefited from large positions in Tesla TSLA, which has returned 495.6% so far in 2020, and website builder Wix.com WIX, which gained 140.8%.
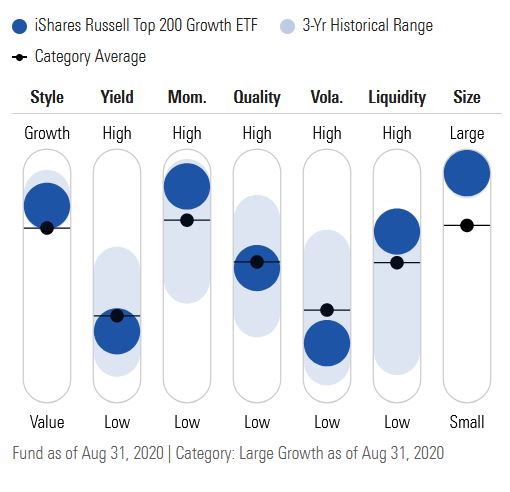
It's a similar story for iShares Russell Top 200 Growth ETF IWY, which jumped to the 87th percentile for momentum exposure among U.S. equity funds from the 15th percentile 10 years earlier. Over the same 10-year period, the fund's growth exposure held steady. The fund holds four out of five FAANG stocks in its top 10, as well as Tesla.
Source: Morningstar.
Meanwhile, funds that have high momentum exposure with low exposure to growth and technology, highlighted in light green below, landed at the bottom of the heap. This signaled the importance of the growth story as much as the momentum one.
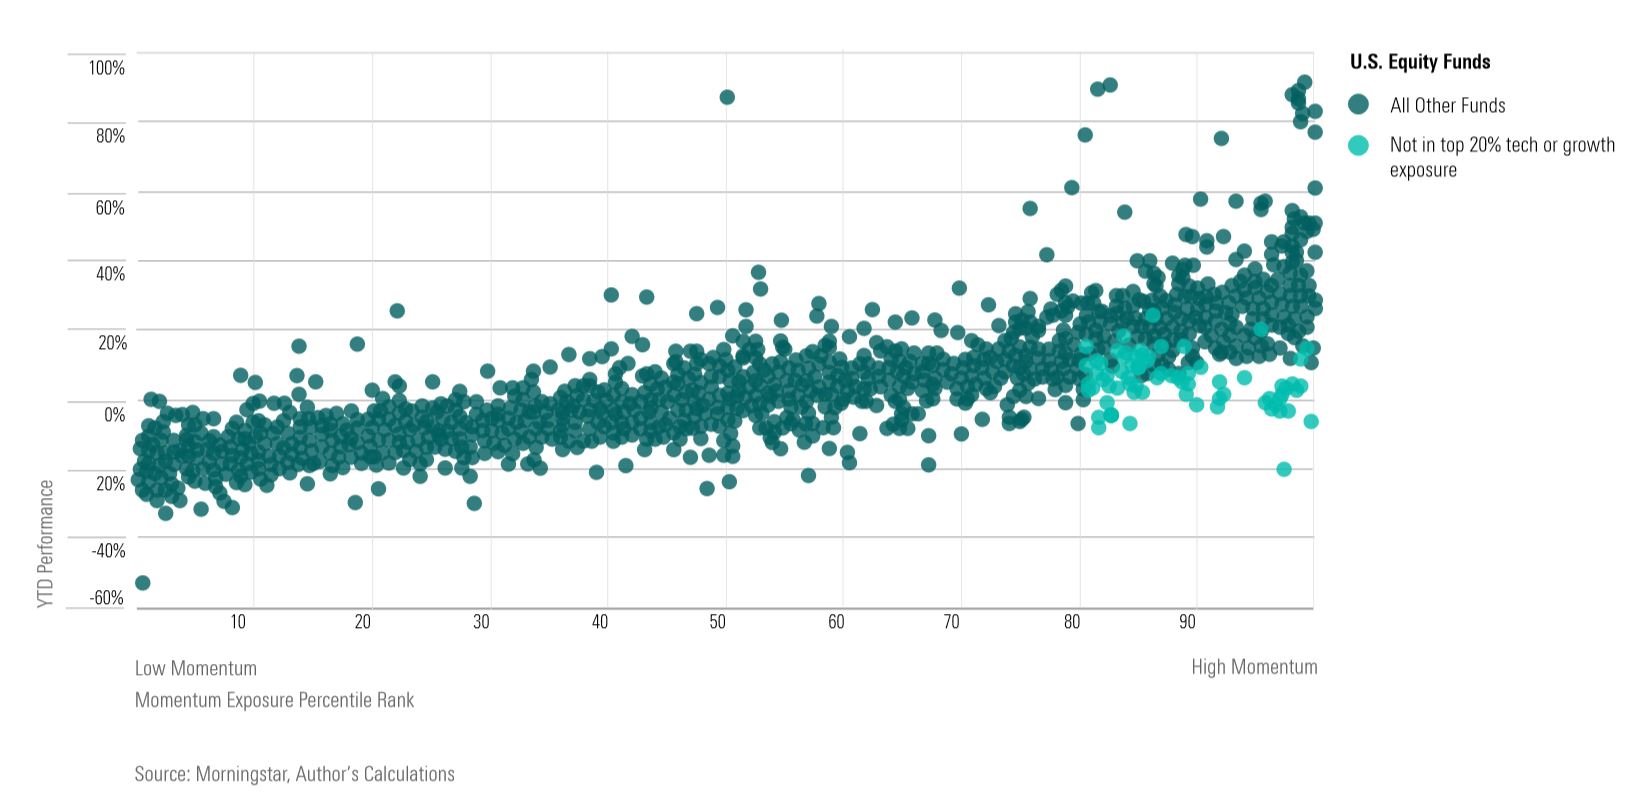
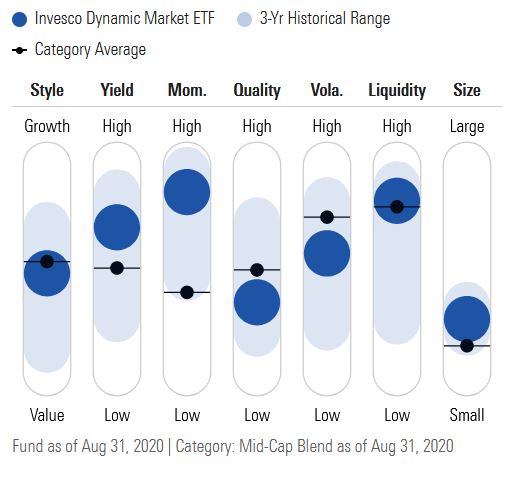
This includes Janus Henderson U.S. Managed Volatility JRSIX, which has a Morningstar Analyst Rating of Bronze, and Invesco Dynamic Market ETF PWC, which has a Neutral quantitative rating. Both are blend strategies. For the first eight months of 2020, these funds returned 7.8% and negative 0.7% respectively, compared with the S&P 500's 9.7%.
Source: Morningstar.
From the end of January to the end of June, PWC dramatically pivoted from top holdings AT&T T and Verizon VZ, which had a dismal first quarter and returned negative 24.4% and negative 11.6%, respectively, to Microsoft and Nvidia NVDA, which had stronger returns at 0.3% and 12.1%, respectively.
/cloudfront-us-east-1.images.arcpublishing.com/morningstar/HDPMMDGUA5CUHI254MRUHYEFWU.png)
/cloudfront-us-east-1.images.arcpublishing.com/morningstar/OMVK3XQEVFDRHGPHSQPIBDENQE.jpg)