
Retirement Income: Assessing the Odds
Graduating from a spreadsheet to simulations.
/s3.amazonaws.com/arc-authors/morningstar/1aafbfcc-e9cb-40cc-afaa-43cada43a932.jpg)
They Dissent This is the third article in a series on retirement income. The first described how rising stock and bond prices have reduced retirees' withdrawal rates, while the second discussed funding after-inflation payments from portfolios that produce pre-inflation returns. Those columns elicited several objections, the main ones being that: 1) required minimum distributions from tax-sheltered retirement plans, such as IRAs or 401(k)s, may exceed my assumed 4% withdrawal rate; and 2) because my calculations came from a spreadsheet, they were too simplistic.
I had not considered the RMD objection, because--as with the original source that inspired my ruminations--my inquiry was theoretical. What are the prospects for those who wish to live for 30 years off their assets, while removing an annual amount that is equal to 4% of their initial portfolio, after that figure is adjusted for inflation? The question was broad, addressing the logic that underlies withdrawal tactics.
The spreadsheet criticism, on the other hand, I expected--although perhaps not so vociferously worded.
"Choosing a calculation that has constant market returns, a constant inflation rate, and a constant withdrawal rate is an exercise in oversimplification to the point of rendering the calculation completely meaningless. I thought that the whole reason for doing financial numerical simulations on this topic (which are widely available) was to avoid the ridiculous assumption of constant anything. Why would you even do this calculation, given that we both know it is wrong wrong wrong (and completely pointless)?"
True enough. Then again, all forecasts of investment results are wrong wrong wrong (although I hope not completely pointless). If portfolios have 40 possible annual payoffs, ranging from negative 15% to positive 25%, each equally likely (altering the odds doesn't change the point), then a simulation will match the actual 30-year outcome once in 10 to the 48th power draws. That, I am informed, is comfortably higher than the number of water molecules on planet Earth.
In addition, when illustrating a principle, it’s usually better to streamline the assumptions so that the connection between the inputs and the outcomes remains clear.
Send in the Clones But I concede the general point. There are times when simulations reveal what a fixed exercise cannot. Today's column is one of those instances. It measures the historical success rate for the investor described above, who holds a portfolio composed of 50% large-company U.S. stocks and 50% long-term government bonds, for 30 years, while withdrawing an inflation-adjusted 4%. How often will the portfolio deplete before the three decades are up? The article then tackles the same question for the upcoming 30 years, adjusting for market conditions.
"Wait a moment," you may reply. "I know the historical answer to that question. Since Roger Ibbotson's Stocks, Bonds, Bills, and Inflation data began in 1926, the 4% withdrawal strategy has never failed. For every 30-year period from 1926 through today, the portfolio would have been able to meet the required withdrawals, while continuing to stay afloat. Not once would it have gone under."
True enough. However, there have been only three independent 30-year periods since 1926, making the sample size for this test regrettably low. However, one can create additional 30-year cases by drawing random samples from history’s cache. Over that 94-year stretch, the 50/50 portfolio averaged an 8.41% annualized total return, with a 10.48% standard deviation. Using that mean and standard deviation, I populated 1,000 simulations of alternate 30-year time periods.
(Although I varied the investment returns, I kept inflation fixed at its historic average of 2.87%. Because inflation is related to investment returns, it would not be correct to treat inflation as a fully independent variable.)
Then and Now Here's the historical result.
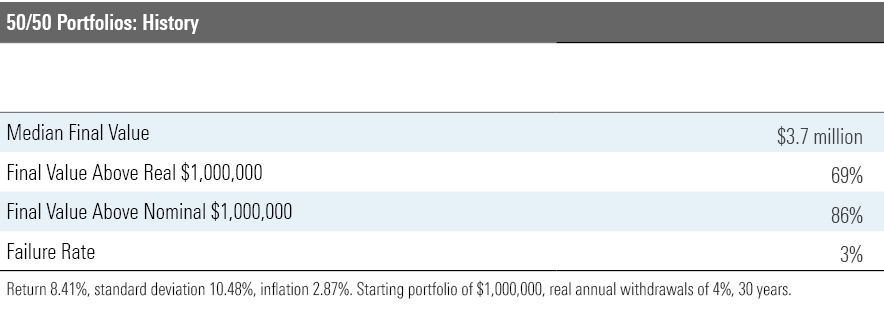
Good news across the board. With a $1,000,000 initial investment, the median portfolio not only was able to fund the required withdrawals, but it also grew handsomely, ending the time period at $3.71 million. Sixty-nine percent of simulations finished the three-decade period worth more than their initial $1,000,000 values, after adjusting for inflation, while 86% exceeded that amount in nominal terms. Only 3% of trials failed to go the distance.
Nonetheless, while small, that failure rate is a reminder that ours is not the worst of all possible worlds. With a different draw from the same deck, the 4% withdrawal policy sometimes cracks. (I am neither the first to run such a test, nor the first to arrive at such a conclusion. In 2012, professor Wade Pfau estimated a 7% failure rate for a 40% stock/60% bond portfolio using historical data. My figure is somewhat more optimistic because it incorporates higher post-2012 returns.)
In 1926, the dividend yield on large stocks was 5.1%. Applying Warren Buffett's formula for calculating long-term equity returns (dividend yield plus inflation plus 3% real growth) gives a 1926 forecast of 10.98%. Their actual 94-year result was 11.22%. Smart fella, that Mr. Buffett. Using that same formula for today's equity market leads to an estimate of 6.51% for future equity returns. For bonds, I will generously forecast a return of 3%, about double the going rate for 30-year Treasuries. But investors need not own only Treasuries, and yields may rise.
That combination of 6.5% stock returns and 3% bond returns leads to a 4.75% expected return for the 50/50 portfolio. Simulating that forecast, accompanied by a slightly reduced standard deviation of 9.5% (based on the assumption that lower inflation will somewhat tame investment returns) and an implied long-term inflation rate of 1.76%, leads to the following totals.
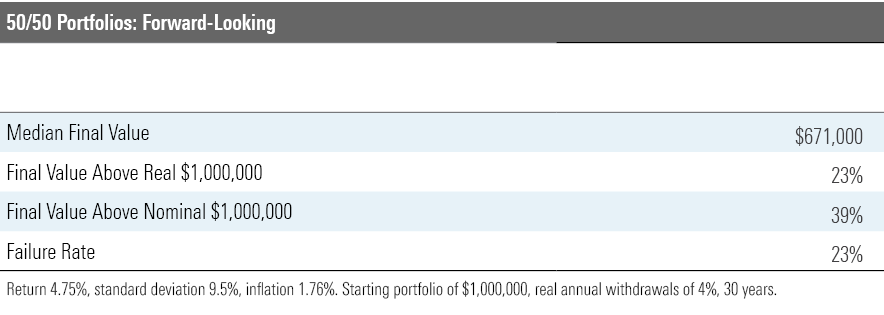
This table is not quite so pleasant. The median portfolio now completes its tenure well below its starting value, whether that figure is computed in real or nominal terms. That is an acceptable outcome, except for those seeking to leave estates, because the portfolio’s primary goal is to churn out 30 years’ worth of income, not to appreciate. Of far greater concern, though, is the fact that 23% of the simulations fail. The 4% real withdrawal strategy was never quite as certain to win as history suggested, but the odds were strongly in its favor. However, if Buffett’s equity formula is close to being correct, those odds are now in doubt.
John Rekenthaler (john.rekenthaler@morningstar.com) has been researching the fund industry since 1988. He is now a columnist for Morningstar.com and a member of Morningstar's investment research department. John is quick to point out that while Morningstar typically agrees with the views of the Rekenthaler Report, his views are his own.
The opinions expressed here are the author’s. Morningstar values diversity of thought and publishes a broad range of viewpoints.
/d10o6nnig0wrdw.cloudfront.net/04-25-2024/t_d30270f760794625a1e74b94c0d352af_name_file_960x540_1600_v4_.jpg)
/cloudfront-us-east-1.images.arcpublishing.com/morningstar/DOXM5RLEKJHX5B6OIEWSUMX6X4.png)
/cloudfront-us-east-1.images.arcpublishing.com/morningstar/ZKOY2ZAHLJVJJMCLXHIVFME56M.jpg)
:quality(80)/s3.amazonaws.com/arc-authors/morningstar/1aafbfcc-e9cb-40cc-afaa-43cada43a932.jpg)