
The Retirement Income Puzzle
When outperforming your portfolio's withdrawal rate isn't enough.
/s3.amazonaws.com/arc-authors/morningstar/1aafbfcc-e9cb-40cc-afaa-43cada43a932.jpg)
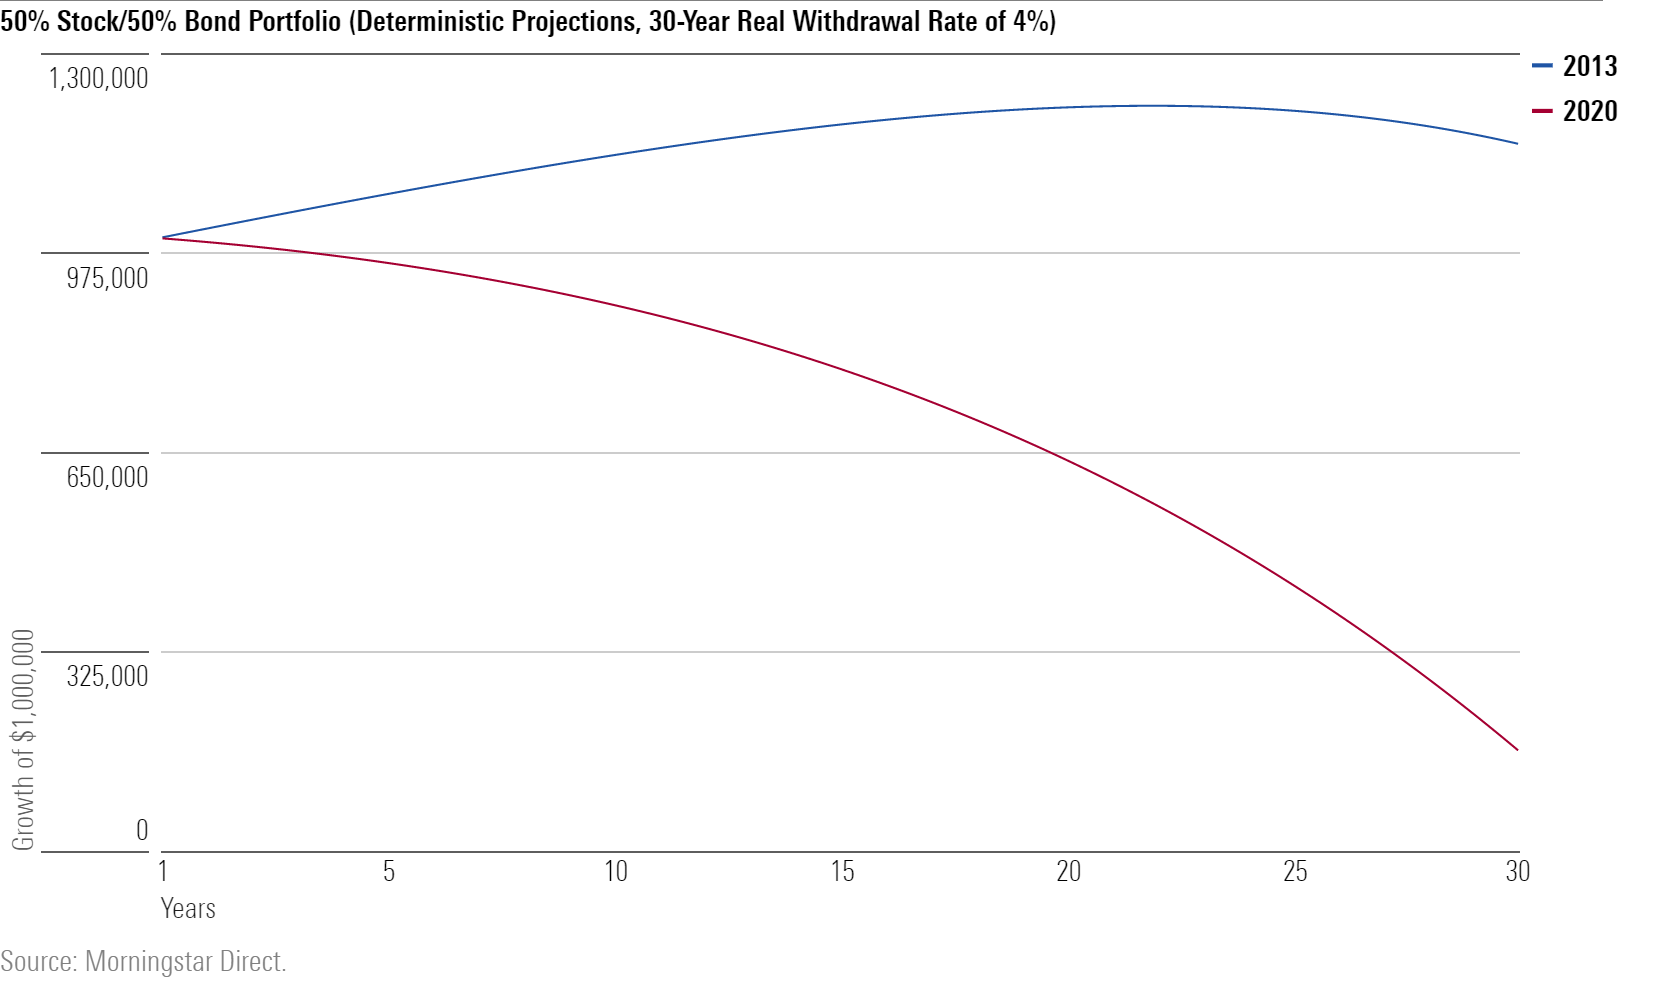
What Goes Up ... Last Friday's column addressed changing market conditions. Because bond yields have indisputably fallen, and expected stock returns disputably so, the percentage of assets that retirees can safely withdraw from their portfolios has gradually declined. The article compared 2013's circumstances with today's, illustrating how traditional withdrawal rates have been endangered by higher asset prices.
Along the way, the article inadvertently surfaced a curiosity. In one of the spreadsheet exercises, the sample portfolio increased in worth during the first 20 years of retirement, as its internal growth outweighed the amount of its withdrawals. After two decades, though, the portfolio began to erode, sending it into a long descent that would ultimately deplete its assets.
My brief explanation as to why a portfolio could at first increase in value and then decline, even as its returns and real withdrawal rate remained fixed, proved to be insufficient. I received several inquiries from readers along the following lines:
Your answer to Pop Quiz 2 does not make sense to me. Were you doing a simulation or a calculation? If you are doing a calculation, then the growth rate [of the portfolio] is 5.4% minus 4%, a net of 1.4%. There is no way that the holding value will ever decline.
The reader’s statement was correct: The graph came from a calculation rather than a simulation. It posited that the portfolio appreciated by 5.4% every year, accompanied by annual withdrawals of 4%. The withdrawal rate was real, meaning that each year’s amount increased with inflation. However, because the portfolio’s value also grew over time, it seemed that the portfolio would always stay ahead of the withdrawals. After all, 5.4% is larger than 4%.
The 4.1% Example There's more to the outcome than that. Let's examine the most instructive case, which occurs when the portfolio's return is barely above the stipulated withdrawal rate. The table below illustrates the first five years' results when the portfolio appreciates by an annual 4.1%, the real withdrawal rate is 4%, and the inflation rate is 2%.
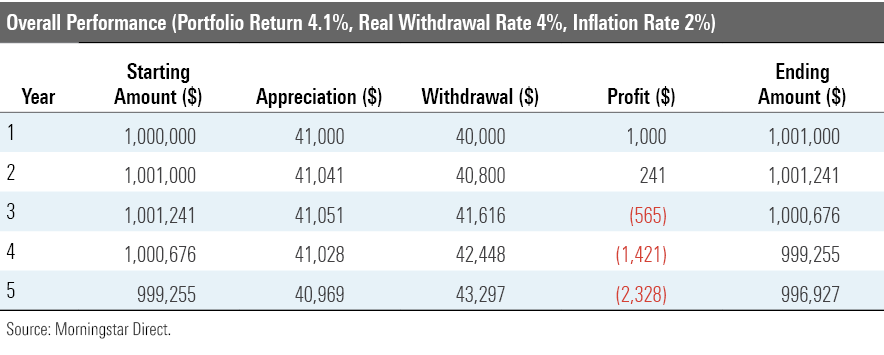
In year 1, the portfolio earns $41,000 on a $1,000,000 initial base and distributes $40,000, thereby gaining $1,000. At year-end, it is worth $1,001,000, which exceeds where it started. So far, so good. Year 2 is also positive, yielding a $241 profit. Once again, the portfolio increases in value. Concerningly, though, its profit trails the previous year’s. The trend does not appear to be the portfolio’s friend.
Sure enough, it is not. The portfolio loses money in year 3. It remains above its $1,000,000 starting point, but it doesn’t seem the portfolio will stay there for long, because it dropped $565 for the 12 months, leaving it only $676 above where it began. Next year confirms the bad news. The loss escalates, knocking the portfolio below its beginning value. There is nothing to indicate that it can reverse the process--and indeed, it does not. The portfolio hits zero during year 38.
The reason for the portfolio’s reversal of fortune appears below, in the analysis of its marginal performance.
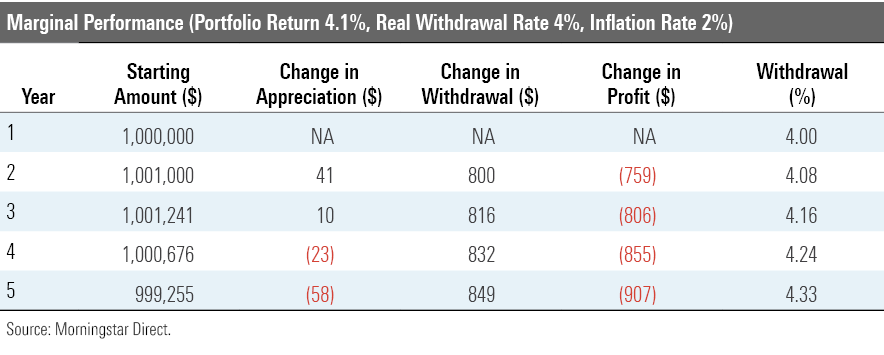
The change in appreciation during year 2 is modest. Because the portfolio increased in value only by a net $1,000, its appreciation was just $41 greater in year 2 than in year 1. That is, while the portfolio’s asset base was larger than before, it was only barely larger, and therefore not enough to cover the change in the required withdrawal amount, which was $800 higher (the 2% inflation rate multiplied by the previous year’s $40,000 distribution). In short, although the portfolio’s return outstripped the inflation rate, the latter had greater effect, because the base on which it operated was much larger.
Following the Math The canary in the coal mine, so to speak, is the portfolio-withdrawal percentage, shown at the table's far right. When that figure increases, the portfolio is doomed, because once the withdrawal percentage crosses the 4% mark, it will not stop climbing, meaning that the portfolio cannot escape eventual bankruptcy. The cycle may take a very long time to play out, but it is unavoidable.
For example, with initial case of a 5.4% portfolio return, a 4% real withdrawal rate, and a 2% inflation rate, the portfolio survives for 58 years--long enough to fund any retirement. At 5.9%, the portfolio lasts an even more formidable 98 years, reaching a peak value in year 70 of almost $2.7 million. However, even that figure is inadequate. The annual withdrawal requirement balloons to $156,845, which consumes 5.8% of that seemingly steep asset base. "The centre cannot hold."
The break-even point for portfolios with real withdrawals is the sum of 1) the withdrawal rate and 2) the inflation rate. In this portfolio’s case, that means 6%. That conclusion seems trite. But it did not strike me as obvious when I first approached the topic. The rising portfolio values create a mental illusion, suggesting that all investments that appreciate above the withdrawal rate will succeed indefinitely. All will not, although frequently the shortfalls may occur so far in the future as to be acceptable.
This column’s analysis, to be sure, is artificially certain. When I plugged in a 5.9% return, the portfolio eventually went under. In contrast, raising that figure by a mere 20 basis points to 6.1% made the portfolio invincible. In year 98, when the 5.9% case expired, the 6.1% portfolio would be worth a cool $14.8 million (albeit in 2120 dollars, which at a 2% inflation rate would equal just under $2 million of our dollars) and would boast an eminently sustainable withdrawal rate of 1.9%. In real life, such modest adjustments do not lead to such major guarantees.
The Primary Source As I was wrapping up this article, a reader forwarded a long interview that financial planner Michael Kitces recently conducted with Bill Bengen, who in 1994 wrote the widely cited article that popularized the idea of a 4% real withdrawal rate. It's a good read; Bengen has been around the block long enough to know when the numbers can serve as guides and when they should only be guidelines.
John Rekenthaler (john.rekenthaler@morningstar.com) has been researching the fund industry since 1988. He is now a columnist for Morningstar.com and a member of Morningstar's investment research department. John is quick to point out that while Morningstar typically agrees with the views of the Rekenthaler Report, his views are his own.
The opinions expressed here are the author’s. Morningstar values diversity of thought and publishes a broad range of viewpoints.
/cloudfront-us-east-1.images.arcpublishing.com/morningstar/DOXM5RLEKJHX5B6OIEWSUMX6X4.png)
/cloudfront-us-east-1.images.arcpublishing.com/morningstar/ZKOY2ZAHLJVJJMCLXHIVFME56M.jpg)
/cloudfront-us-east-1.images.arcpublishing.com/morningstar/IGTBIPRO7NEEVJCDNBPNUYEKEY.png)
:quality(80)/s3.amazonaws.com/arc-authors/morningstar/1aafbfcc-e9cb-40cc-afaa-43cada43a932.jpg)