
How Have U.S. Household Incomes Fared?
Judging by the cold data, as opposed to hot air.
/s3.amazonaws.com/arc-authors/morningstar/1aafbfcc-e9cb-40cc-afaa-43cada43a932.jpg)
By the Numbers This being the political season, allegations abound about the status of American households. Democrats decry income inequality, while Republicans praise the nation's economic growth, which, they assert, owes largely to their policies. Meanwhile, those outside the two major parties see problems everywhere.
This column tests those competing claims with data courtesy of two Congressional Budget Office reports: 1) Income and Poverty in the United States: 2019, and 2) The Distribution of Household Income, 2017. (Curiously, the former was published before the latter, which was released this month. Sometimes, the wheels of government turn slowly.) The charts that follow begin in 1980.
Median Results The first illustrates the change in median household income, as measured before the effects of taxes and/or government transfer payments. The amounts are given in 2019 dollars, and the graph's scale, as with each of its successors, is logarithmic. (Using the log scale makes all equally sized percentage changes of equal size on the chart. That property does not hold for conventionally scaled graphs.)
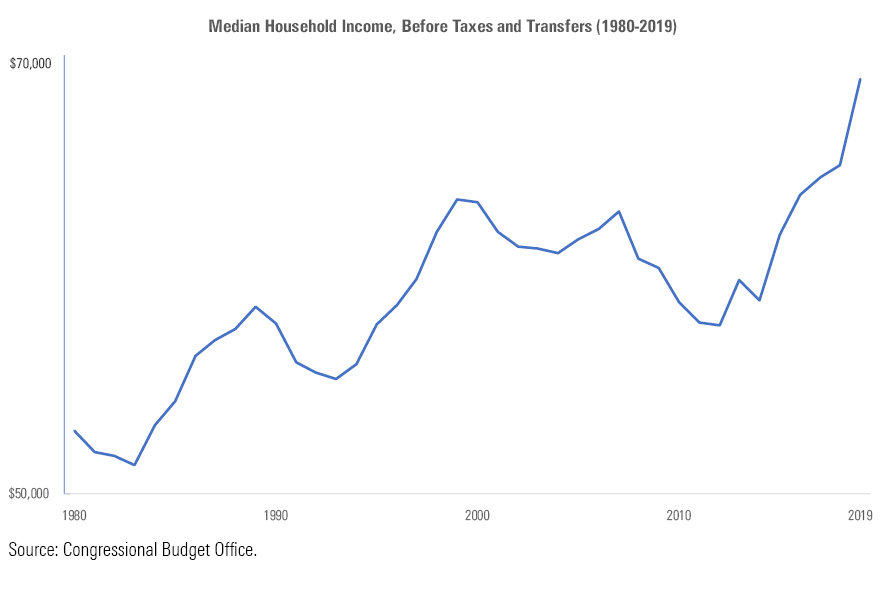
Two steps forward, one step back. On average, the median household income grew at less than 1% per year, expressed in real terms. That achievement is unimpressive given that real gross domestic product almost tripled during those four decades, and the stock market was stronger yet. Still, the trend was upward. The median American household is better off today than in 1980, or for that matter in 2000.
(When adjusted for household size, income growth was somewhat healthier than the raw numbers indicate, as the average household declined from 2.76 members in 1980 to 2.52 members by 2019. However, even making that adjustment doesn't push the annualized household-income growth rate above 1%.)
The weakest period for household income came directly after the new millennium, with median income immediately falling on account of the early-2000s recession, then sliding further after 2008, and finally bottoming in 2012. As the 12 fallow years took place under both Republican and Democratic presidencies, with the subsequent recovery occurring under Democratic and Republican administrations, the evidence would seem to refute those who think that a president’s party is important for the overall economy. But no doubt those who possess such beliefs will continue to do so.
Pretax Quintiles The median overlooks those who fall above or below the norm. Happily, the Congressional Budget Office provides an additional perspective by separating households into income quintiles. It then tracks the results for each quintile, to see how wealth has affected the outcomes--which it very much has. The rich have indeed become richer. The chart below depicts the percentage growth of change in income--again, before the effects of taxes and/or government transfers--for 1) the highest-earning quintile of households, 2) the lowest-earning quintile, and 3) the three middle quintiles. (The starting point for this graph, as well as the one that follows, is set at 100.)
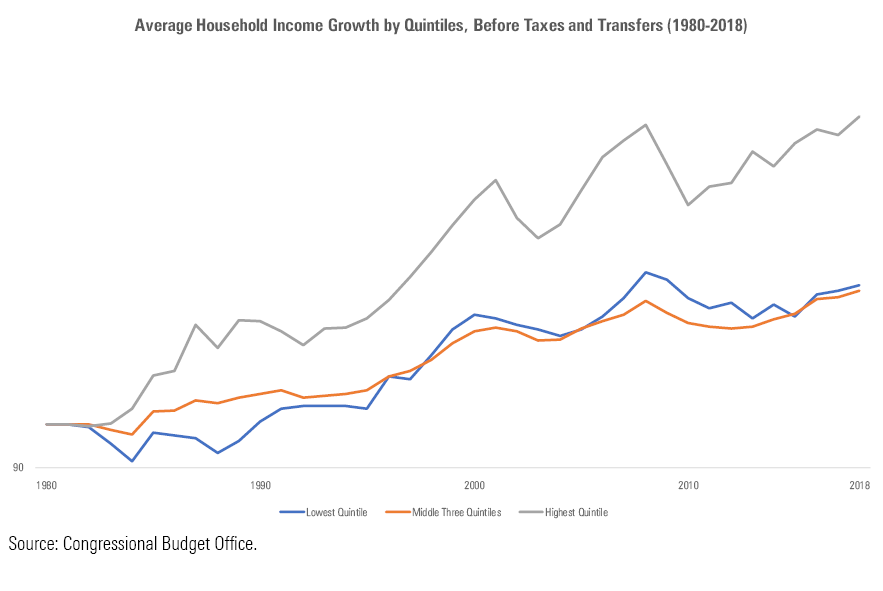
Effectively, there were two groups: the haves and the not-haves. The top quintile of household income progressed markedly faster than did the four others. It enjoyed 113% cumulative growth over the four-decade stretch, while the rest gained about 40%. (This 40% figure is somewhat higher than the cumulative growth for the median household, owing to slight differences in methodology between the two computations.)
The pattern continues within the top quintile. The top 0.01% of households grew their income by 515%, the top 0.1% by 335%, and the top 1% by 171%. (These figures are not shown on the graph, so please don’t squint trying to find them.) The final 19% of the top quintile increased its household income by a cumulative 80%, doubling what households in the lower four quintiles accomplished, but also well below the overall average for the top quintile. That statistic is inflated by the very great achievements of the very few.
Post-Tax Quintiles These results owe to the marketplace, which is implicitly influenced by federal government policies, but not explicitly so. The final chart addresses that omission by including the government's decisions, portraying the changes of household incomes after taxes and transfer payments.
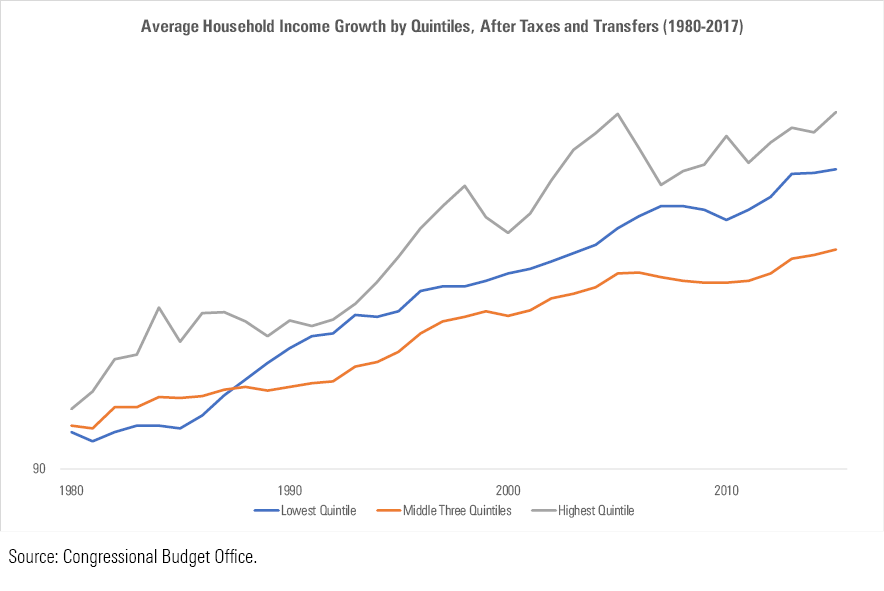
This picture tells a somewhat different story. The top quintile lands near its previous position, because those households aren’t greatly affected by transfer payments and because, despite noisy political battles, their tax bills haven’t much changed. The top quintile of households paid an average federal tax rate of 25.1% in 1980 and pay 23.7% today.
That decline in average tax rates is smaller than that enjoyed by the three middle quintiles, which fell to 14.9% from 19.3%. In addition, the middle quintiles have received somewhat higher transfer payments. Consequently, after taxes and transfer payments are considered, the middle three quintiles performed slightly better than they did with the pretax assessment, although their income growth remained much less.
Best served by the changes in tax and transfer-payment policies was the lowest quintile of household incomes, which benefited both from large increases in tax credits, such as the earned-income and child credits, and from the expansion of transfer payments. Such programs enabled the lowest quintile to grow their effective household incomes more rapidly than the middle quintiles, although of course these results were relative. In absolute terms, they remained poorer.
In summary:
- Household incomes have increased each decade, save for the 2010s.
- The wealthiest households have outgained the rest, both before and after the direct effects of federal-government policies.
- The remaining four quintiles performed similarly before taxes and transfer payments, but the lowest quintile moved ahead of the middle quintiles after considering those effects.
Given these results, it's not surprising that complaints abound that the middle class has been left behind. This belief is not absolutely correct, but it is relatively accurate--and happiness, after all, consists not in possessing the most money, but instead in having more than one's neighbor.
John Rekenthaler (john.rekenthaler@morningstar.com) has been researching the fund industry since 1988. He is now a columnist for Morningstar.com and a member of Morningstar's investment research department. John is quick to point out that while Morningstar typically agrees with the views of the Rekenthaler Report, his views are his own.
The opinions expressed here are the author’s. Morningstar values diversity of thought and publishes a broad range of viewpoints.
/cloudfront-us-east-1.images.arcpublishing.com/morningstar/ZKOY2ZAHLJVJJMCLXHIVFME56M.jpg)
/cloudfront-us-east-1.images.arcpublishing.com/morningstar/IGTBIPRO7NEEVJCDNBPNUYEKEY.png)
/cloudfront-us-east-1.images.arcpublishing.com/morningstar/HDPMMDGUA5CUHI254MRUHYEFWU.png)
:quality(80)/s3.amazonaws.com/arc-authors/morningstar/1aafbfcc-e9cb-40cc-afaa-43cada43a932.jpg)