
The Math for Retirement Income Keeps Getting Worse
Revisiting the 4% withdrawal rule.
/s3.amazonaws.com/arc-authors/morningstar/1aafbfcc-e9cb-40cc-afaa-43cada43a932.jpg)
The Catch The good news for upcoming retirees is that their investments have soared. Large-company stocks have recorded highs, smaller-company and international stocks are approaching their previous peaks, and bonds have never been costlier. It has been a great time to own financial assets. The bad news is that as these investments become pricier, their yields have shrunk, which reduces the percentage of their value that retirees can withdraw during retirement.
This, of course, is not a new phenomenon, as--despite March's violent but brief interruption--the Great Bull Market is in its 13th year. (Coincidentally, at almost the very hour that this column was posted, Rafael Nadal occupied the red clay of Paris, competing in the semifinals for his 13th French Open title.) Indeed, on July 31, 2013, in response to articles from both The New York Times and The Wall Street Journal, I published a column on this very topic, entitled "Is 3% the New 4%?"
That headline referenced the long-standing rule of thumb that retirees can safely spend an annual 4% of their portfolios, adjusting their withdrawals for inflation. The 4% figure was popularized in 1994 by financial planner William Bengen in "Determining Withdrawal Rates Using Historical Data." When back-testing, Bengen found that portfolios that consisted 50% of stocks and 50% of bonds always survived at least 30 years at a 4% withdrawal rate but sometimes went bust when the rate was increased to 5%.
My 2013 article--which you can comfortably skip, since this paragraph summarizes it--argued that although asset prices had risen, the 4% guideline remained valid. Bengen offered highly conservative counsel that was intended to succeed under every reasonable possibility and which required no flexibility from investors. In reality, retirees can begin their withdrawals more aggressively, with the possibility of scaling back should the financial markets perform poorly during the early days of their retirement (which is the period that matters most).
Changing Times I am no longer so confident. Since 2013, investment conditions have changed dramatically. When my previous column was published, the 30-year Treasury yield was 3.61% and expected inflation was 2.32%. Investors therefore received a real expected payout of 1.29%. Today those figures are 1.42% and 1.76%, respectively, which implies a negative expected real return for 30-year Treasuries. It's difficult to finance withdrawals from portfolios that are losing money!
Stock valuations have also become less attractive. In July 2013, as computed by Morningstar (the figures vary according to the data provider), the S&P 500's trailing 12-month price/earnings ratio was 17 and its price/book ratio was 2.4. Today, those amounts are 27 and 3.7, meaning that equity valuations have ballooned by 50% over the past seven years. All things being equal, those gains reduce the stock market's future expectations.
Testing Bonds Let's see how those differences might apply in practice. First, let's consider the simplest tactic for a 30-year portfolio: placing one's entire portfolio into similarly dated Treasury bonds. Using the prevailing 30-year Treasury yields for July 2013 and October 2020 to estimate income for portfolios that were formed on each of those dates, and the previously mentioned expected inflation rates to generate future withdrawals, we can track the progression of a $1 million investment.
(Note: All numbers are nominal. The 4% annual withdrawal mandate is real, such that the first year's $40,000 withdrawal grows with inflation, but when generating the calculations I expressed those withdrawals in nominal terms.)
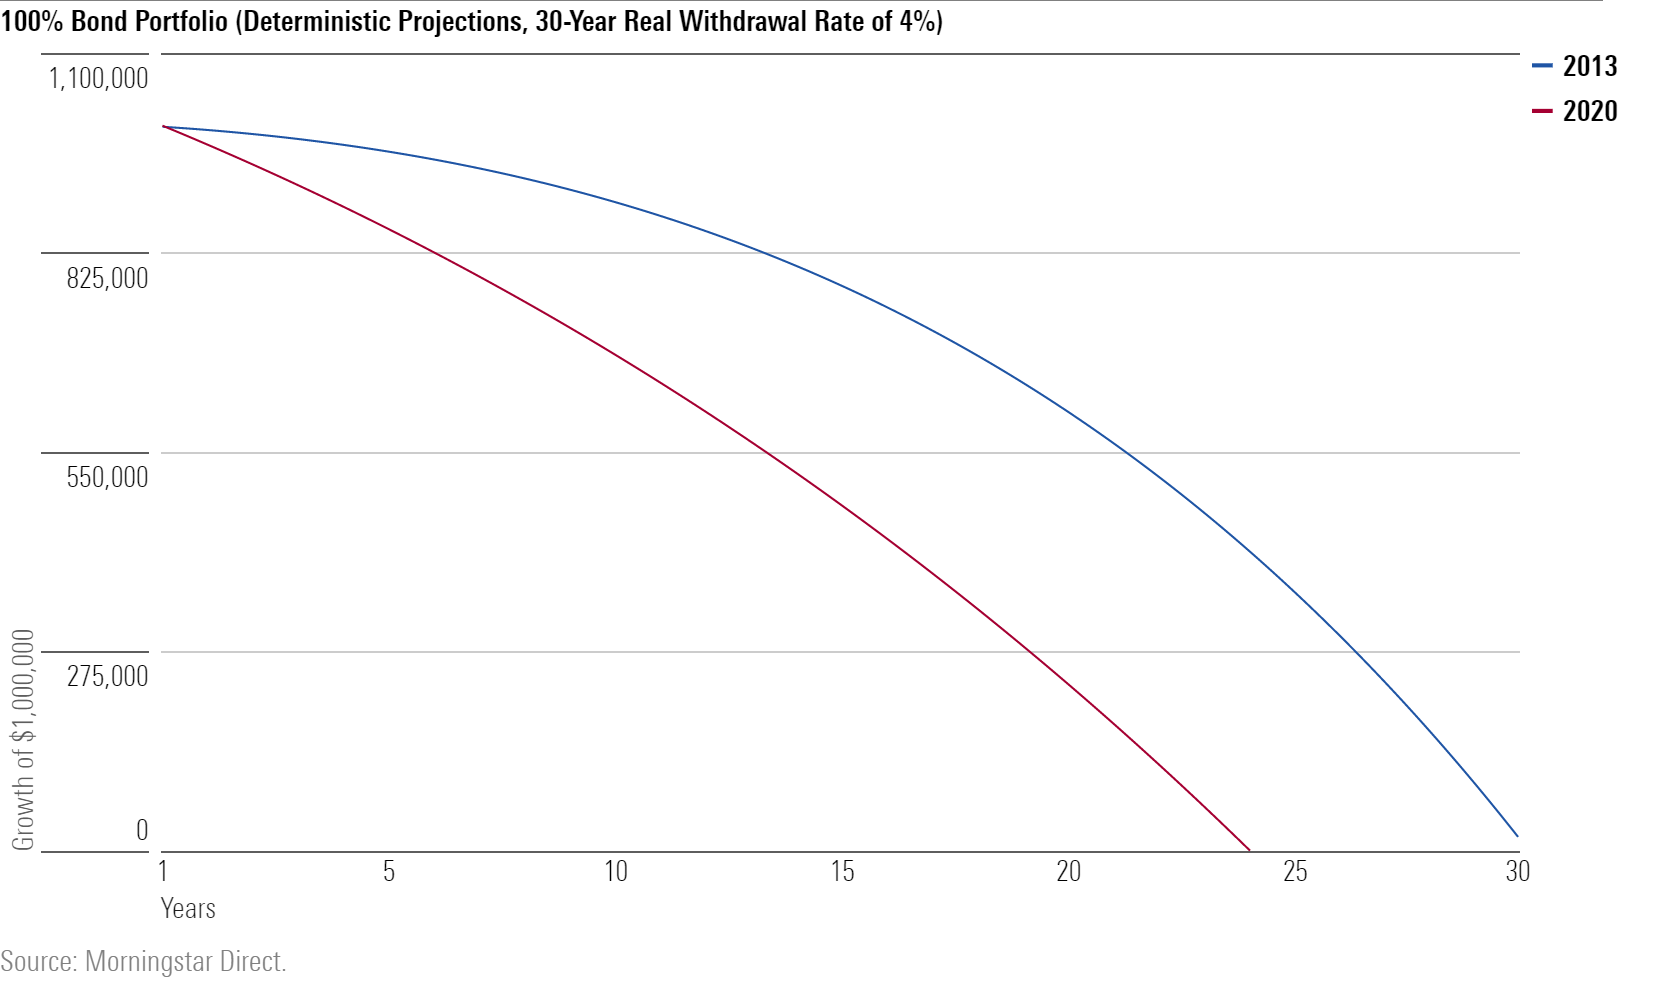
Pop Quiz No. 1: Why are the lines convex? Answer: Because when portfolio withdrawals exceed receipts, the process works like a mortgage paydown, but in reverse. The first few years don't make much of a dent in the principal, but as principal declines, the withdrawals consume an ever-larger slice of the portfolio. The cycle becomes vicious--particularly as unlike with a fixed-rate mortgage, the retiree withdrawals gradually increase.
The results aren't pretty. The 2013 portfolio reaches the finish line, but just barely. Should the withdrawals continue, the 2013 portfolio would last but another three months. That’s a better outcome, however, than with the 2020 portfolio, which expired on Year 24. To be sure, diversifying into higher-yield bonds, or into bond alternatives as mentioned in last week's column, would improve the projection. But retirees should not dine on bonds alone. A happier choice would be Bengen's 50% stock/50% bond portfolio.
Half and Half You ask, I provide. The chart below depicts the behavior of two portfolios, once again beginning in July 2013 and October 2020, but this time consisting half of S&P 500 stocks and half of 30-year Treasuries. The bond-income and withdrawal calculations are as before. With equities, I applied Warren Buffett's formula for forecasting long-term stock returns: 3% GDP growth + the stock-dividend yield + expected inflation. That gave a return of 7.2% for stocks in July 2013, as opposed to 6.5% today. I then shaved the October 2020 projection by one percentage point, to 5.5%, on the assumption over the next 30 years the S&P 500's price/earnings ratio will decline to 20, which is closer to its historic norm.
(This exercise is unrealistic in that it uses fixed investment returns, rather than simulating fluctuating market results, However, it suffices for observing changes between the two time periods. Switching simulations would add complexity, but it wouldn't change the essential conclusion.)
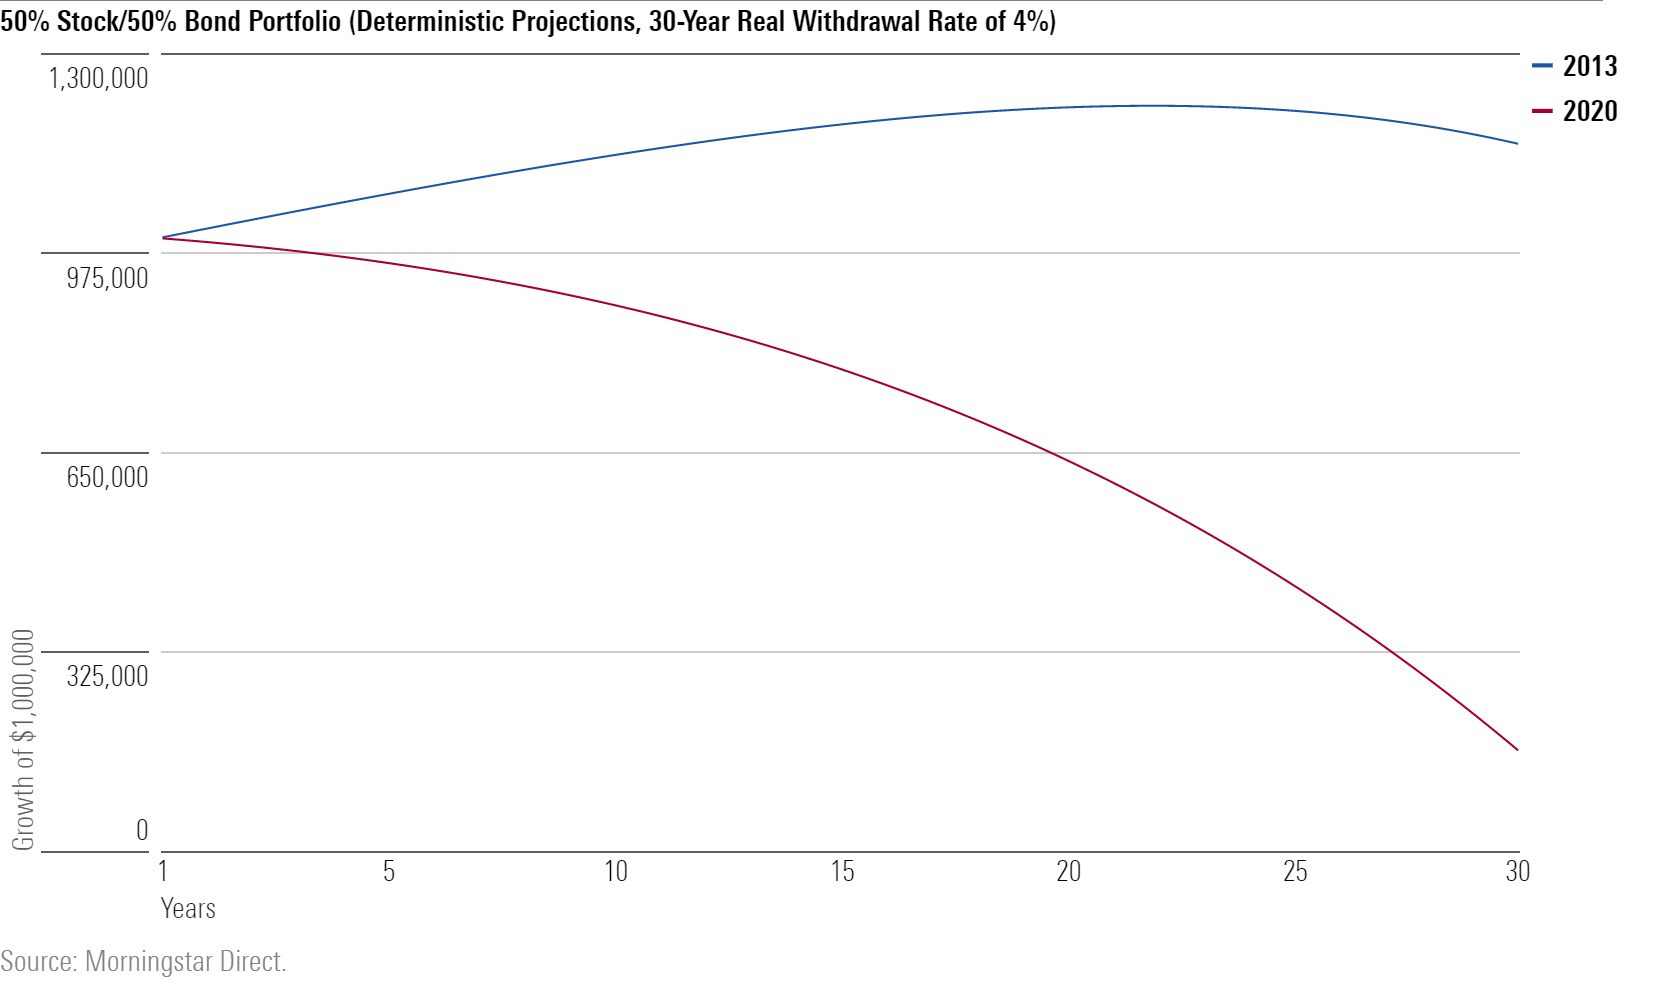
Pop Quiz No. 2: Why does the 2013 line initially rise, then fall? Answer: That is a good question; I had to think about the answer for a bit. The forecast return for the portfolio is (0.5 x 3.6%) + (0.5 x 7.2%), which equals 5.4%--a full percentage point above the withdrawal rate. It seems that the portfolio should continue to increase in value, with 5.4% coming in each year and 4% exiting. However, that withdrawal is real, while the portfolio's receipts are nominal. Eventually, the withdrawal amount exceeds the portfolio's gains, and the vicious cycle begins to commence.
The 2013 portfolio of 50% stocks/50% bonds comfortably passes Bengen's 30-year test. By the end of the time period, the portfolio's value is slowly declining, but its value remains far above its starting point. Extending the spreadsheet demonstrates that the 2013 portfolio will exist for another 19 years. Meanwhile, the 2020 portfolio struggles. It reaches the finish line, but with little room to spare. Any retiree placed in that position would be nervous indeed.
Wrapping Up As I hope you have gathered, these exercises aren't remotely realistic. They involve assumptions that will certainly prove to be false, perhaps grossly so. However, they do indicate what has changed since I first addressed this subject in July 2013. Then, I wrote, "Even if the acceptable rate per [Bengen's] approach has subsided to something close to 3%, it doesn't follow that a retiree must accept such a low figure." I am considerably less certain of that counsel today.
John Rekenthaler (john.rekenthaler@morningstar.com) has been researching the fund industry since 1988. He is now a columnist for Morningstar.com and a member of Morningstar's investment research department. John is quick to point out that while Morningstar typically agrees with the views of the Rekenthaler Report, his views are his own.
The opinions expressed here are the author’s. Morningstar values diversity of thought and publishes a broad range of viewpoints.
/cloudfront-us-east-1.images.arcpublishing.com/morningstar/OMVK3XQEVFDRHGPHSQPIBDENQE.jpg)
:quality(80)/s3.amazonaws.com/arc-authors/morningstar/1aafbfcc-e9cb-40cc-afaa-43cada43a932.jpg)