
Vanguard Continued to Dominate the ETF Flows Rankings in September
Vanguard is well ahead of the pack, and bond ETF flows are on their way to a record year.
/s3.amazonaws.com/arc-authors/morningstar/a90ba90e-1da2-48a4-98bf-a476620dbff0.jpg)
In September, global stocks retreated from the record levels they reached in August. The Morningstar Global Markets Index--a broad gauge of global stock markets--fell 3.1% during the month. Meanwhile, the Morningstar US Core Bond Index--a barometer of U.S. fixed-income markets--ticked down 0.04%, as long-term Treasury yields shaded higher. It’s not often that both benchmarks finish the month in the red. Over the past 20 years, these two indexes have both posted negative monthly returns just 12% of the time.
Here, I will take a closer look at how the major asset classes performed last month, where investors were putting their money, and which segments of the market look cheap and dear--all through the lens of exchange-traded funds.
September's Pullback Brought U.S. Stocks Back Toward Fair Value Exhibit 1 features September performance figures for a sampling of Morningstar Medalist exchange-traded funds representing most major asset classes. Investors in a blended global market portfolio lost 1.6% during the month. Stock markets were down across the board. U.S. stocks, as proxied by iShares Core S&P Total U.S. Stock Market ETF ITOT came back toward their fair value, as measured by the fund's Morningstar Price/Fair Value Estimate. However, valuations look more compelling further down the market-cap ladder. U.S. small caps look cheap relative to mid-caps and large caps. At the end of September, iShares Core S&P Small-Cap ETF IJR was trading at a 13% discount to its Morningstar Fair Value Estimate.
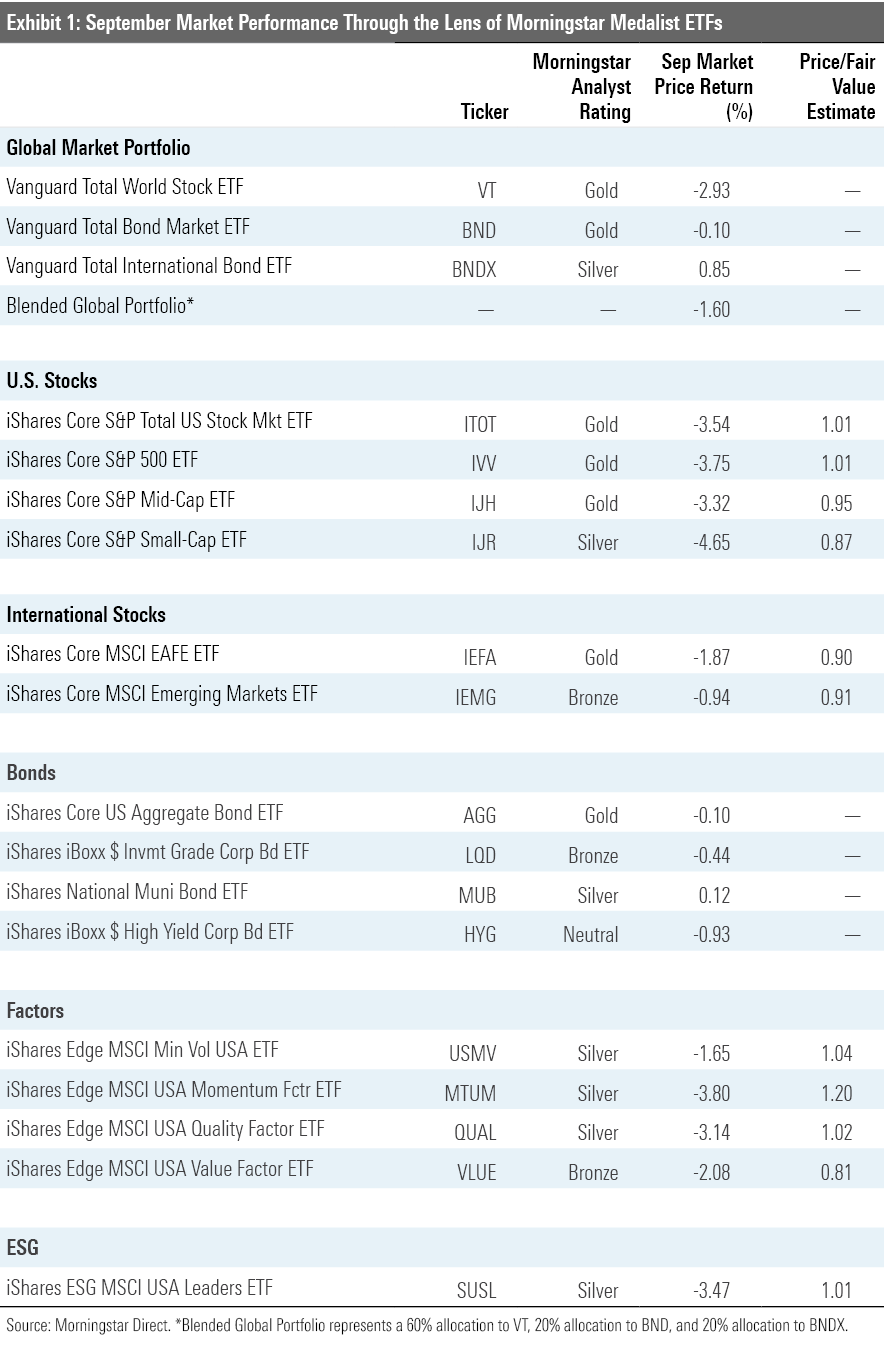
U.S. small caps continued to suffer in September. Through the first three quarters of the year, IJR lost 15.2%--lagging iShares Core S&P 500 ETF IVV by nearly 21 percentage points. Missing out on the gains of the market’s Fab 5 (Apple AAPL, Microsoft MSFT, Amazon.com AMZN, Facebook FB, and Alphabet GOOG) and sticking with REITs and regional banks that have been hit hard by the coronavirus crisis explain most of IJR’s underperformance.
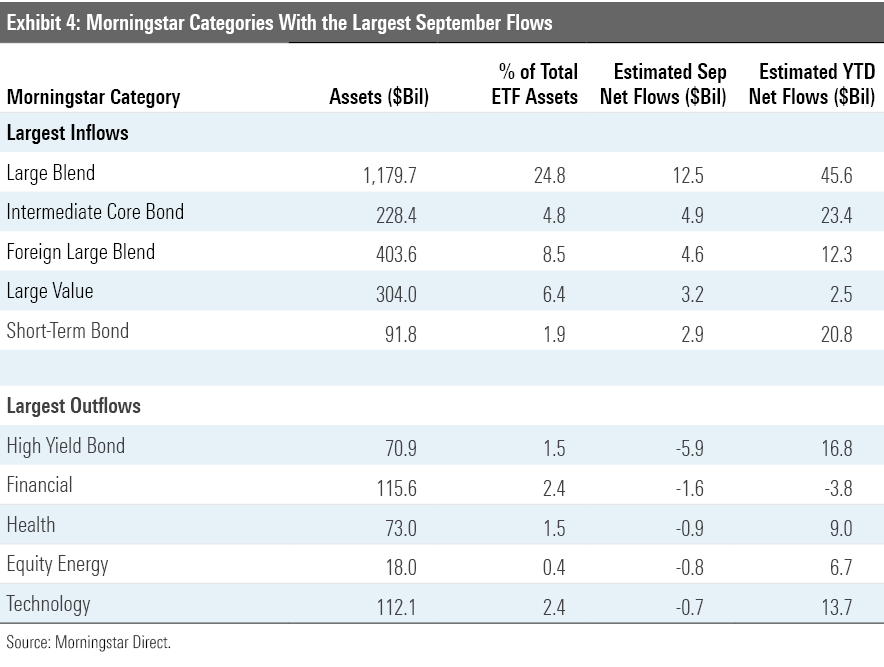
Value stocks outgained growth stocks in September. The Morningstar US Value Index fell nearly 2.7%, while the Morningstar US Growth Index dropped 5.2%. But it is far too early to call it a comeback for value stocks. For the year to date through September, the growth index was up 28.4%, while its value counterpart was down 15.9%. That’s not stopping some investors from betting on a bounceback for bedraggled value funds. In September, ETFs in the large-, mid-, and small-value Morningstar Categories saw inflows of just over $2.9 billion.
Long-term interest rates crept ever so slightly higher and sent bond prices ever so slightly lower in September. Credit-risky bonds got swept up in the broader selling, sending iShares iBoxx $ Investment Grade Corporate Bond ETF LQD and iShares iBoxx $ High Yield Corporate Bond ETF HYG 0.44% and 0.93% lower, respectively.
Strategic-beta ETFs representing a variety of individual factors had a mixed showing versus the broader U.S. stock market. Low volatility, as proxied here by iShares MSCI USA Minimum Volatility Factor ETF USMV, held up better than the broader market, outperforming ITOT by 1.9 percentage points. While these strategies should generally hold up better than the broader market when the going gets tough, that won’t always be the case. Value edged out growth in September, but it got cheaper. IShares Edge MSCI USA Value Factor ETF VLUE was trading at a 19% discount to its Morningstar fair value estimate at the end of September.
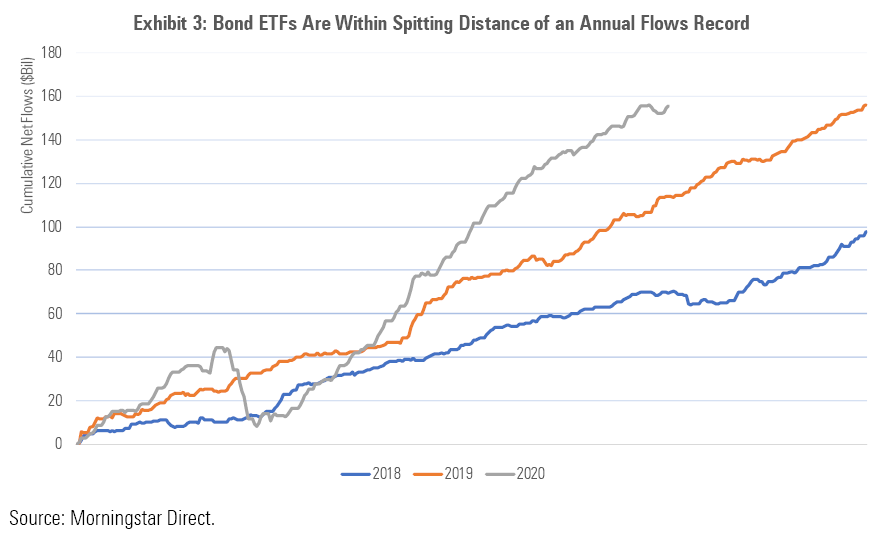
At the End of Three Quarters, Bond ETF Flows Are Just Shy of a Record Money has flooded bond funds following the Fed's March intervention. Fixed-income ETFs took in $12.6 billion in net new flows in September, down from August's $16.0 billion and sharply lower than June's $33.5 billion, which marked a monthly record. Despite the slowdown, bond ETFs are still on track to have record inflows in 2020. Through September, they amassed $155.4 billion in net new flows, just shy of 2019's record $156.0 billion. Bond ETFs effectively received the Fed's seal of approval when it announced its Secondary Market Corporate Credit Facility would buy corporate bond ETFs. This will have a lasting effect on this market, which is becoming ever more deeply intertwined in the broader fixed-income ecosystem.
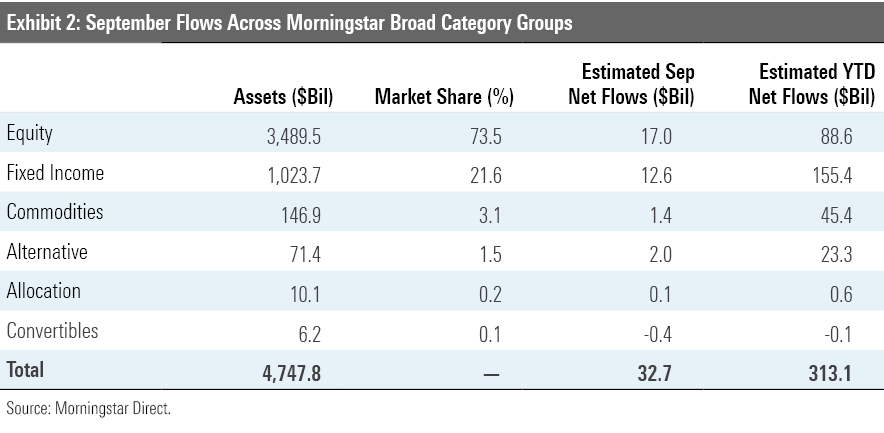
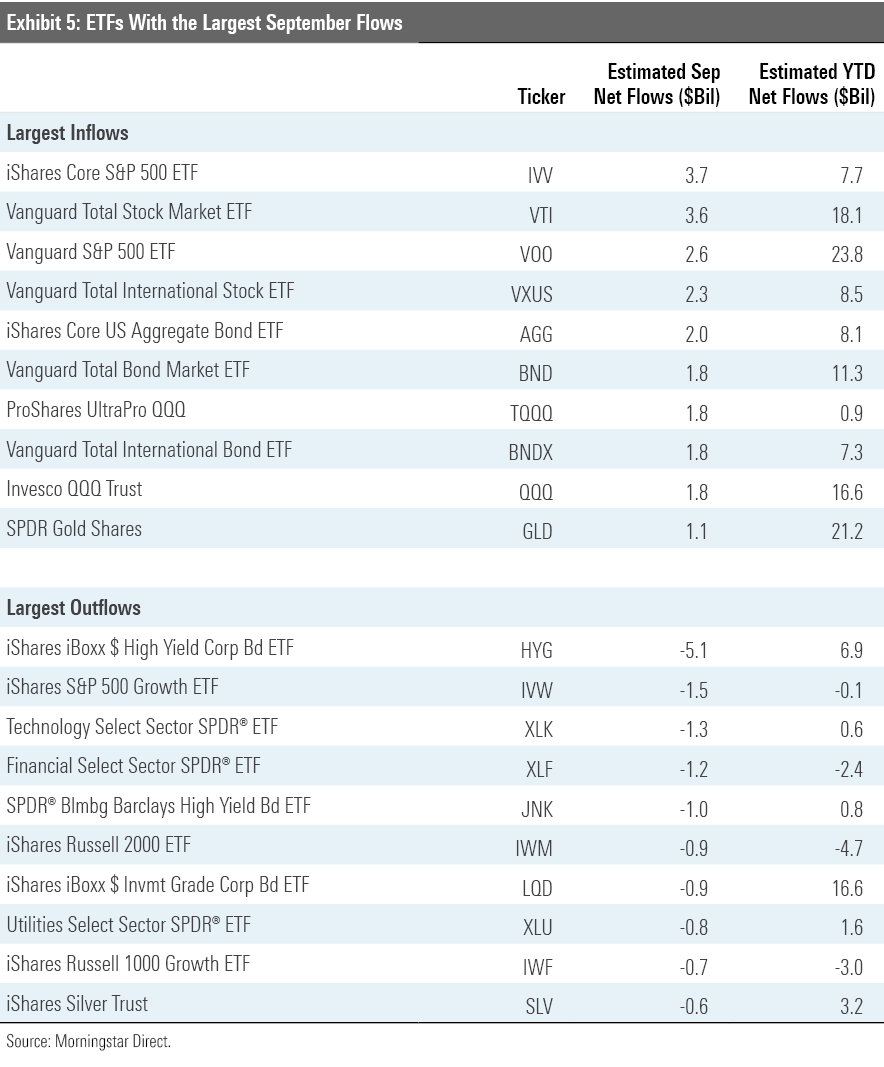
Stock ETFs gathered $17 billion in net new assets in September. Flows were split across portfolio staples like Vanguard Total Stock Market ETF VTI and Vanguard Total International Stock ETF VXUS and funds that have experienced searing-hot recent performance like ProShares UltraPro QQQ TQQQ and Invesco QQQ Trust QQQ. HYG experienced the largest September outflows of any ETF by a wide margin. The size of the fund’s flows point to its role as the instrument of choice for high-yield bond exposure for a growing number of large institutions with different use cases and generally shorter time horizons than most allocators.
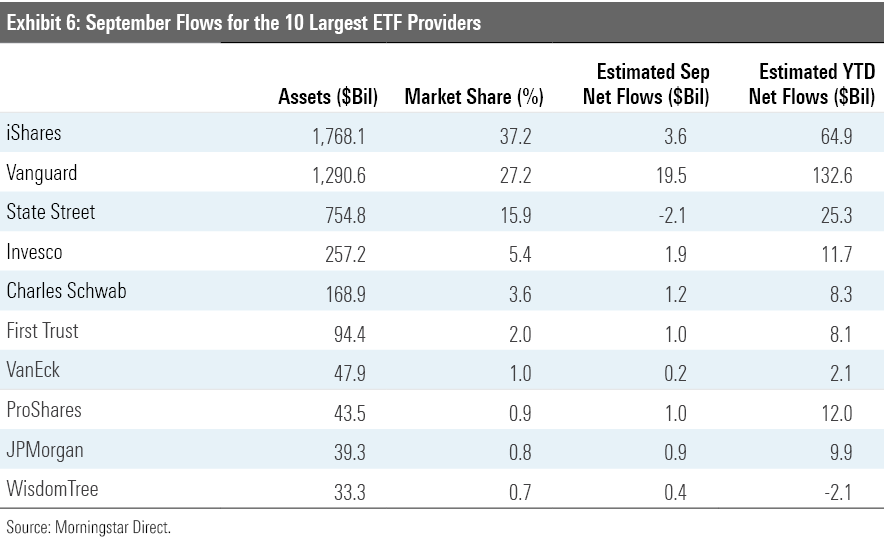
Vanguard dominated the ETF flows league table in September. The firm’s ETFs brought in $19.5 billion in net new money. This was more than double the amount brought in by its nine-largest competitors combined. On a year-to-date basis, Vanguard’s $132.6 billion in ETF flows were only slightly less than the sum of its nine largest competitors ($140.3 billion). It is important to note that a portion of Vanguard's ETF flows have resulted from conversions of assets in the firm's Admiral share class to ETF shares, which, following a wave of repricing that was implemented over the past year, are now cheaper than the Admiral shares of the same funds.
Following a three-month streak of outflows that spanned from April to June, Schwab's ETF lineup experienced its third consecutive month of inflows in September. Its three-month drought broke the firm's long record of steady net inflows, which had gone uninterrupted from its 2009 inception through April of this year. Outflows were likely driven by changes to the firm's own proprietary ETF model portfolios.
WisdomTree is alone among the 10-largest ETF issuers in experiencing outflows for the year to date through September. The firm’s currency-hedged duo of WisdomTree Europe Hedged Equity ETF HEDJ and WisdomTree Japan Hedged Equity ETF DXJ have seen a combined $1.9 billion of outflows through the first nine months of the year. The relative underperformance of European and Japanese stocks versus the U.S. and the weakness of the U.S. dollar have no doubt played some part in driving these outflows.
Value Got Cheaper as Stocks Slid, and Disruptors' Valuations Are Ripe for Disruption The Morningstar fair value estimate for ETFs rolls up our equity analysts' fair value estimates for individual stocks and our quantitative fair value estimates for those stocks not covered by Morningstar analysts into an aggregate fair value estimate for stock ETF portfolios. Dividing this value by the ETFs' market prices yields the price/fair value ratio. This ratio can point to potential bargains and areas of the market where valuations are stretched.
Exhibit 7 features the 10 ETFs that were trading at the largest discounts and premiums to their fair value estimates as of the end of September. Nine of the funds trading at the largest discounts belong to the equity energy category. Pain has been pervasive in the energy sector this year as demand has declined and supply has continued to flood the market. As producers ran out of places to store their output, prices collapsed, as did the share prices of firms operating in the oil- and gas-service industry.
But the market is a discounting mechanism, and just as the oil patch appeared to be on the brink, many investors began wagering that the worst had passed. After a sharp rebound off the bottom, oil prices have normalized and energy stocks' gains have stalled. September brought a fresh wave of selling in the sector. A slowdown in China’s oil consumption and expanding stores sent oil prices lower. Energy Select Sector SPDR ETF XLE, which holds the energy names in the S&P 500, fell 14.6% in August. So, while the sector has come back from the edge (remember when oil futures prices were negative for a moment earlier this year?), many energy names are still trading at steep discounts.
Tech stocks have been on a tear this year, so it is no surprise to see a number of tech-focused funds among the ranks of the most overvalued ETFs. Notable among them are Ark Next Generation Internet ETF ARKW and Global X Cloud Computing ETF CLOU. Both funds were at least 35% overvalued as of the end of September. Investors' enthusiasm for the stocks that these funds own has grown amid a worldwide lockdown that's forced many to work, shop, and live online. We have seen a number of new ETFs added to the menu this year that aim to capitalize on these trends.
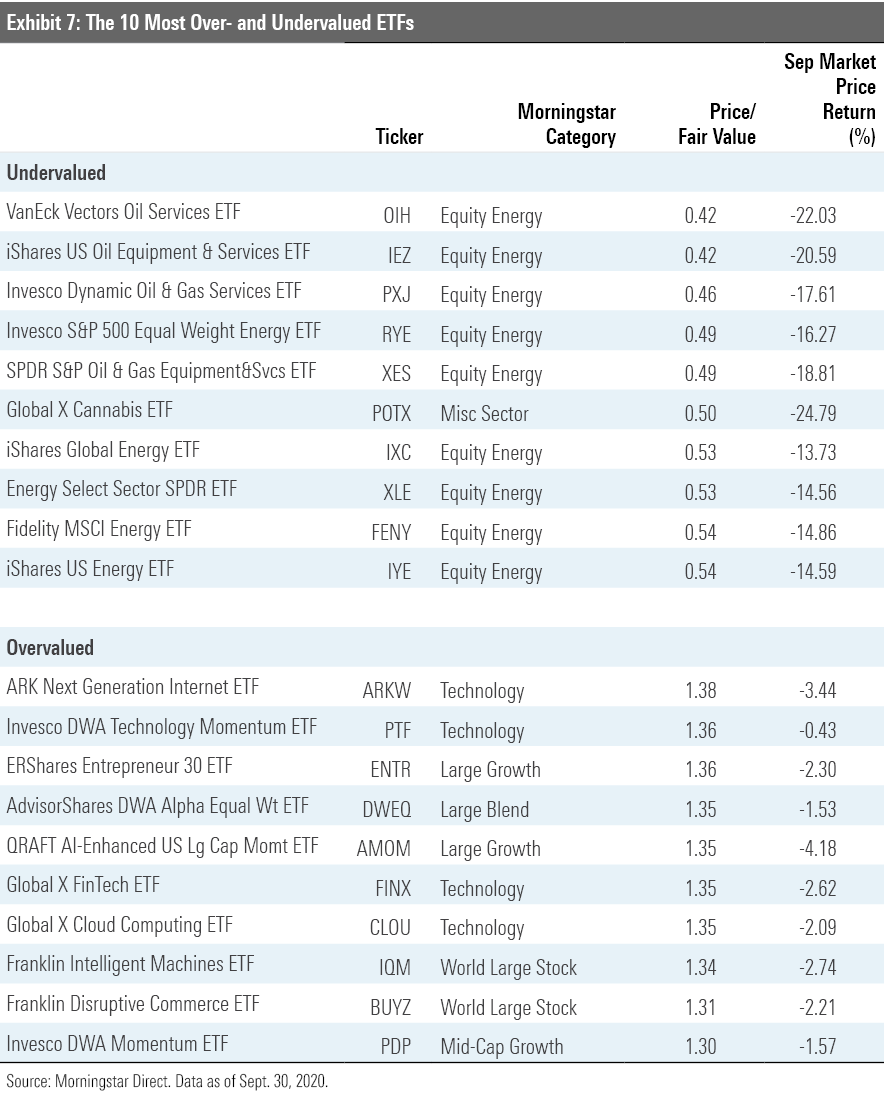
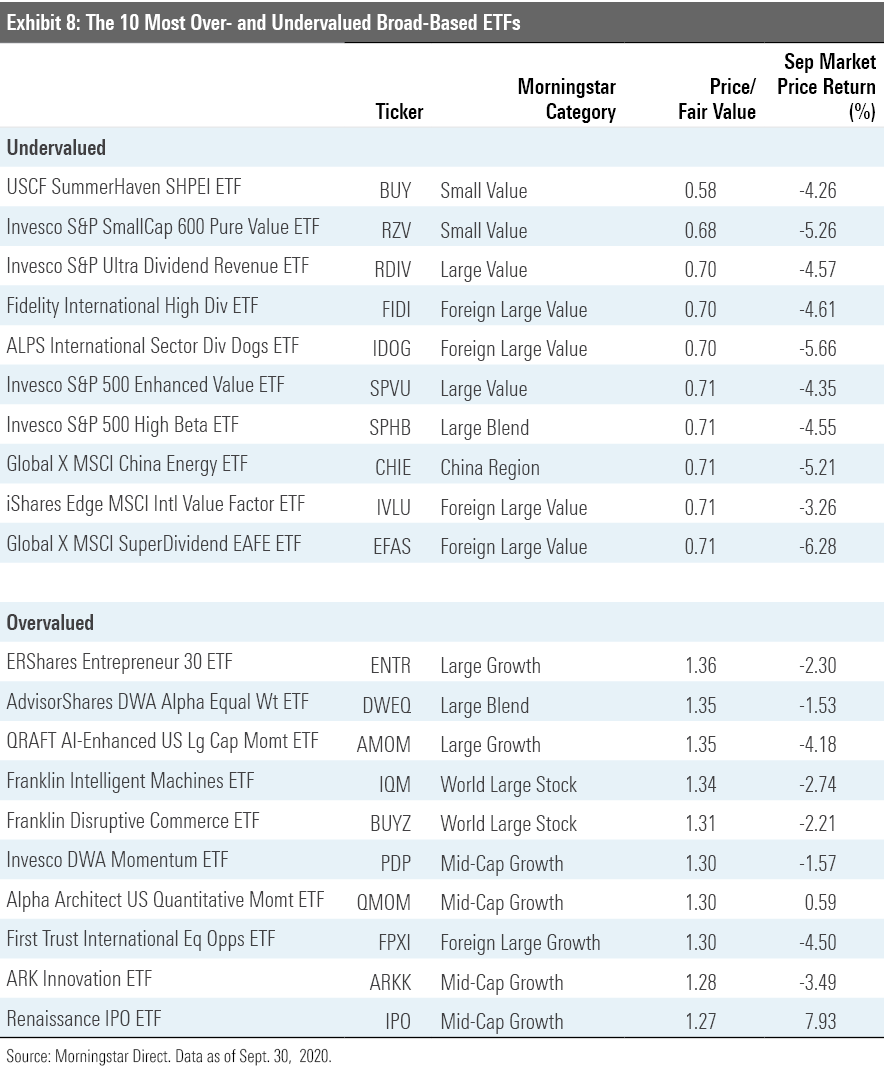
Exhibit 8 features the 10 broad-based ETFs (those belonging to one of the mainline Morningstar Style Box or other broader geographic categories) that were trading at the largest discounts and premiums to their fair value estimates as of month-end. The common thread among the nine of the 10 most undervalued funds is an orientation toward smaller, cheaper stocks. Some of them deliberately lean into value by virtue of selecting and weighting stocks based on their relative cheapness. This is the case for Invesco S&P SmallCap 600 Pure Value ETF RZV. There are also four value-oriented funds that invest in international stocks featured on this month's list. Notable among them is iShares Edge MSCI International Value Factor ETF IVLU, the foreign cousin of VLUE. Like its U.S. cousin, IVLU takes a sector-neutral approach, sweeping in the cheapest stocks within each sector and weighting them based on a combination of their market cap and the strength of their value characteristics. The result is a portfolio with a strong and consistent value orientation.
The most overvalued broad-based ETFs include a number of funds with a momentum focus. Alpha Architect U.S. Quantitative Momentum ETF QMOM and QRAFT AI-Enhanced U.S. Large Cap Momentum ETF AMOM both spin highly concentrated, high-octane momentum portfolios by design. Folding in names that are priced at premium multiples is embedded in these funds' DNA. ERShares Entrepreneur 30 ETF ENTR finished the month trading 36% higher than its Morningstar fair value estimate. The fund has gained 35% for the year to date, getting a lift from large stakes in top-performing stocks like Amazon, Nvidia NVDA, and Tesla TSLA.
Disclosure: Morningstar, Inc. licenses indexes to financial institutions as the tracking indexes for investable products, such as exchange-traded funds, sponsored by the financial institution. The license fee for such use is paid by the sponsoring financial institution based mainly on the total assets of the investable product. Please click here for a list of investable products that track or have tracked a Morningstar index. Neither Morningstar, Inc. nor its investment management division markets, sells, or makes any representations regarding the advisability of investing in any investable product that tracks a Morningstar index.
/d10o6nnig0wrdw.cloudfront.net/04-18-2024/t_34ccafe52c7c46979f1073e515ef92d4_name_file_960x540_1600_v4_.jpg)
/d10o6nnig0wrdw.cloudfront.net/04-09-2024/t_e87d9a06e6904d6f97765a0784117913_name_file_960x540_1600_v4_.jpg)
/cloudfront-us-east-1.images.arcpublishing.com/morningstar/T2LGZCEHBZBJJPPKHO7Y4EEKSM.png)
:quality(80)/s3.amazonaws.com/arc-authors/morningstar/a90ba90e-1da2-48a4-98bf-a476620dbff0.jpg)