
Foreign Stocks' Lost Decade
They have suffered 10 years of poor earnings growth.
/s3.amazonaws.com/arc-authors/morningstar/78665e5a-2da4-4dff-bdfd-3d8248d5ae4d.jpg)
From the nadir of the financial crisis up to the early days of the coronavirus pandemic, foreign stocks failed to keep pace with U.S. stocks. And the gap in their postcrisis performance was wide. Between April 2009 and December 2019, the MSCI USA Index trounced the MSCI ACWI ex USA Index by about 7 percentage points annually.
There are a number of factors explaining this divergence. Technology stocks have been among the best performers of the past decade and represent a larger share of the U.S. market than foreign markets. Also, an appreciating U.S. dollar hurt foreign stocks' dollar-denominated returns.
While the U.S. market has clearly benefited from both trends, a deeper analysis reveals that differences in sector composition and a strong dollar played a relatively small role. As it turns out (and as should be no surprise) differences in earnings growth explain most of this gap. U.S. companies had much loftier earnings-growth rates than their foreign counterparts after controlling for their sector composition, which fueled their superior performance.
The Effects of Foreign Exchange Foreign-exchange fluctuations can partially explain the relative performance of U.S. and ex-U.S. stocks. Foreign shares are listed and traded in their local currencies, and exchange rates translate their performance back to U.S. dollars.
Movements in foreign-exchange rates can help or hurt U.S. investors that hold foreign assets, depending on the direction that they move. The U.S. dollar has appreciated relative to many foreign currencies over the past decade. As of December 2019, it took more euros, yen, or pounds to purchase one dollar than it did in April 2009. That makes it more expensive to repatriate assets denominated in foreign currencies, thus hurting the dollar-denominated returns of foreign stocks.
The impact of foreign-exchange rates can be quantified by subtracting the total return from foreign stocks denominated in their local currencies from that denominated in U.S. dollars. Exhibit 1 shows the result of this calculation for each year from 2009 through 2019.
Currency movements can also affect firm-level fundamentals, especially for export-oriented companies. All else equal, a country's exports become more competitive in global markets the cheaper its currency is relative to other competing exporters' currencies.
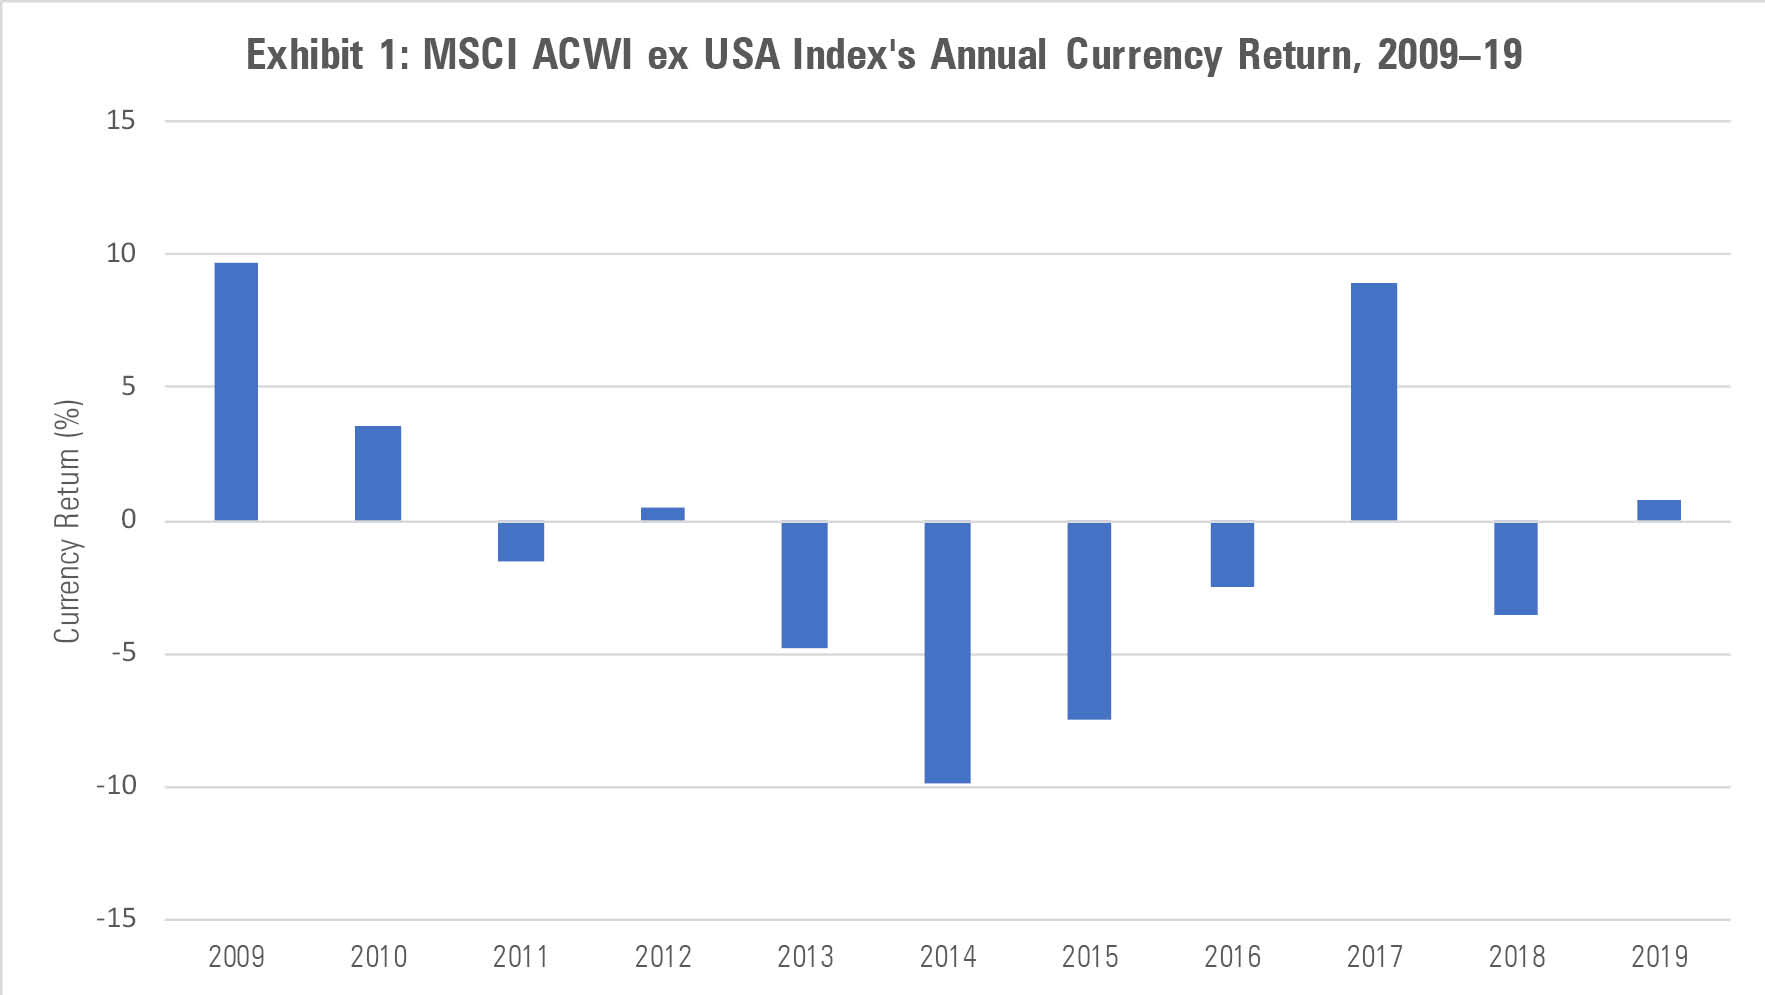
Source: Morningstar Direct.
In a given year, exchange rates can have a substantial effect on the dollar-denominated return of foreign stocks. By historical standards, a 10-percentage-point gain or loss, solely because of changes in exchange rates, wouldn't be unusual. But the impact is more muted over longer periods. From April 2009 through December 2019, the MSCI ACWI ex USA Index lagged the MSCI USA Index by about 7.1 percentage points annually. Of that difference, only 72 basis points per year was attributable to changes in foreign-exchange rates, meaning a majority of the performance gap between the U.S. and foreign markets (about 6.4 percentage points) was attributable to noncurrency factors.
Market Composition It's hard to ignore the impressive performance of the U.S. technology sector since the market bottomed in early 2009. From April 2009 through the end of 2019, the MSCI USA Information Technology Index beat the MSCI ACWI ex USA Information Technology Index by 7 percentage points annually. At the beginning of that period, technology stocks' weighting in the United States was about 12% greater than overseas. Together, those two points seem to indicate that the U.S. market's larger stake in technology stocks should explain a significant portion of the disparate postcrisis performance of U.S. and foreign markets.
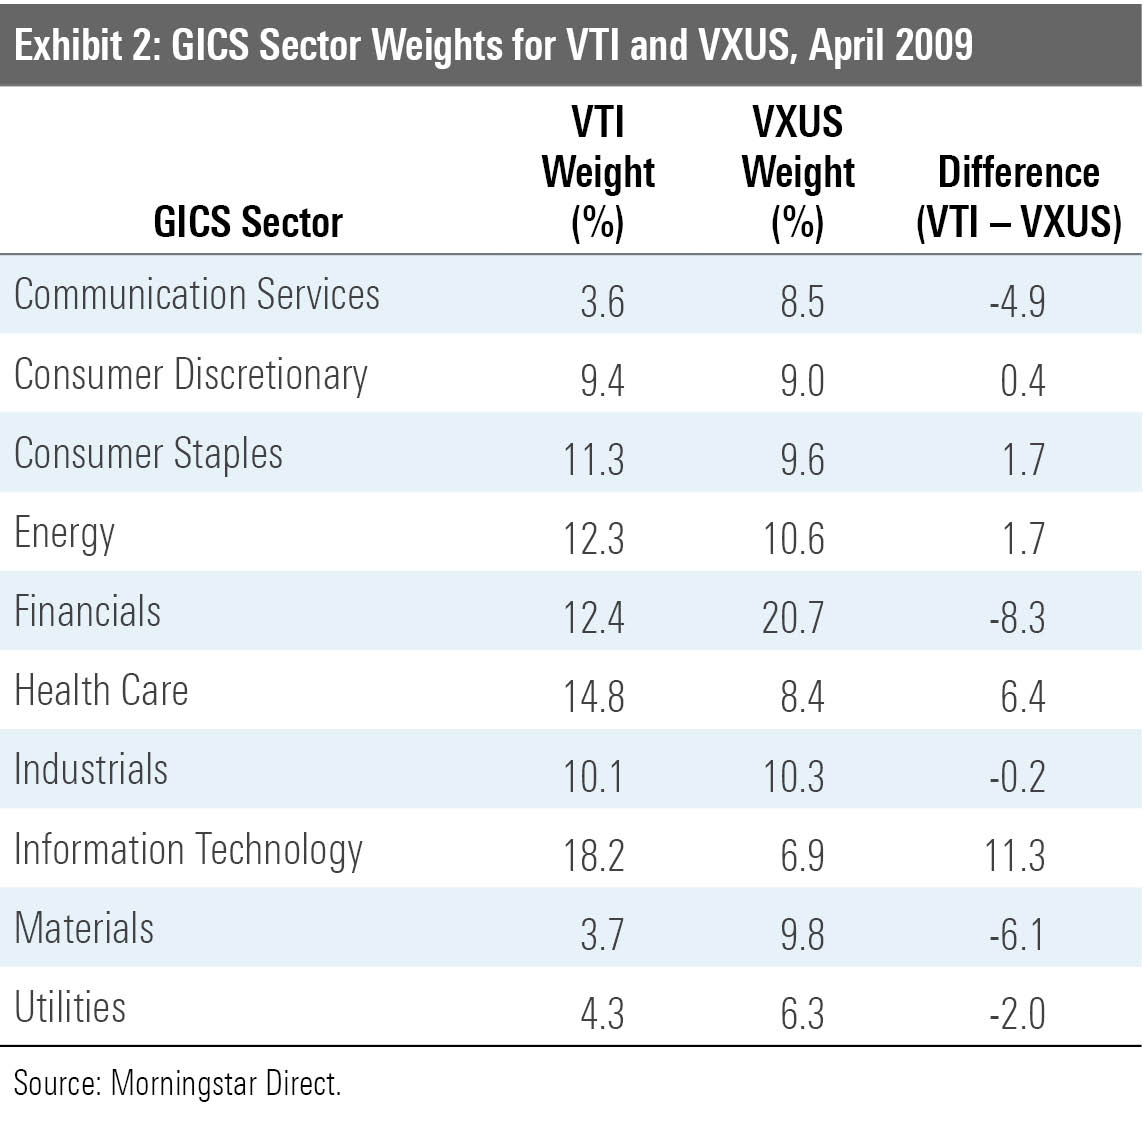
That assessment isn't quite complete. First, sector weights and performance can't be analyzed in isolation. Overweighting one segment of the market means others will have a proportionally smaller share. Exhibit 2 shows that there were other sizable differences in sector weights between the U.S. market (represented by Vanguard Total Stock Market ETF VTI) and the foreign market (represented by Vanguard Total International Stock ETF VXUS) in April 2009. VTI also had a heavier dose of healthcare stocks, with relatively smaller weights in financials and materials.
Second, comparing any U.S. sector to its overseas equivalent glosses over differences in the companies within each sector. Looking back at the technology sector in early 2009, Microsoft MSFT and IBM IBM were giants in the U.S., while Nokia and Samsung were the big players overseas. All were technology firms, but each one was involved in a fundamentally different business, with different management teams producing different products and services that resulted in different returns to shareholders.
Put another way, differences in sector weights are only part of the puzzle. The impact of individual stocks' performance needs to be considered to fully understand how market composition affected the performance gap.
Exhibit 3 unpacks the contribution of sector allocation and security selection. It shows the results of a performance attribution analysis that quantifies how each of these factors contributed to the difference in VTI and VXUS' total returns. The numbers are cumulative and were calculated from April 2009 through December 2019.
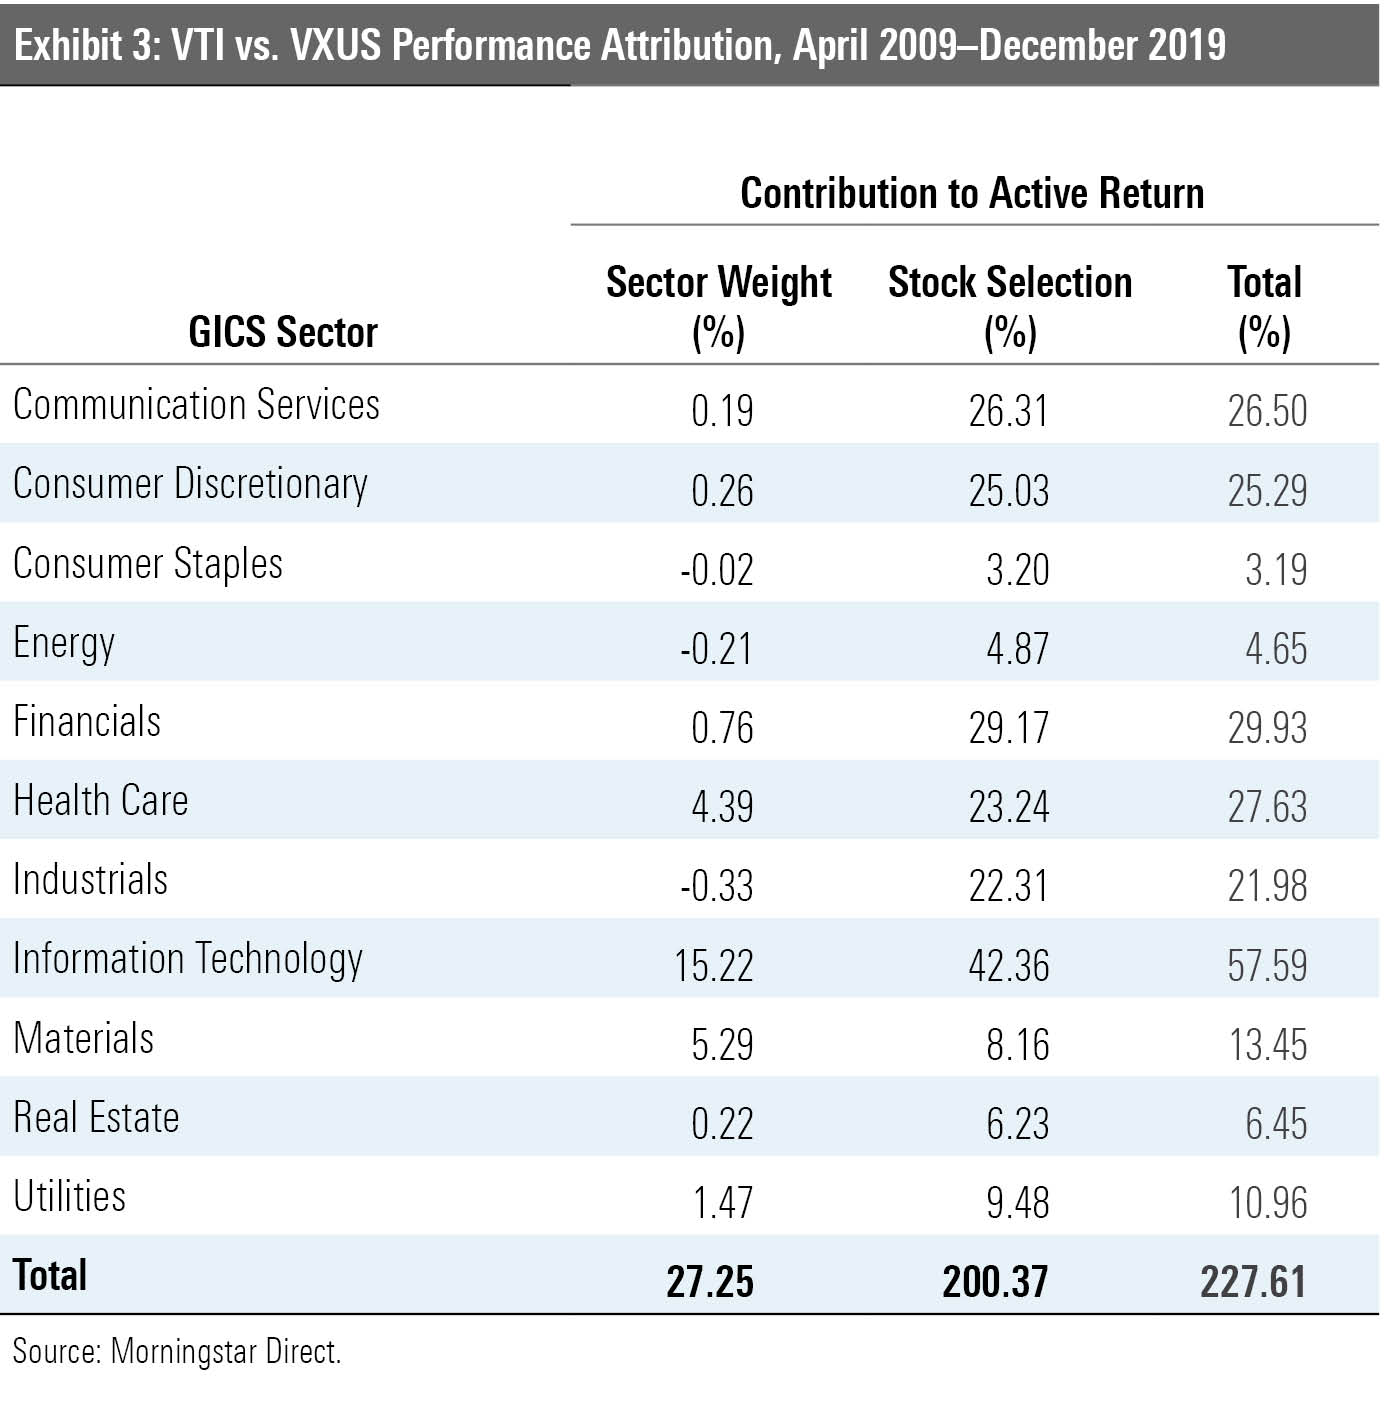
Cumulatively, VTI outperformed VXUS by 227 percentage points over the period. Of that, only 27 percentage points were attributable to differences in sector weights. The bulk of the difference, 200 percentage points, was due to performance differences among the underlying stocks. While the VTI's larger allocation to tech stocks and exposure to better-performing names within the sector were the largest contributors to its relative performance, they still only explained roughly a fourth of the return difference. Across the board, U.S. companies outperformed their overseas counterparts in every sector. Nontechnology stocks, including those from the financials, healthcare, and communication-services sectors, also made large contributions.
It's Fundamental We can obtain more insight by using a different decomposition method. Specifically, we can split these two markets' returns into two components: price/earnings growth (P/E multiple expansion) and earnings-per-share growth. EPS growth incorporates multiple subcomponents, including sales growth, profit margin expansion, and the effects of stock issuance and buybacks.
P/E growth is calculated for each market by annualizing the differential between its ending P/E ratio and starting P/E ratio. That number is then subtracted from a market's total return to arrive at its annualized EPS growth. Exhibit 4 shows the results of this decomposition for the MSCI USA and the MSCI ACWI ex USA indexes from April 2009 through December 2019.
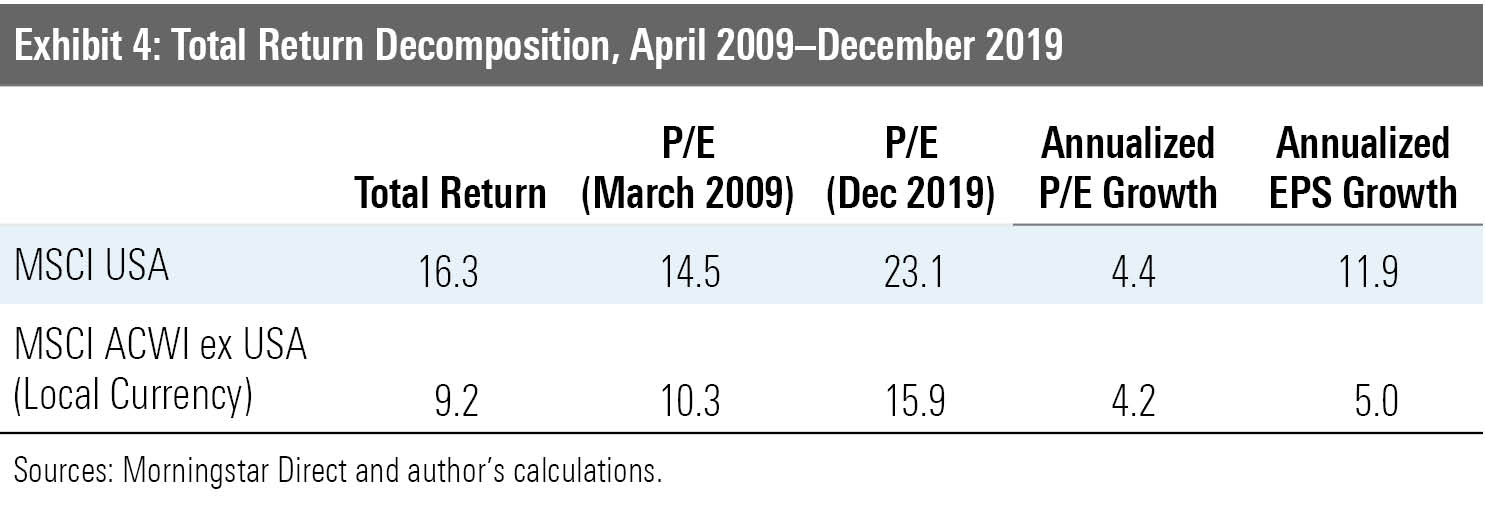
The MSCI USA Index had a slight edge in terms of multiple expansion, but the bigger difference was in annualized EPS growth. On this measure, the U.S. market clearly outpaced the foreign market. Exhibit 5 combines the currency return, P/E growth, and EPS growth to show how each contributed to the performance gap.
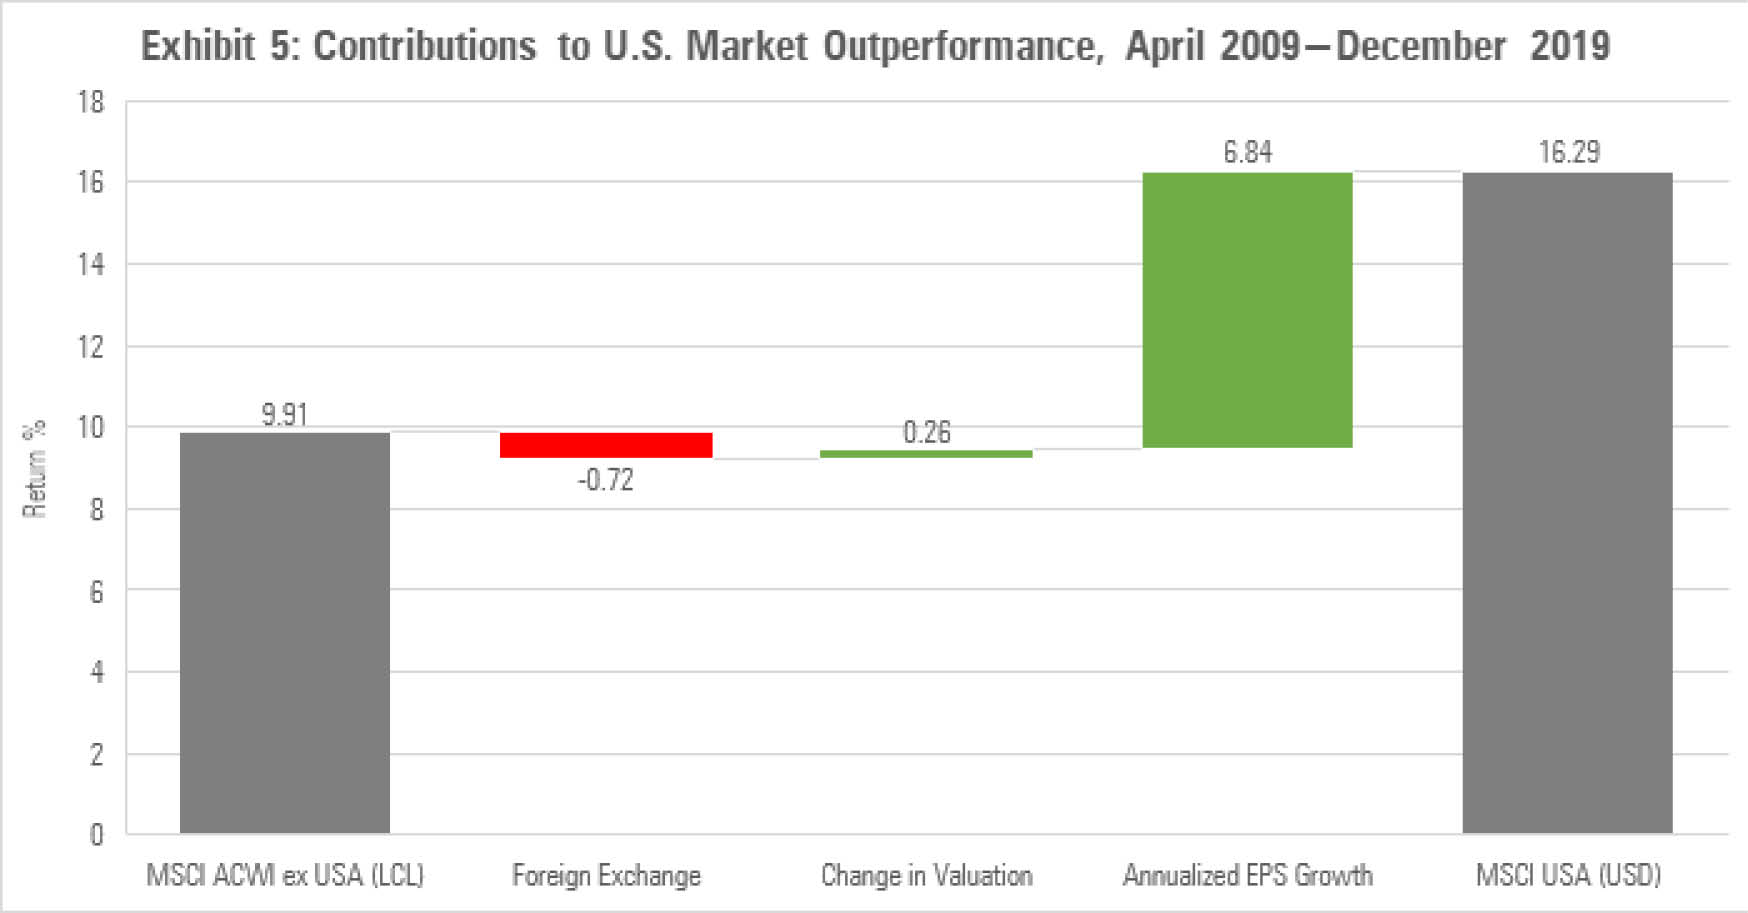
Sources: MSCI, Morningstar Direct, author's calculations.
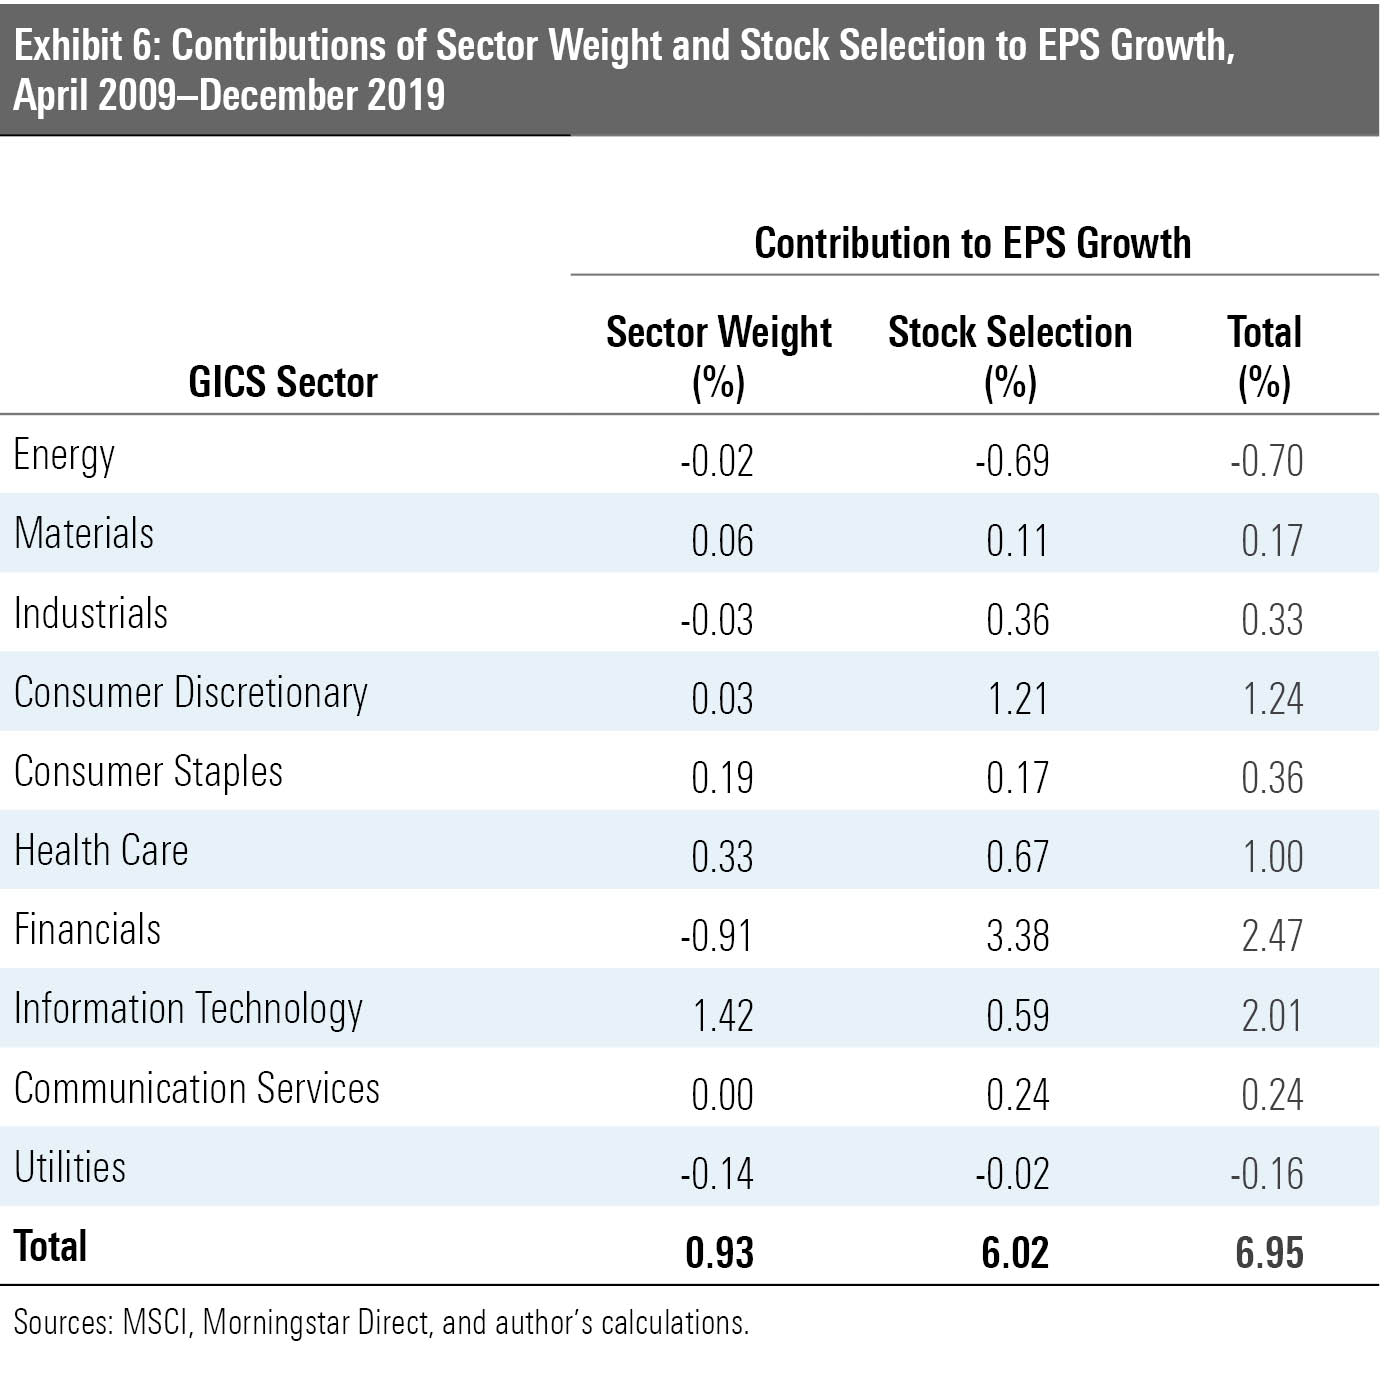
Exhibit 6 further breaks down the U.S. market's EPS growth advantage. Like the total-return decomposition in Exhibit 3, stock selection--differences in the underlying companies across U.S. and foreign markets--was responsible for most of the performance advantage. And U.S. financial stocks did most of the heavy lifting. U.S. financial companies experienced a strong resurgence after the financial crisis, while foreign firms in the financial sector have languished.
Past Isn't Prologue While U.S. stocks outperformed foreign stocks in the postcrisis period, that hasn't always been the case. The chart below shows the relative growth of the MSCI USA Index relative to the MSCI EAFE Index going back to 1970 (the MSCI ACWI ex USA has a more limited history). The U.S. market outperformed the MSCI EAFE where the line slopes up. Conversely, the MSCI EAFE outperformed domestic stocks where the line slopes down.
Historically, these markets have taken turns outperforming each other. Investing in both makes sense because it is difficult to determine which one will outperform in the future.
The past decade has been a one-way market, one in which diversifying with international stocks didn't look like a great idea. But there is still a case to own them. A market can't move in one direction forever. Valuations have to enter the picture, eventually. Owning a diversified portfolio means that some assets will perform well while others do poorly. The question isn't "will foreign stocks come back?" It's a matter of when.
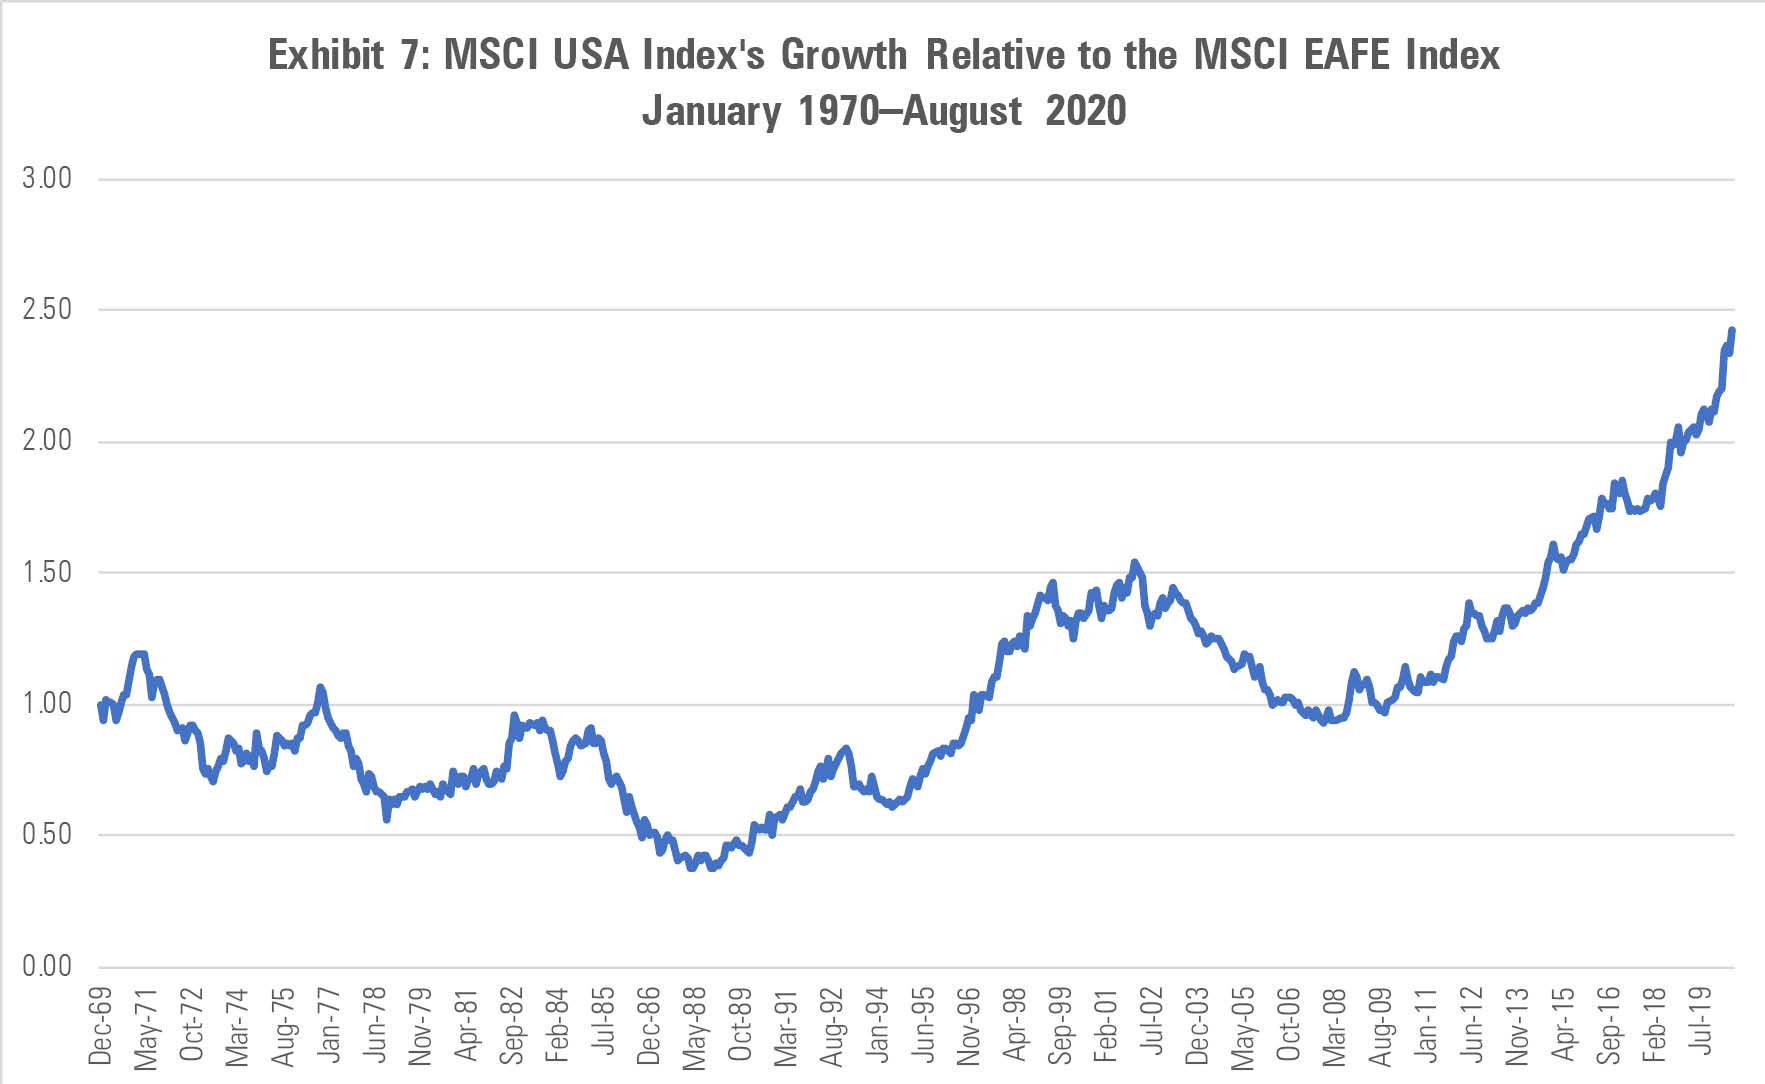
Source: Morningstar Direct.
/cloudfront-us-east-1.images.arcpublishing.com/morningstar/T2LGZCEHBZBJJPPKHO7Y4EEKSM.png)
/d10o6nnig0wrdw.cloudfront.net/04-18-2024/t_34ccafe52c7c46979f1073e515ef92d4_name_file_960x540_1600_v4_.jpg)
/d10o6nnig0wrdw.cloudfront.net/04-09-2024/t_e87d9a06e6904d6f97765a0784117913_name_file_960x540_1600_v4_.jpg)
:quality(80)/s3.amazonaws.com/arc-authors/morningstar/78665e5a-2da4-4dff-bdfd-3d8248d5ae4d.jpg)