
Mind the Gap: Active Versus Passive Edition 2018
We have met the enemy and he is us.
/s3.amazonaws.com/arc-authors/morningstar/a90ba90e-1da2-48a4-98bf-a476620dbff0.jpg)
The article was published in the April 2018 issue of Morningstar ETFInvestor. Download a complimentary copy of ETFInvestor by visiting the website.
When it comes to investing, we are so often our own worst enemy. Countless studies have shown that we tend to chase performance: buying high, selling low, and failing to learn from our mistakes every time. This applies to individual stocks, funds, Beanie Babies, cryptocurrencies, you name it.
We pay a steep price for our actions, one that can be many multiples of a commission or an annual fee. In the realm of funds, we can roughly quantify the cost of this bad behavior. For years, my colleague and Morningstar FundInvestor editor Russ Kinnel has documented this phenomenon and sized the toll it takes on investors' returns in his annual "Mind the Gap" study.
Sizing the Gap We can approximate the penalty investors incur as a result of their own actions by looking at the difference between the returns funds generate (time-weighted returns) and the returns investors experience (cash-flow-weighted returns). Time-weighted returns are commonplace; they are a simple measure of the compound rate of growth in an investment. These are the returns featured in fund company fact sheets and Morningstar's Growth of 10K charts. Cash-flow-weighted returns are less familiar. They account for money flowing into and out of individual funds. Morningstar introduced Morningstar Investor Returns in 2006 to better measure investors' actual (average) experience with funds.
By subtracting funds’ time-weighted returns from their Morningstar Investor Returns, we can get a sense of how well investors tend to use a particular fund or a specific group of funds, on average. Negative values indicate that investors may be leaving money on the table, while positive ones might be indicative of good behavior. Through the years, Russ has found that the behavior gap across most broad Morningstar Categories (U.S. equity, sector equity, taxable bond, and so on) has been generally negative, though its magnitude has varied over time. Also, Russ has found that less-risky and less-costly funds tend to have narrower return gaps.
How Do Investors in Passive Funds Tend to Behave? As was the case when I first conducted this analysis in the April 2016 issue of ETFInvestor, I look at this from a different angle. Here I examine how, on average, investors in passively managed funds have behaved relative to investors in actively managed funds. To do so, we calculated asset-weighted time-weighted returns and Morningstar Investor Returns for all active and index mutual funds from a select group of categories that represent the majority of assets invested in U.S. mutual funds. The summary results appear in Exhibits 1 and 2.
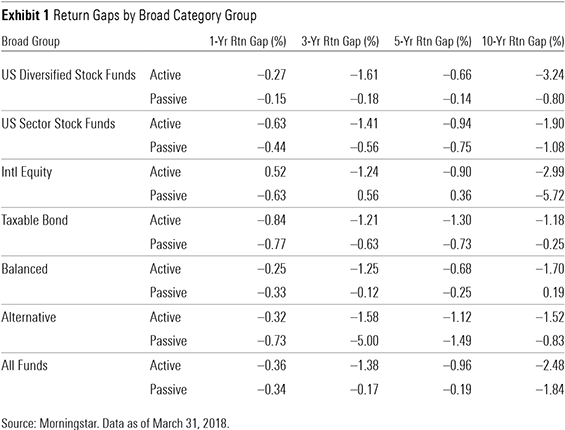
Survey Says ... On average, passive funds had narrower return gaps during the trailing one-, three-, five-, and 10-year periods ended March 31, 2018. Not only was this gap slimmer in most cases, but in some instances it was also materially so. For example, in the case of diversified U.S.-stock funds, passive funds' 10-year return gap was negative 0.80%. The average return gap across all active funds during the decade ended March 31, 2018, was negative 3.24%. At first blush, it appears that investors in passive funds are heading to choir practice while active fund investors are smoking in the boys' room (hat tip to Brownsville Station).
The most significant (in terms of where investors’ assets are) divergences in investor behavior between the active and passive cohorts can be seen in the 10-year figures for diversified U.S.-stock funds and international-equity funds. As mentioned above, investors in diversified U.S.-stock index funds have generally been better behaved than those in actively managed ones. The inverse is true in the case of international-equity funds. In this case, though investors’ return gap was large and negative for active funds, it paled in comparison to the negative 5.72% spread investors in index funds inflicted on themselves.
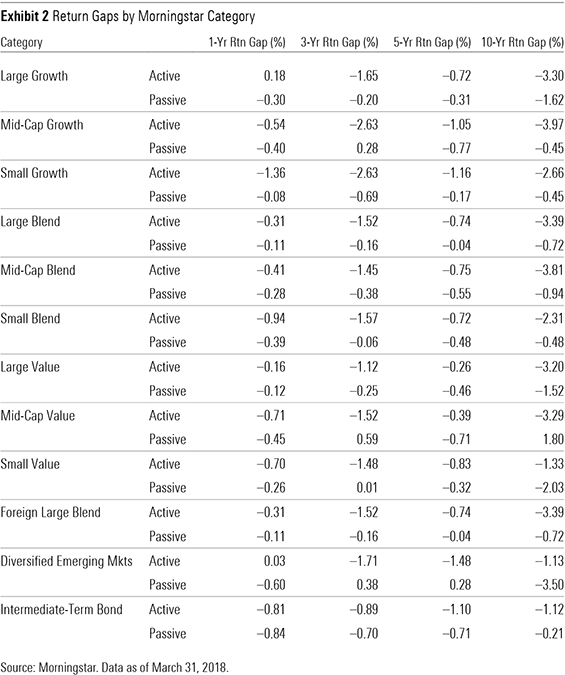
The breakdown of return gaps across the nine categories that form the Morningstar Style Box (see Exhibit 2) shows a good deal of variation on a category-by-category basis. For example, investors in small-growth index funds shot themselves in the foot in the 12 months through March 31, 2018, while those in large-growth funds appear to have been more patient. These examples further illustrate the volatility of these relationships, especially over shorter horizons.
Investors in both active and passive taxable-bond funds did themselves more harm than good when timing their purchases and redemptions. Return gaps among both cohorts were negative during each review period, though passive funds’ return gaps were substantially less so during the trailing three-, five-, and 10-year periods.
What Might Explain These Differences? There are many factors that drive investment flows: market sentiment, valuations, demographic trends, and seasonality, just to name a few. In theory, they should all have the same effect on investors' behavior, on average, regardless of whether they're investing in actively managed funds or passive ones. What explains the differences in behavior between the two? The most important factors at play here, in my opinion, pertain to investors' expectations and investment channels. There are also important issues regarding the math behind these figures and investors' liquidity needs that need to be accounted for. Investors in passively managed funds generally have a standard set of expectations. They will get--to paraphrase Vanguard founder John Bogle--the market return less a fee. Of course, as we know, earning the market return minus a tiny fee is generally a winning proposition over a long time horizon. (See "Active Managers' Success Rates Spiked Higher in 2017" on Page 4 on this issue of ETFInvestor.) Manager changes, prolonged bouts of underperformance, or hefty capital gains distributions are of no concern to index-fund investors. For them, there are no alarms and no surprises (hat tip to Radiohead). So with their expectations set and little chance for surprise along the way, they are generally content to sit tight and earn the market's return. This is evident in the return gap data.
I believe that there are also investment-channel-specific considerations that can partly explain the differences in return gaps between active and passive funds. In particular, I believe the fact that index funds are prevalent in many employers’ 401(k) menus and represent a growing share of target-date funds’ assets (of course, target-date funds are increasingly the default investment options in many 401(k) plans) has played a significant role in the growth of index funds in general and the population of well-behaved, disciplined index-fund investors in particular. In the defined-contribution channel, index funds, whether they are standing on their own or as part of a target-date series, receive regular, systematic contributions, and plan participants face stiff penalties on withdrawals. In Russ’ 2017 edition of “Mind the Gap,” he found that target-date funds had positive gaps.
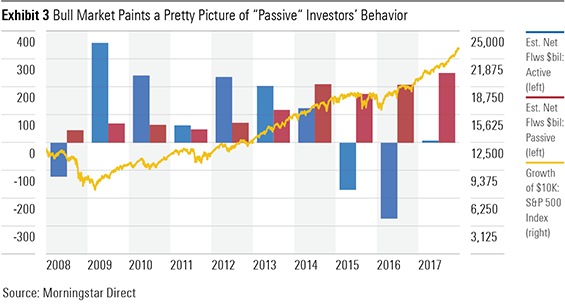
Mind the Math It is also important to understand that the returns gap, not unlike any other calculation, is an approximation and has its tics. The calculation is particularly sensitive to the timing, magnitude, and overall volatility of cash flows. Larger funds with more even flows will likely experience narrower gaps. Those with lumpier cash flows will see gaps of greater magnitude, especially if they have smaller asset bases. The former tend to be more broadly diversified (such as target-date funds and broad equity and bond funds). The latter tend to be more niche (sector funds, for example). Also, in all cases, the direction of the market segment in question will affect the math. For example, the fact that the one-, three-, five-, and 10-year return gaps for diversified equity index funds are fairly narrow should come as little surprise given that they've seen fairly regular cash flows during the past 10 years, a span during which the U.S. stock market has been trending positively. Similarly, the relatively wide gap for actively managed diversified U.S. equity funds over these same periods is in part attributable to the fact that these funds have been bleeding assets (see Exhibit 3).
Don't Assume It's All About Behavior It is important not to attribute these gaps entirely to investor behavior, good or bad. There are other factors that influence funds' cash flows that can't be divined by simply running the numbers: most notably, investors' liquidity needs. We save and invest in hopes of one day spending or bequeathing the wealth we have amassed. If an investor bails from a fund at a point in time that proves, in hindsight, inopportune, it might be owed to a moment of weakness or simply a need for cash (a large purchase, a required minimum distribution, and so on). So, while the difference between time- and cash-flow-weighted returns is a good proxy for investor behavior, it is important not to take what you see at face value.

Disclosure: Morningstar, Inc. licenses indexes to financial institutions as the tracking indexes for investable products, such as exchange-traded funds, sponsored by the financial institution. The license fee for such use is paid by the sponsoring financial institution based mainly on the total assets of the investable product. Please click here for a list of investable products that track or have tracked a Morningstar index. Neither Morningstar, Inc. nor its investment management division markets, sells, or makes any representations regarding the advisability of investing in any investable product that tracks a Morningstar index.
/cloudfront-us-east-1.images.arcpublishing.com/morningstar/T2LGZCEHBZBJJPPKHO7Y4EEKSM.png)
/d10o6nnig0wrdw.cloudfront.net/04-18-2024/t_34ccafe52c7c46979f1073e515ef92d4_name_file_960x540_1600_v4_.jpg)
/d10o6nnig0wrdw.cloudfront.net/04-09-2024/t_e87d9a06e6904d6f97765a0784117913_name_file_960x540_1600_v4_.jpg)
:quality(80)/s3.amazonaws.com/arc-authors/morningstar/a90ba90e-1da2-48a4-98bf-a476620dbff0.jpg)