
Where Are We in 'The Cycle'?
When viewed through a business-cycle lens, the current economy is showing signs of both mid- and late-cycle dynamics.
/s3.amazonaws.com/arc-authors/morningstar/3a6abec7-a233-42a7-bcb0-b2efd54d751d.jpg)
Q: I often hear people say "at this point in the cycle," but I'm not sure what that means. Where are we in the cycle?
A: I think it's important to begin with a discussion of what the business cycle is. The business cycle measures gross domestic product, or economic activity, over time. In reality, the cycle rarely looks this neat, but this simplified graph shows its four phases: expansion, peak, recession, and trough.
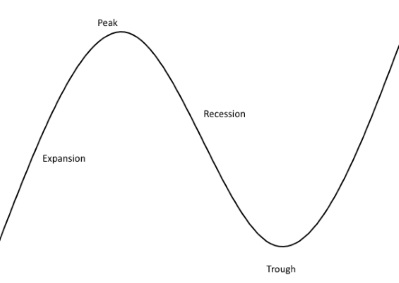
Consumer spending makes up roughly two thirds of GDP, so consumer spending activity has a huge impact on the business cycle. When consumers are spending more, the economy expands because consumers demand more products, and companies hire more workers to produce more goods and services.
At the expansionary point in the cycle, GDP is increasing, and (usually) so is inflation. Unemployment is decreasing. Interest rates are likely increasing. Why? The Fed is charged with keeping the economy strong, and it has two specific aims: maximizing employment and stabilizing prices. In an effort to stave off inflation, the Fed will often "tighten" or raise interest rates to keep price levels stable.
When GDP reaches its peak level, meaning inflation and interest rates are as high as they're going to get during the cycle and unemployment has hit a low, GDP will eventually tip downward into what we call the recession or contractionary period. How can you tell when you're at the peak? In all honesty, you can't--you have to wait until the recession has begun and then you can look at so-called lagging data to figure it out. (We'll go into what lagging indicators are in a moment.)
Recessions (as you may recall from 2008, if you've been investing or following the market for a while) are marked by decreasing GDP. Consumers pull in the reins and curtail their spending. This leads to lower output by firms, which in turn leads firms to lay off workers. GDP contracts, and inflation begins to decrease. In an effort to stimulate the sluggish economy and stabilize price levels (deflation is a very dangerous threat to the economy), the Fed will often "ease" or lower interest rates. This lowers the cost of borrowing, which theoretically encourages consumers to spend again.
When GDP hits its low in that cycle--again, only visible in hindsight--we are in a trough, which is characterized by high unemployment, low interest rates, and low inflation.
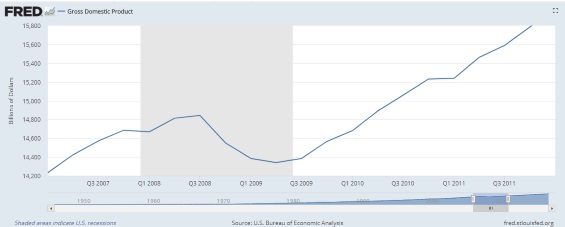
Take a look at the data below from the St. Louis Fed, which shows the peak and trough before the 2008 recession (the global financial crisis). The peak occurred in the third quarter of 2008 and the trough was in the second quarter of 2009.
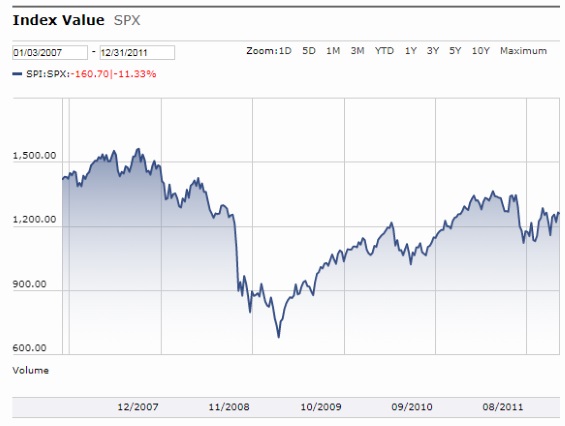
Leading and Lagging Indicators But that doesn't make sense, you say. The S&P 500 reached its peak in October 2007, which was the fourth quarter of 2007. And it hit a low on March 9, 2009, which is the first quarter of 2009. How is that possible?
The stock market generally conforms to the same trends as the business cycle, because heightened consumer spending leads to higher corporate earnings, which drives equity prices. But stocks don't always neatly mirror the business cycle because stock investors are trying to predict what's going to happen, while GDP is a measure of actual economic growth. Therefore, stock prices are what's known as a leading indicator.
There are certain data points that economists pay close attention to because they believe they give us insight into the state of the business cycle. There are three types of indicators: leading, lagging, and coincident. Leading indicators are studied because economists believe they can predict changes in the economy a few quarters before a change occurs. Some of the leading indicators tracked include average weekly initial unemployment claims, building permits, the ISM index, and the University of Michigan's Consumer Sentiment Index.
Lagging indicators, meanwhile, show us what has recently happened, allowing us to assess our position in the current economy by seeing recent trends. Lagging indicators include the consumer price index for services, the duration of unemployment, GDP measurements, and the average prime rate charged by banks.
Coincident indicators are variables that change along with business cycle. In other words, coincident indicators are studied to get an understanding of what's happening right now--where we are in the business cycle. Coincident indicators include personal income, payroll employment, industrial production, and the level of manufacturing and trade sale.
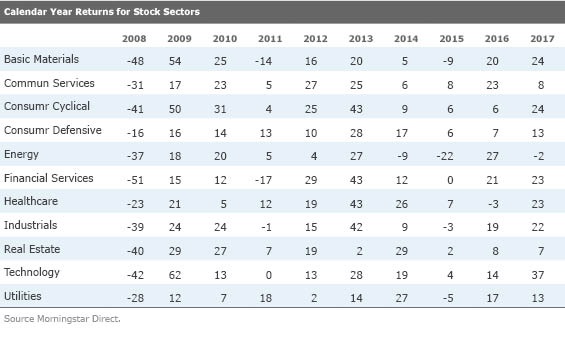
'Cyclical' Stock Performance You've no doubt heard the term "cyclical" and "noncyclical" stocks. Certain sectors tend to rise and fall at predictable times within the business cycle; those that are highly correlated with economic growth are referred to as "cyclicals." Of course, there are no guarantees with things like this--as you can see from the sector return table below, it's far from economic certainty. Investors would be wise to stick with a diversified allocation instead of market-timing stock sectors and asset classes. But here's the conventional wisdom.
Coming out of a trough, in the early bull market stage, interest rates are low and consumer spending is starting to pick up. Financials, technology, and consumer cyclicals such as autos, real estate, and retail can do well in this type of environment. Small caps tend to do better as well, as borrowing costs are lower and small caps tend to be U.S. companies.
In the midcycle phase, growth is still strong but slower than it was coming out of the trough. Interest rates are still low. As the economy continues to demonstrate strength, companies become more willing to make capital expenditures. Technology often benefits in this environment. Industrials and basic materials tend to do well as industrial production and manufacturing picks up.
In a more mature bull market, inflation can start to become a problem. As the Fed begins to tighten or raise interest rates to combat inflation, credit starts to dry up and lending slows down. Stocks look overvalued at this stage and bond prices rise. Investors may look to commodities to hedge inflation. Noncyclical, defensive sectors such as healthcare, consumer staples, and utilities, and energy tend to do relatively well in a recession and trough.
Where Are We in the Cycle? Now that I've strung you along for this long, I wish I had a better answer to your original question. Today's low unemployment, rising interest rates, and high stock valuations are characteristic of a late expansionary phase. But the fact that the S&P 500 was up nearly 22% in 2017 lends credence to the argument that we are still in the middle of the expansion, even though it seems like we've been here for a long time. This cycle has probably been extended due to the fact that we were in a zero interest rate environment for six plus years, which stimulated the economy by providing both consumers and businesses access to cheap money. And now, even as the Fed is attempting to raise interest rates to stave off inflation, Congress is attempting to stimulate the economy with fiscal stimulus measures such as tax cuts, which could extend this expansionary phase even longer.
And if certain stock sectors are supposed to perform in certain ways based on where we are in the cycle, as conventional wisdom dictates, they didn't seem to get the memo during this cycle. Though you can see that consumer defensives, healthcare, and utilities held up better than some other sectors during 2008's sell-off, and tech and consumer cyclicals were strong exiting the trough and entering the expansionary phase, the familiar patterns don't really emerge. Those same sectors along with financials, which are supposed to be early cycle outperformers, topped the charts in 2017 as well.
This could be a product of interest rates being so low for so long. Whereas past bubbles have focused on one particular asset or sector, such as technology or housing, some market pundits refer to the current environment as the "everything" bubble.
Although no one wants to see another recession, it's certain to happen at some point. Inflation doesn't seem too pernicious now, but it's picking up, and the Fed is taking notice. It could be that growth is slowing: Six of 11 stock sectors are in the red for the year to date. Admittedly, though, it's only the first quarter. How stocks and the economy will perform for the rest of the year is anyone's guess.
:quality(80)/cloudfront-us-east-1.images.arcpublishing.com/morningstar/JNGGL2QVKFA43PRVR44O6RYGEM.png)
:quality(80)/cloudfront-us-east-1.images.arcpublishing.com/morningstar/BC7NL2STP5HBHOC7VRD3P64GTU.png)