
Report Card: How Well Has the Morningstar Analyst Rating Performed?
On balance, our research finds that the Analyst Rating has succeeded in predicting funds' future performance.
/s3.amazonaws.com/arc-authors/morningstar/550ce300-3ec1-4055-a24a-ba3a0b7abbdf.png)
We recently published a global study on the performance of the Morningstar Analyst Rating. The study found that, on balance, the Analyst Rating has succeeded in predicting funds' future risk-adjusted returns, with higher-rated funds generally outperforming lower-rated funds. That said, it also identified areas where it appears there's opportunity to improve the way that analysts assign ratings.
In this piece, we provide background on the Analyst Rating, summarize the study's key takeaways, and elaborate on the most noteworthy findings. In addition, we more closely examine how well the Analyst Ratings of U.S. funds have performed and present opportunities for improvement revealed by the study's findings.
Background Launched globally in November 2011, the Analyst Rating is a forward-looking assessment of a fund's ability to outperform its peer group or a relevant benchmark over a market cycle, after accounting for risk and expenses. The Analyst Rating takes the form of Gold, Silver, Bronze, Neutral, or Negative, with Morningstar Medalist ratings reserved for funds the analysts have higher conviction in.
As part of the study into the Analyst Rating's performance, we analyzed the returns of more than 4,500 unique open-end funds that were assigned Analyst Ratings globally between November 2011 and April 2017, including dead funds. (We tracked subsequent returns of rated funds through Oct. 31, 2017.) We evaluated rated funds' performance using two techniques--a cross-sectional regression and an "event-study" framework.
Key Takeaways
- We found that, on balance, the Analyst Rating successfully predicted funds' future risk-adjusted returns, with higher-rated funds generally outperforming lower-rated funds.
- Using the regression technique, we found that the Analyst Rating was most predictive among equity and allocation funds, where Gold-, Silver-, and Bronze-rated funds significantly outperformed after accounting for expenses and common risk-factor exposures.
- Our findings were similar under the event-study method: The average Gold-rated fund produced 0.76% per year in alpha (versus a relevant Morningstar Category index) over a 60-month event horizon, whereas the average Neutral- and Negative-rated fund earned negative 0.04% and negative 0.22% of alpha per year, respectively.
- Though the Analyst Rating's predictiveness does not appear to be explained primarily by differences in cost or risk, its predictive power could vary significantly based on the time horizon, asset class, and geographic region concerned.
- In the United States, the Analyst Rating performed somewhat unevenly when measured using the event-study method: It largely succeeded in predicting the performance of foreign-stock and allocation funds but wasn't as effective in sorting U.S. stock and fixed-income funds by future returns.
- The study identifies several potential opportunities for improvement, including further enhancing the Analyst Rating's ability to sort funds based on future excess returns (before risk) and achieving better performance dispersion between ratings; these will be the subject of further study and, if warranted, methodology enhancement.
Key Findings: Global The Fama-MacBeth cross-sectional regression is a method used to estimate parameters for asset-pricing models, such as the capital asset pricing model. It is a two-step process: 1) run a time series regression per asset to determine its risk factor exposures, and 2) run a cross-sectional regression across assets to determine the risk premium for each factor.
We employed this technique to compute the average monthly return premium for investing in funds rated Gold, Silver, Bronze, and Negative versus investing in funds rated Neutral. Put another way, the premium for a given rating can be interpreted as the average return of that rating above or below a Neutral-rated fund after controlling for other variables including risk factors and expense differences. We label those average monthly premiums "Mean" in Exhibit 1.
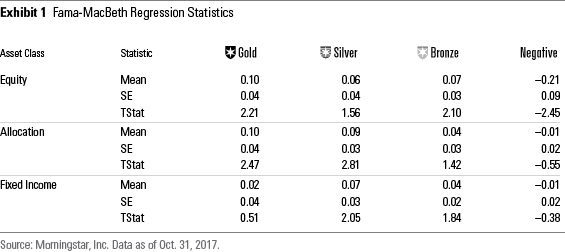
To summarize, in equities, medalist funds achieved higher risk-adjusted returns than Neutral-rated funds, as evidenced by the positive "Means" shown for Gold, Silver, and Bronze. On the flip side, Negative-rated funds underperformed Neutral-rated funds. What's more, all but one of these premiums was statistically significant (Silver-rated funds outperformed but at a lower t-statistic).
The findings were similar, if less conclusive, among rated allocation and fixed-income funds. Here, one finds that medalist funds generated superior risk-adjusted returns compared with Neutral-rated funds, and Negative-rated funds underperformed. However, the premiums for Bronze- and Negative-rated allocation funds were not statistically significant, with the same true of all but Silver-rated fixed-income funds. Moreover, Gold-rated fixed-income funds didn't sort monotonically like the other asset classes, as the premium for that cohort was less than those of Silver- and Bronze-rated bond funds. All the same, directionally, the Analyst Rating exhibits the ability to successfully sort funds in these areas.
Recognizing that path-dependency can impact the benefits that investors reap from the Analyst Ratings, we also examined how these premiums would have compounded over time. Specifically, we charted the growth of $1 by compounding the monthly premium series for each rating tier per asset class. For example, here is the growth of $1 for rated equity funds from November 2011 to October 2017:
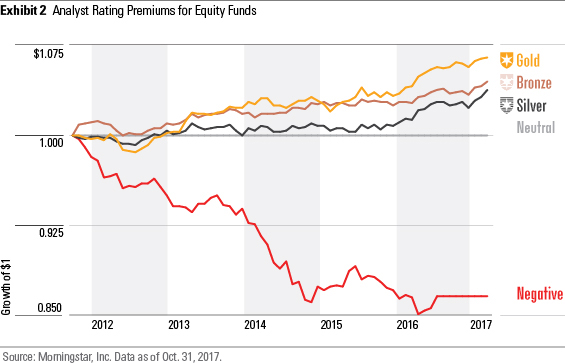
After controlling for common factors, we find these premiums compounded to meaningful differences in the benefits investors would have reaped over time from hypothetically investing in medalist funds versus Neutral- or Negative-rated funds.
Event-Study Framework The event study framework is a simpler, easier-to-intuit approach. At a given month-end, we grouped funds by their Analyst Rating and calculated the average return for the next one-, three-, six-, 12-, 36-, and 60-month horizons. The investor would have received these returns if he had held an equal-weighted portfolio of funds with Analyst Ratings at that month-end in U.S. dollars.
From these returns, we then subtracted funds' category average returns in U.S. dollars, with positive excess returns indicating outperformance versus category peers and negative excess returns denoting underperformance.
We reconstituted the rating groups each month-end between November 2011 and April 2017, calculating the future excess returns and averaging across the month-ends to produce a final average excess return for each cohort and event horizon. We ran three variations of the event-study framework: 1) excess return versus the category average; 2) excess return versus the category benchmark index; and 3) CAPM alpha versus the category benchmark index.
Exhibit 3: Cumulative Excess Returns vs. Category Average
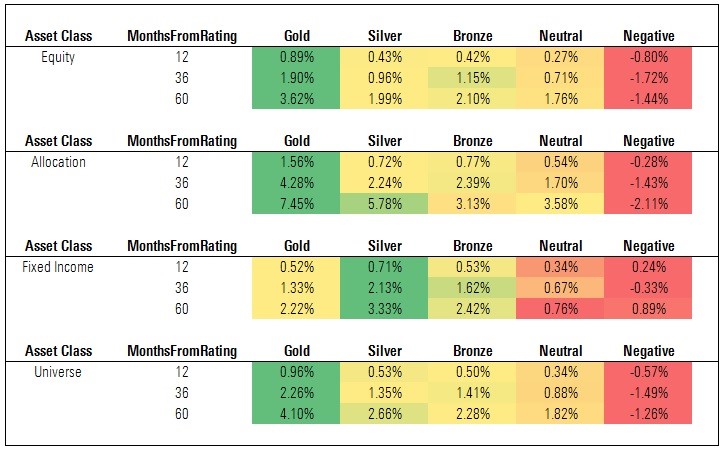
Source: Morningstar. Data as of Oct. 31, 2017.
The figures shown in Exhibit 3 are cumulative excess returns of each cohort versus a relevant category average. (That is, the cohort's cumulative return over each time horizon less the cumulative return of the average fund in each category represented in those cohorts.) In general, the Analyst Rating succeeded in sorting funds by future excess returns. This was most pronounced among equity and allocation funds, less so among fixed-income funds. It's also worth noting that while medalist funds generated positive excess returns, on average, so too did Neutral-rated funds. This will be the subject of future study, but it is worth noting that the sorting appears to improve once we account for risk (as shown in the "CAPM Alpha" findings further below).
Exhibit 4: Cumulative Excess Return vs. Category Index
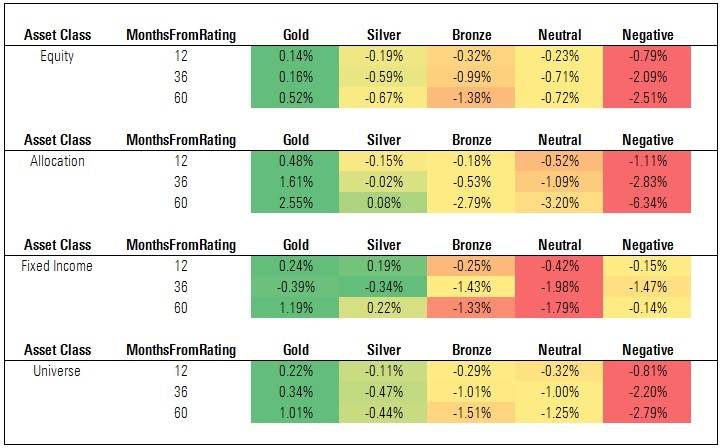
Source: Morningstar. Data as of Oct. 31, 2017.
The figures shown in Exhibit 4 are cumulative excess returns of each cohort versus a relevant category index. (That is, the cohort's cumulative return over each time horizon less the cumulative return of the index assigned to each category represented in those cohorts.) These findings are directionally similar to what we observed when examining rated funds' excess returns versus their category averages (Exhibit 3). However, the magnitude is less, reflecting the reality that the indexes do not levy fees and thus are harder to beat.
Nevertheless, we find that Gold-rated funds produced positive excess returns, on average, and there was meaningful separation between the excess returns of Gold-rated funds and Neutral- and Negative-rated funds. That said, the average Silver- and Bronze-rated fund did not generate positive excess returns versus the category indexes, and the average Neutral-rated fund had a smaller deficit to the category index than the average Bronze-rated fund. This, too, warrants closer examination, though it reflects differences in the relative level of risk taken by funds in these cohorts (for more, see the following discussion on CAPM Alpha).
Exhibit 5: Annual CAPM Alpha vs. Category Index
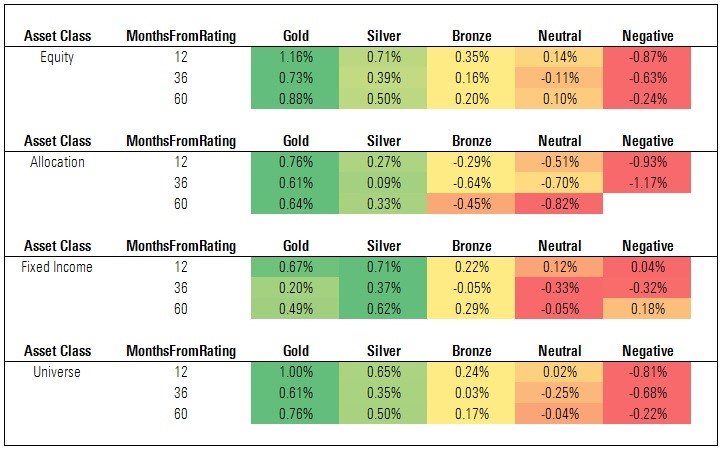
Source: Morningstar. Data as of Oct. 31, 2017.
The figures shown in Exhibit 5 are annualized CAPM alphas of each cohort versus a relevant category index. (That is, the cohort's annual alpha over each time horizon versus the index assigned to each category represented in those cohorts.) These findings are notable given that, unlike the event-study tests that measured excess returns versus the category average or category index, they're risk-adjusted for the index's volatility. This approach aligns well with the Analyst Rating methodology, as analysts are assessing funds' future risk-adjusted returns.
We find the Analyst Rating succeeds at sorting funds on this basis, especially over longer horizons. As a whole, medalist funds achieved positive average annual alphas over the 36- and 60-month event horizons, while Neutral- and Negative-rated funds suffered negative alphas. This monotonic pattern generally held across asset classes, though it was less pronounced among fixed-income funds.
It's worth noting that Silver- and Bronze-rated funds performed far better than Neutral- and Negative-rated funds when measured on CAPM alpha than when measured on excess returns versus the category average or category index. This was particularly evident among fixed-income funds. This underscores the centrality of risk in the analysts' assessment and, in turn, the importance of capturing this dimension when evaluating the success of the Analyst Ratings in predicting future performance.
Key Findings: U.S. In this section, we examine the performance of the Analyst Ratings assigned to U.S.-domiciled funds.
While the study does not break out the U.S. specifically (the regions studied included North America; Europe, Middle East, and Africa; and Asia-Pacific), we can extract those results following the same methods and procedures that we used to produce the global findings summarized above. For purposes of this section, we present the findings under the event-study framework.
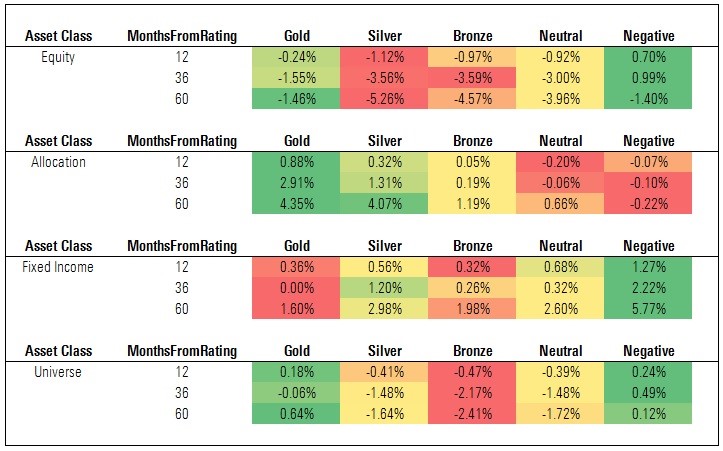
Exhibit 6: Cumulative Excess Returns vs. Category Average
Source: Morningstar. Data as of Oct. 31, 2017.
Here we find that the Analyst Rating has generally succeeded in sorting U.S. funds based on future average excess returns (examining the "universe" of rated funds). However, it is worth noting that every cohort notched positive average excess returns over each event horizon and there was less separation than hoped between Silver- and Bronze-rated funds and Neutral- and Negative-rated funds over the 60-month horizon.
Among equity funds, Gold-rated funds outperformed handily, but the performance of Silver- and Bronze- rated funds was disappointing when compared with Neutral- and Negative-rated funds. That picture brightened among allocation funds, as medalists outperformed the relevant category averages by a wider margin than Neutral- and Negative-rated funds did. But performance was mixed among fixed-income funds, where Neutral- and Negative-rated funds outperformed the category averages by as much, if not more, than medalists.
In reviewing these findings, it is worth noting that these excess returns are not adjusted to account for the level of risk taken (we explore this further in the "Annual CAPM Alpha vs. Category Index" section that follows).
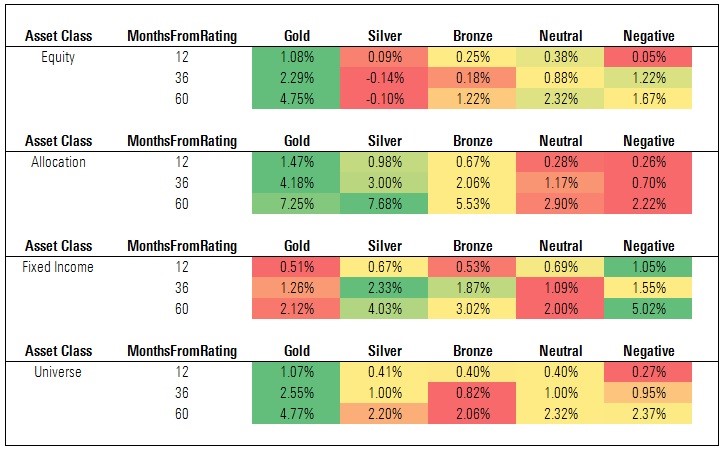
Exhibit 7: Cumulative Excess Returns vs. Category Index
Source: Morningstar. Data as of Oct. 31, 2017.
The findings in Exhibit 7 are directionally similar to what we found when evaluating the Analyst Rating based on excess returns versus category average, but are generally less in magnitude. Here, too, the Analyst Rating appears to succeed in sorting funds, in aggregate, with Gold-rated funds beating the relevant category indexes, on average, by a greater margin than any other cohort over the 60-month event horizon.
That said, as in the previous panel, we find that performance is mixed, especially at the asset-class level. Indeed, the average Gold-, Silver-, and Bronze-rated equity funds failed to beat the category index over the 60-month event horizon. Medalist funds in the allocation and fixed-income asset classes fared considerably better, notching positive excess returns, but Neutral- and Negative-rated bond funds did even better than higher-rated funds versus their benchmarks.
Exhibit 8: Annual CAPM Alpha vs. Category Index
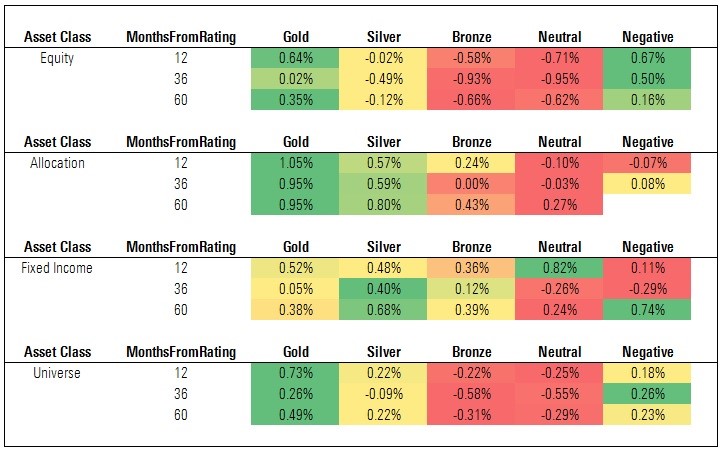
Source: Morningstar. Data as of Oct. 31, 2017.
The findings for rated U.S. funds improve considerably when we measure predictiveness based on future risk-adjusted performance, that is, annualized CAPM alpha versus the relevant category index. Here we find Gold- and Silver-rated funds notching positive alphas, on average, over the 60-month event horizon, with Neutral- and Negative-rated funds faring less well. The performance of the average Silver-rated fund is also notable in that it's a marked improvement from the earlier panel which showing that Silver-rated funds lagged the relevant indexes, on average, before accounting for volatility.
The improvement was even more pronounced within asset classes. For instance, the CAPM alpha for Neutral-rated fixed-income funds lags those of medalist bond funds over the 60-month event horizon. This represents a turnabout from the previous panel, which showed Neutral-rated fixed-income funds producing higher average excess returns (versus the category index) than Gold- and Bronze-rated bond funds over the 60-month horizon. Indeed, sorting improves nearly across the board when predictiveness was measured on this basis.
That said, we'd note some disappointments in the findings. First, the average Negative-rated fund earned a positive CAPM alpha over each event horizon in the aggregate sample. Given that our analysts reserve the Negative rating for funds they have the least conviction in, this showing is disappointing. Second, the average Bronze-rated fund failed to generate positive alpha and performed more-or-less in line with the average Neutral-rated fund over each event horizon. Third, medalist performance among equity funds was very uneven--the average Gold-rated fund produced alpha and topped other cohorts over the 60-month event horizon, but the average Silver- and Bronze-rated fund fell short.
Opportunities for Improvement One of the main reasons we conduct performance studies like these is to transparently assess how well our ratings have done and, with that, identify strengths and weaknesses that we can build upon. In that spirit, while we've noted the Analyst Rating's manifold successes thus far, it behooves us to reflect on its shortcomings and where there are opportunities to continuously improve.
- Risk-Unadjusted Performance: While the Analyst Ratings generally succeeded in sorting funds based on future excess returns, there are several opportunities for improvement. First, to achieve positive average excess returns among Silver- and Bronze-rated funds when measured versus a category index (the average Silver- and Bronze-rated fund suffered negative excess returns versus the category index). Second, to better identify underperforming funds in advance, as the average Neutral- and Negative-rated funds achieved positive excess returns compared with the category average. The Analyst Rating's performance strengthened once we accounted for risk, but we realize that some investors will define success as outperforming an index before risk, hence the potential opportunity to improve.
- Ratings Dispersion: At times, we observed that Silver- and Bronze-rated funds did not perform much better than lower-rated funds, on average. To succeed, the Analyst Rating should predict differences in future performance, with high-rated funds outperforming low-rated funds monotonically. The Analyst Rating hasn't consistently hit this mark and, thus, we need to determine ways to achieve better separation between ratings rungs in the future.
- U.S. Ratings: While the Analyst Ratings of U.S. funds generally succeeded in sorting funds based on future risk-adjusted performance, this was less evident when measuring based on future excess returns, especially among stock and bond funds. To be sure, market conditions have been challenging for some types of active funds prevalent among the U.S. stock and bond funds that our analyst rate, and this in turn has likely weighed on ratings efficacy. But it's important that we achieve greater separation and slope across the rated universe in the future. This will be the subject of further study.
Conclusion While it's important to remember that the Analyst Rating has yet to perform through a full market cycle, these findings offer encouragement. On balance, the Analyst Rating appears to have succeeded in sorting funds based on future excess returns, though its predictive power varied depending on the event horizon, asset class, or measurement technique used. The findings also reveal areas of weakness, as summarized above, and those insights will animate future efforts to continuously innovate and improve the Analyst Rating.
/cloudfront-us-east-1.images.arcpublishing.com/morningstar/OMVK3XQEVFDRHGPHSQPIBDENQE.jpg)
:quality(80)/s3.amazonaws.com/arc-authors/morningstar/550ce300-3ec1-4055-a24a-ba3a0b7abbdf.png)