
Fund Fees Paid by Investors Continue to Decline
Investors have been voting with their feet for low-cost funds, bringing down average fees again in 2016.
/s3.amazonaws.com/arc-authors/morningstar/de44b91c-c918-4e53-81c3-ce84542f3d36.jpg)
This is an excerpt from our recently released research paper on U.S. fund fees. The full paper is available here.
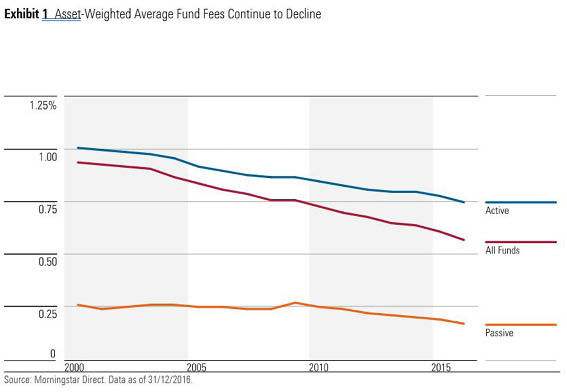
Morningstar's study of U.S. open-end mutual funds and exchange-traded funds finds that, on average, investors paid lower fund expenses in 2016 than ever before. The asset-weighted average expense ratio across funds (excluding money market funds and funds of funds) was 0.57% in 2016, down from 0.61% in 2015 and 0.65% three years ago. This decline stems from strong investor demand for lower-cost funds, principally passive funds and institutional share classes that carry lower fees. This is a positive trend, as mutual fund costs have a dollar-for-dollar impact on the returns investors ultimately realize.
Our study found that the simple average expense ratio of the largest 2,000 funds (in 2013), which accounted for 85% of assets in mutual funds and ETFs, was 0.72% in 2016, unchanged from 2015 and 2014. So on average, the fund industry is not cutting fees on the most widely held funds, which means the decline in average mutual fund fees paid by investors stems largely from investors' migration to lower-cost funds.
In this study, we used the asset-weighted average expense ratio instead of a simple average, or equal-weighted average, expense ratio. We feel an asset-weighted average is a better measure of the average cost borne by investors than a simple average, which can be skewed by a few outliers, such as high-cost funds that have low asset levels. In 2016, the simple average expense ratio for all funds was 1.14%, but funds with an expense ratio above that level held less than 10% of fund assets at the end of 2016. So it is very misleading when a fund company touts "below-average fees."
Trends in Active and Passive Funds Morningstar research has proven that mutual fund costs are a reliable predictor of future fund returns, in that low-cost mutual funds generally outperform their more-expensive peers. During the past few years, assets have been migrating toward lower-cost funds, and this trend has accelerated. Passive funds continue to be significantly cheaper than active funds, costing investors an average 0.17% in 2016, 58 basis points less than active funds. More recently, passive funds' cost advantage has grown, as the asset-weighted costs of passive funds decline faster than those of active funds.
With such a large cost difference between active and passive funds, flows into passive funds have grown rapidly in the past decade, with annual flows doubling from about $200 billion in 2007 to more than $400 billion in 2016. Also, starting in 2011, flows into passive funds (which includes ETFs and index funds) have outpaced flows into active funds every calendar year, despite the fact that active funds outnumber passive funds by eight to one.
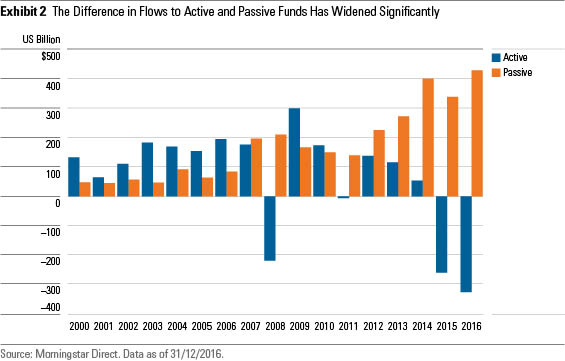
While passive funds have drawn more assets than active funds during these six years, the difference in flows for the two groups has also widened significantly. In 2016, flows into passive funds hit $429 billion, versus $326 billion of flows out of active funds, a difference of $754 billion. As a result of these flow trends, passive funds' market share has climbed from 23% in 2012 to 32% in 2016, which in turn has contributed to the declines in average fees investors pay for their funds. This is significant, as the asset-weighted average cost for passive funds of 0.17% is a fraction of the average active fund's 0.75%. With these trends, the overall asset-weighted average cost of a fund fell 7% in 2016, the largest annual decline, based on data going back to 1990.
Active Funds: Investors Shed Expensive Active Funds, Not All Active Funds The broad flow trends paint a challenging picture for active funds. However, flow trends among just active funds indicate that investors are selling out of expensive active funds, defined as funds with fees that rank within the second, third, fourth, and fifth quintiles (or that are more expensive than the cheapest 20% of funds), relative to other active funds. Investors are still buying low-cost active funds, albeit at levels significantly lower than that of passive funds. Flows into low-cost active funds, defined as funds with fees that fall in the cheapest 20% relative to other active funds, have generally been positive since 2000, except during the 2008 financial crisis (when, in aggregate, mutual funds and ETFs saw net outflows) and in 2015, when mutual fund and ETF net flows were only $79 billion, the lowest since 1993. In 2016, when mutual fund and ETF net flows inched up to $103 billion, flows into low-cost active funds recovered slightly.
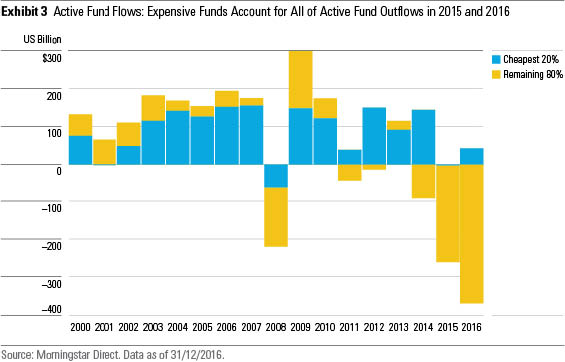
While investors appeared to show interest for pricier funds in the past, recent data suggests that this appetite has waned. Expensive funds started to see significant outflows in 2014 (of $91 billion), and two years later outflows reached $369 billion. These flows out of expensive funds have accounted for all the outflows out of active funds in the past two years. This acceleration in outflows for expensive funds also explains why the asset-weighted average fee for active funds exhibited a slightly higher rate of decline, relative to prior years, falling to 0.75% in 2016 from 0.80% in 2014.
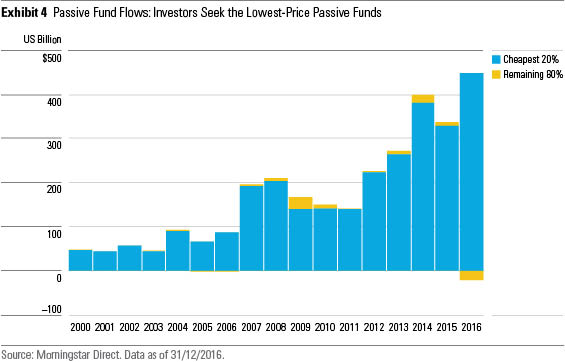
Passive Funds: Investors Have Always Gravitated to Passive Funds With the Lowest Fees Among passive funds, flows have historically been almost exclusively into the lowest-cost funds, or funds with fees that rank in the cheapest quintile (or 20%). This trend has held across the large asset class groups--U.S. equities, international equities, and fixed income--which receive the lion's share of flows. This phenomenon is evidenced by the large difference between the 0.17% asset-weighted average fee for passive funds and the 0.66% simple average in 2016, which is a much wider gap than seen among active funds.
With investors' focus on low cost, only two firms have really benefited from this rapid asset growth in passive funds: Vanguard and BlackRock/iShares. Both firms have a broad menu of passive funds with fees that are typically among the lowest among their Morningstar Category peers. During the past two years, Vanguard and BlackRock/iShares have sustained their market-dominating positions in the passive fund segment, at 49% and 18%, respectively.
Trends by Asset Class: U.S. Equities Exhibit the Largest Asset-Weighted Average Fee Declines Average fees paid by investors fell in six of the seven major asset classes from 2013 to 2016, with U.S. equity funds showing the largest decline. Not surprisingly, passive funds captured a larger share of the market in all six asset classes that experienced fee declines. Alternatives, on the other hand, exhibited rising average fees and a decline in market share of passive funds.
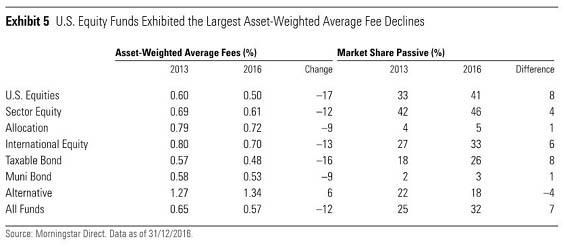
U.S. equity funds' asset-weighted average fees fell to 0.50% in 2016 from 0.60% in 2013, a decline of 17%, the largest across the seven asset class groups of funds. U.S. equity funds also have the largest percentage of assets in passive funds, at 41%, which rose from an already significant 33% in 2013. Taxable-bond funds exhibited the second-largest three-year decline in fees, as their asset-weighted average fees fell to 0.48% in 2016 from 0.57% in 2013, a decline of 16%. However, passive funds accounted for a much lower 26% of all taxable-bond funds relative to U.S. equity funds. As for international-equity funds, their asset-weighted average fees fell 13%, to 0.70% in 2016, from 0.80% three years ago. Passive funds now account for 33% of assets, up from 27% in 2013.
Alternative funds were alone in exhibiting rising asset-weighted average fees, to 1.34% in 2016 from 1.27% in 2013. This rise in fees is mostly attributable to a decline of passive funds as a percentage of assets, to 18% in 2016 from 22% in 2013. Another reason for a rise in fees was performance chasing. Expensive active funds, such as
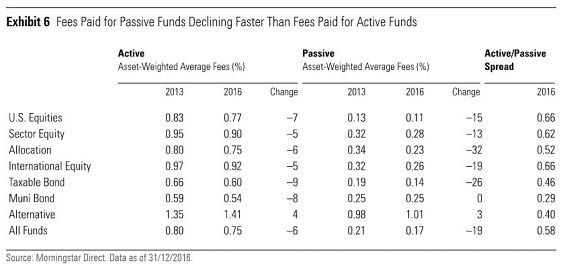
While the asset-weighted average cost of an active U.S. equity fund fell from 0.83% in 2013 to 0.77% in 2016, these funds are still at a big cost disadvantage to passive funds. Indeed, as the average asset-weighted cost of a passive U.S. equity fund also fell (by 2 basis points to 0.11%), there's still a 0.66% gap separating the two. The same applies to international-equity funds, where on average investors are paying about 66 basis points more for active funds than passive offerings.
Conclusion Investors' preference for low-cost investing has grown starker during the past few years. The exodus out of active funds has been limited to the most-expensive active funds; low-cost active funds enjoyed positive, albeit small inflows. The shedding of these expensive active funds, which began in 2014 with outflows of $91 billion, reached $369 billion in 2016. Passive funds continue to enjoy larger flows every year, but only into funds with low fees relative to other passive funds. Thanks to these trends, investors paid an average of 0.57% for their fund holdings in 2016. This cost decline of 7% from the year prior was the largest ever, based on data going back to 1990. Falling fund costs are certainly a positive trend for investors, as mutual fund costs have a dollar-for-dollar impact on the returns investors ultimately realize.
/cloudfront-us-east-1.images.arcpublishing.com/morningstar/HDPMMDGUA5CUHI254MRUHYEFWU.png)
/cloudfront-us-east-1.images.arcpublishing.com/morningstar/OMVK3XQEVFDRHGPHSQPIBDENQE.jpg)
:quality(80)/s3.amazonaws.com/arc-authors/morningstar/de44b91c-c918-4e53-81c3-ce84542f3d36.jpg)